Riverfront Income Property with
For Sale
Contact for pricing
751 W Riverside Dr, Coquille, OR 97423
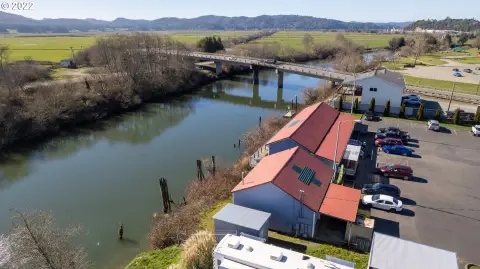
Income-generating riverfront property with long-term leases and a vacant shop.
Property Size3,456 SF
Price / SF$158.85
Days on Market1046
Property Features for 751 W Riverside Dr
General Information
Standard status
Active
Size
3,456 SF
Total Parking Spaces
30
Property subtype
Office, Retail
Zoning
C-2
Occupancy
80%
Lease Type
NN
Building Details
Year Built
1960
Buildings
2
Tenancy
Multi
Listing Agency:
Pacific Properties
Listed By:
Joel Sweet · License #201214598
(541) 269-5263
Source:
Crexi
Added: Dec 5, 2023
Changed: Oct 8
Last Checked: Oct 14 at 7:48PM
Displayed information is deemed reliable but is not guaranteed and should be independently verified. All listing content including descriptions, pricing, images are the copyrighted material of Pacific Properties

Ask AI about this property
Review the available facts, identify missing information and prepare questions for the agent.
Investment Insights
Based on property information with market context.
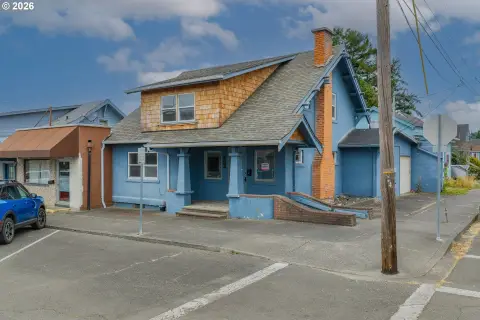
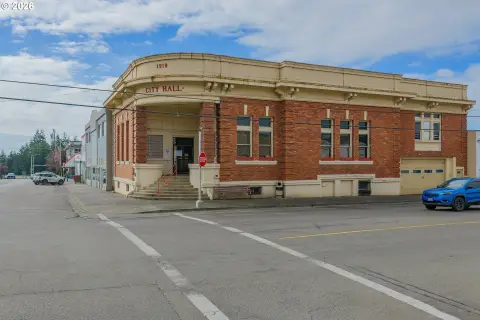
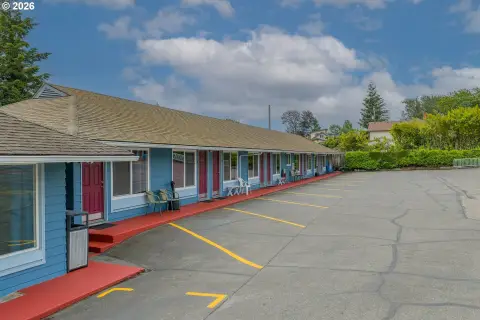
This riverfront income property generates $3,250 per month from long-term leases. The buildings feature metal roofs, hardy cement siding, and massive concrete pillar foundations. The layout includes a common lobby area leading to clean, updated spaces with attractive finishes and fixtures. A large deck overlooks the riverfront. A separate shop with an office and bathroom is currently vacant and could be leased for $950 per month. The owner covers taxes, insurance, water/sewer, and garbage, while tenants pay for electric, gas, and janitorial services. The property includes a large paved parking area. The property size is 3,456 square feet. This property is suitable for retail and commercial use.
Key Highlights
- River front income property generating $3,250 per month with long term leases.
- Separate vacant shop with office and bathroom, potential for additional $950/month lease income.
- Buildings built to last with metal roof, hardy cement siding, and massive concrete pillar foundation.
Financial Insights
Estimated NOI and Cap Rate
NOI / Yr
$36,578
Cap Rate
6.66%
Suggested Prices Based on Cap Rates
Cap Rate 5%
$731,560
$731.6K
Cap Rate 7%
$522,543
$522.5K
Cap Rate 9%
$406,422
$406.4K
Market Conditions
NOI Build-Up for 3,456 SF
Gross rent
$58.1K $16.80/SF
− Vacancy
−$5.8K −$1.68/SF
EGI
$52.3K $15.12/SF
− OpEx
−$15.7K −$4.54/SF
NOI
$36.6K $10.58/SF
Area
Coos County, OR
Vacancy
10.00%
Lease Rate
$16.80 /SF/Yr
Expense Ratio
30.00%
Simulate Cap Rate and NOI
Suggested Prices Based on Cap Rates
Cap Rate 5%
$731,560
Cap Rate 7%
$522,543
Cap Rate 9%
$406,422
Alternative Uses
Best Use
Retail
$522.5K
$457.2K – $609.6K
NOI $36,578 @ 7.0% cap · market cap 6.66%
Second Best
—
—
no second resolved use
Theoretical Best
Office A
$625.6K
$547.4K – $729.9K
NOI $43,794 @ 7.0% cap · market cap 7.98%
Zoning and permitted uses should be independently verified with authorities.
How Realmo checks its estimates
Property Analytics
Current Use
Location Intelligence
Trade Area within ½ mile
9
Businesses Nearby
Explore this area
Business Placement
Demographics for 97423, OR
6,986
Population
2,835
Households
2.5
Avg Household Size
49
Median Age
19%
College-Educated
91%
High-School Grad
126.6 sq mi
ZIP Area
55
Density / Sq Mi
$57,665
Median Household Income
$36,250
Median Earnings
$1,150
Median Rent
$266,200
Median Home Value
Market
Vacancy Rate% for Retail in West region




Frequently Asked Questions
What type of property is this?
Retail property - Income-generating riverfront property with long-term leases and a vacant shop.
Where is this retail property located?
The property is located at 751 W Riverside Dr Coquille, OR.
What is the asking price?
The asking price for this property is $549,000.
What are key features of this property?
This property features: River front income property generating $3,250 per month with long term leases.; Separate vacant shop with office and bathroom, potential for additional $950/month lease income.; Buildings built to last with metal roof, hardy cement siding, and massive concrete pillar foundation.


