Restored Historic Duplex
For Sale
$419,000
201 E VOORHIS AVENUE, Deland, FL 32724
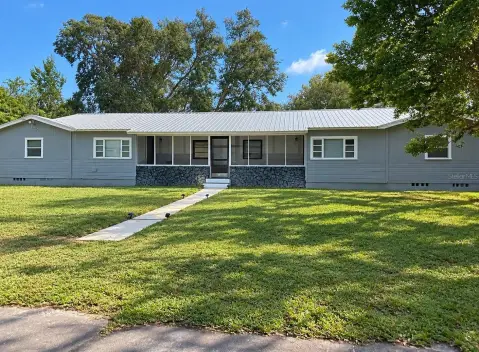
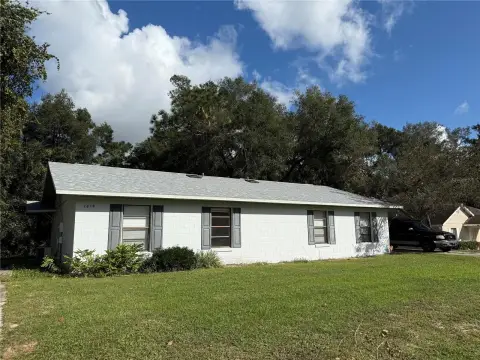
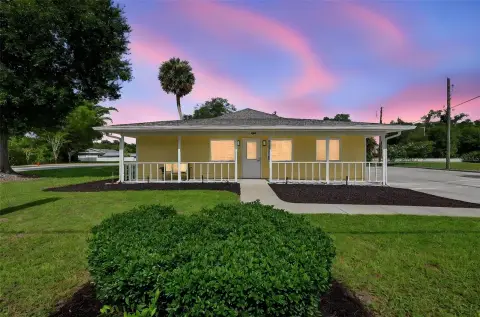
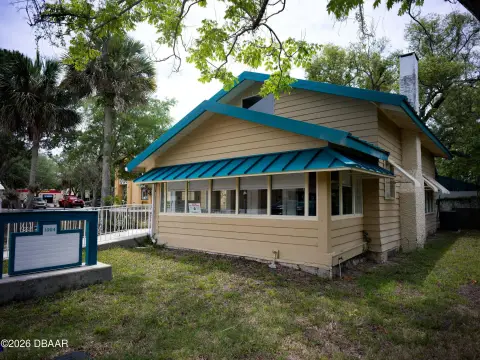
Restored three-story duplex with two separate units and updated interior and exterior finishes in DeLand’s Historic Garden District.
Property Size1,960 SF
Price / SF$213.78
Days on Market111
Property Features for 201 E VOORHIS AVENUE
General Information
Standard status
Active
Size
1,960 SF
Property subtype
Duplex
Additional Details
Multifamily Units
2
Amenities
0.14 acres, Historic District
Metal
Public Sewer
Additional parcels description:, Parcel Number: 70-16-16-1203-30, Public Survey Range: 30, Public Survey Section: 16, Annual Amount: $7,067.38, Tax Block: 12, Tax Book Number: 8058, Legal Description: LOTS 33 & 34 EXC IRREG PARCEL MEAS 78.20 FT ON E/L & MEAS 43.92 FT ON S/L & MEAS 42.37 FT ON N/L SUB BLK 12 HOWRYS ADD DELAND MB 18 PG 9 PER OR 4700 PG 4859 PER OR 6795 PG 3673 PER OR 7383 PG 4847 PER OR 7464 PG 4551, Lot: 0330, Year: 2026, Zoning: OUT/CNTY
Laminate, Tile, Wood
Central Air
Central, Electric
Inside
Listing ID: MFRO6422387, Standard Status: Active, MLS Status: Active, Property Subtype: Duplex, On market as of 2026-07-06, 73 days on market, Special Conditions: None
Assigned, Driveway, Off Street
Blinds, Wood Frames
5 total bedrooms
Built in 1937, Living area: 1960, Living area units: Square Feet, Levels: Three Or More, Construction Materials: Frame, Wood Siding
Subdivision: OUT OF COUNTY, MLS Area (Major): 32724 - Deland, County/Parish: Volusia
3 total bathrooms
Cable Available, Sewer Connected, Water Connected, Water Source: Public, 2 separate electric meters
Crawlspace
Close Of Escrow
Electricity
Road Responsibility: Public Maintained Road, Road Surface: Concrete, Paved
Patio/Porch Features: Front Porch, Rear Porch, Fence, Rain Gutters
Ceiling Fans(s), Thermostat, Walk-In Closet(s), Window Treatments
Security Lights
Enhanced Accessible
Dishwasher, Dryer, Electric Water Heater, Microwave, Range, Refrigerator, Washer
Amenities: Handicap Modified
Building Details
Year Built
1937
Stories
3
Tenancy
Multi
Listing Agency:
REALTY WORLD PREFERRED
(407) 834-7368
Listed By:
Gillian Newman · License #3471587
Source:
Miharaandassociates
Added: Jul 6
Changed: Oct 21
Last Checked: Oct 23 at 8:27AM
Displayed information is deemed reliable but is not guaranteed and should be independently verified. All listing content including descriptions, pricing, images are the copyrighted material of REALTY WORLD PREFERRED

Ask AI about this property
Review the available facts, identify missing information and prepare questions for the agent.
Investment Insights
Based on property information with market context.
This restored three-story duplex offers two separate residential units. One unit features three bedrooms and one bathroom, while the second unit features two bedrooms and 1.5 bathrooms. Reported improvements include updated flooring, interior and exterior paint, and refreshed bathrooms, with the property described as well maintained.
The duplex is located in DeLand’s Historic Garden District, approximately one mile from Stetson University and near Historic Downtown DeLand. Local access is described to include shopping, restaurants, parks, and community events.
With long-term tenants already in place, the property provides an income-producing residential duplex configuration that combines historic character with modern updates to key interior finishes and bathrooms.
The duplex is located in DeLand’s Historic Garden District, approximately one mile from Stetson University and near Historic Downtown DeLand. Local access is described to include shopping, restaurants, parks, and community events.
With long-term tenants already in place, the property provides an income-producing residential duplex configuration that combines historic character with modern updates to key interior finishes and bathrooms.
Key Highlights
- Restored 1937 three‑story duplex in DeLand’s Historic Garden District
- Two separate units: one 3‑bedroom/1‑bath and one 2‑bedroom/1.5‑bath
- Updated bathrooms and improved flooring throughout
Financial Insights
Estimated NOI and Cap Rate
NOI / Yr
$17,194
Cap Rate
4.10%
Suggested Prices Based on Cap Rates
Cap Rate 5%
$343,880
$343.9K
Cap Rate 7%
$245,629
$245.6K
Cap Rate 9%
$191,044
$191.0K
Market Conditions
NOI Build-Up for 1,960 SF
Gross rent
$27.3K $13.92/SF
− Vacancy
−$2.7K −$1.39/SF
EGI
$24.6K $12.53/SF
− OpEx
−$7.4K −$3.76/SF
NOI
$17.2K $8.77/SF
Area
Volusia County, FL
Vacancy
9.97%
Lease Rate
$13.92 /SF/Yr
Expense Ratio
30.00%
Simulate Cap Rate and NOI
Suggested Prices Based on Cap Rates
Cap Rate 5%
$343,880
Cap Rate 7%
$245,629
Cap Rate 9%
$191,044
Alternative Uses
Best Use
Multifamily LT 5
$245.6K
$214.9K – $286.6K
NOI $17,194 @ 7.0% cap · market cap 4.10%
Second Best
Apartment 5plus
$213.4K
$186.7K – $248.9K
NOI $14,935 @ 7.0% cap · market cap 3.56%
Theoretical Best
Office A
$577.9K
$505.7K – $674.2K
NOI $40,454 @ 7.0% cap · market cap 9.65%
Zoning and permitted uses should be independently verified with authorities.
How Realmo checks its estimates
Property Analytics
Unlock full access to Insights
Subscribe to Realmo Intelligence
Open Analytics
Lease Details
2
Residential units
Multi-tenant
Tenancy
Location Intelligence
Trade Area within ½ mile
1,665
Businesses Nearby
Explore this area
Business Placement
Demographics for 32724, FL
40,559
Population
18,555
Households
2.2
Avg Household Size
45
Median Age
31%
College-Educated
92%
High-School Grad
83.8 sq mi
ZIP Area
484
Density / Sq Mi
$72,729
Median Household Income
$41,204
Median Earnings
$1,184
Median Rent
$283,100
Median Home Value
Check the figures for this property
Cap Rate, Value Estimation, Potential NOI and more
View Realmo Analytics
Market
Vacancy Rate% for Multifamily in South region




Frequently Asked Questions
What type of property is this?
Duplex - Restored three-story duplex with two separate units and updated interior and exterior finishes in DeLand’s Historic Garden District.
Where is this duplex located?
The property is located at 201 E VOORHIS AVENUE Deland, FL.
What is the asking price?
The asking price for this property is $419,000.
What are key features of this property?
This property features: Restored 1937 three‑story duplex in DeLand’s Historic Garden District; Two separate units: one 3‑bedroom/1‑bath and one 2‑bedroom/1.5‑bath; Updated bathrooms and improved flooring throughout


