Two-Family Brick Duplex with
For Sale
$1,070,000
2008 E 52nd St, Brooklyn, NY 11234
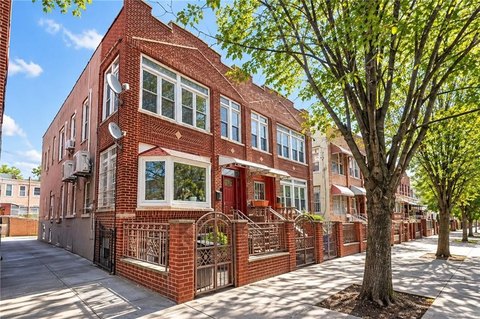
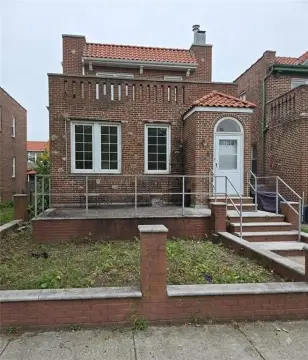
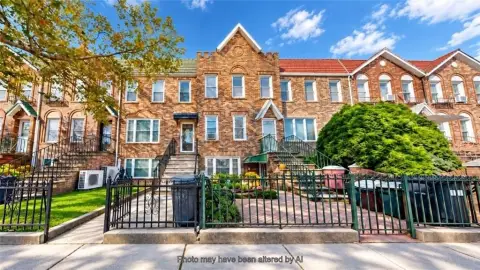
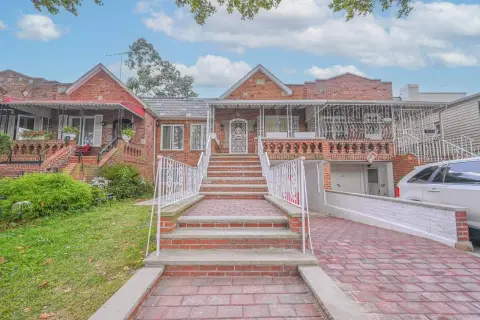
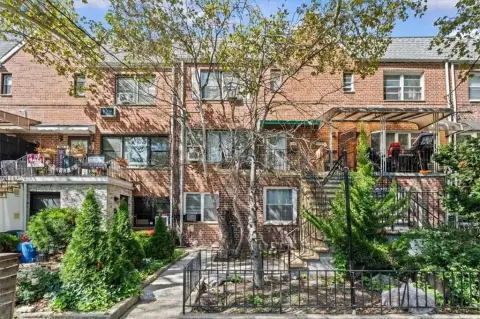
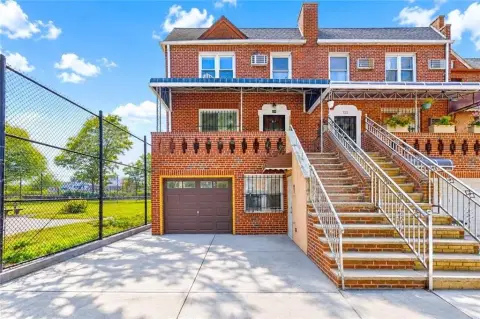
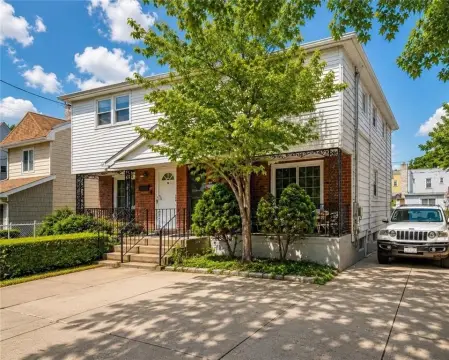
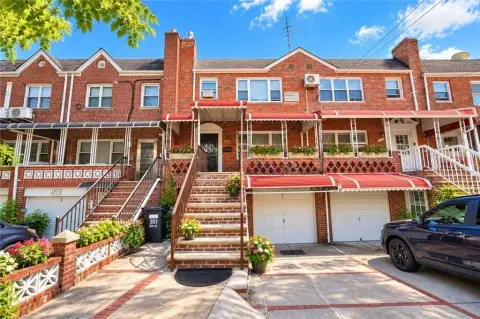
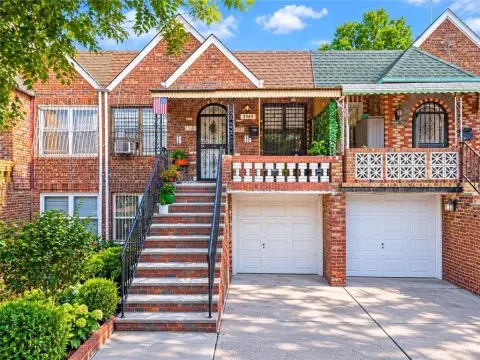
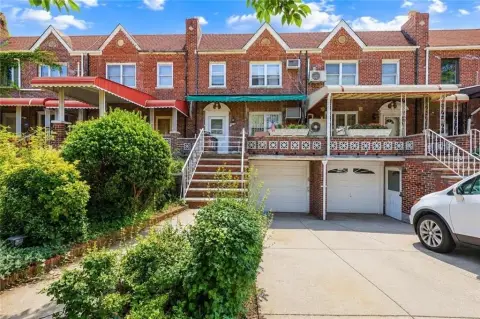
Renovated two-unit brick duplex with updated systems, porch space, and private rear parking with Tesla charging.
Property Size2,108 SF
Days on Market124
Property Features for 2008 E 52nd St
General Information
Standard status
Active
Size
2,108 SF
Property subtype
Multi Family
Taxes and HOA fees
Annual Taxes
$7,983
Building Details
Building Size
2,108 SF
Year Built
1965
Listing Agency:
Century 21 Homefront Realty
Listed By:
Muhammad Noman
(718) 252-6060
Source:
Elliman
Added: Jun 22
Changed: Oct 19
Last Checked: Oct 20 at 9:50PM
Displayed information is deemed reliable but is not guaranteed and should be independently verified. All listing content including descriptions, pricing, images are the copyrighted material of Century 21 Homefront Realty

Ask AI about this property
Review the available facts, identify missing information and prepare questions for the agent.
Investment Insights
Based on property information with market context.
This renovated two-family brick duplex was completely gutted and rebuilt and now offers a finished, turn-key layout across three levels. The lower level includes a set of hookups for an additional kitchenette and bathroom, providing flexibility for future configuration. The first-floor rental unit is a two-bedroom apartment with a granite countertop kitchen and newly installed wood floors beneath newly carpeted flooring. The upper duplex spans the second and third floors and features an open-concept kitchen, three sun-filled bedrooms, an office nook, and an additional room suitable for a walk-in closet. Modern improvements include a brand-new boiler and a newly updated electrical system with an updated panel.
The property offers outdoor space with a front porch and a rear porch. Private rear parking is available and includes a Tesla charging station. The home is located at 2008 E 52ND ST in Brooklyn, NY 11234. The first-floor unit is currently rented for $2,400 per month and includes a lease through June 2026, with the possibility to deliver vacant for the right price. Newly purchased furniture may be included for the right offer.
For buyers or operators seeking a renovated, systems-updated two-family with flexible interior options and on-site parking, this configuration supports both straightforward tenancy and potential customization. The unit mix and existing rental status may appeal to those who want immediate income from the first-floor apartment while planning future use of the additional lower-level hookups.
The property offers outdoor space with a front porch and a rear porch. Private rear parking is available and includes a Tesla charging station. The home is located at 2008 E 52ND ST in Brooklyn, NY 11234. The first-floor unit is currently rented for $2,400 per month and includes a lease through June 2026, with the possibility to deliver vacant for the right price. Newly purchased furniture may be included for the right offer.
For buyers or operators seeking a renovated, systems-updated two-family with flexible interior options and on-site parking, this configuration supports both straightforward tenancy and potential customization. The unit mix and existing rental status may appeal to those who want immediate income from the first-floor apartment while planning future use of the additional lower-level hookups.
Key Highlights
- Renovated 2‑unit brick duplex built in 1965 with 2,108 SF total and renovated open‑concept living space
- First‑floor 2BR rental has granite countertop kitchen and brand‑new wood floors; currently rented for $2,400/month with lease through June 2026
- Lower‑level finished space includes hookups for an additional kitchenette and bathroom (additional customization potential)
Financial Insights
Estimated NOI and Cap Rate
NOI / Yr
$73,826
Cap Rate
6.90%
Suggested Prices Based on Cap Rates
Cap Rate 5%
$1,476,520
$1.5M
Cap Rate 7%
$1,054,657
$1.1M
Cap Rate 9%
$820,289
$820.3K
Market Conditions
NOI Build-Up for 2,108 SF
Gross rent
$107.5K $51.00/SF
− Vacancy
−$2.0K −$0.97/SF
EGI
$105.5K $50.03/SF
− OpEx
−$31.6K −$15.01/SF
NOI
$73.8K $35.02/SF
Area
Brooklyn, NY
Vacancy
1.90%
Lease Rate
$51.00 /SF/Yr
Expense Ratio
30.00%
Simulate Cap Rate and NOI
Suggested Prices Based on Cap Rates
Cap Rate 5%
$1,476,520
Cap Rate 7%
$1,054,657
Cap Rate 9%
$820,289
Alternative Uses
Best Use
Multifamily LT 5
$1.05M
$922.8K – $1.23M
NOI $73,826 @ 7.0% cap · market cap 6.90%
Second Best
Apartment 5plus
$919.4K
$804.4K – $1.07M
NOI $64,355 @ 7.0% cap · market cap 6.01%
Theoretical Best
Specialty Retail
$1.75M
$1.53M – $2.04M
NOI $122,180 @ 7.0% cap · market cap 11.42%
Zoning and permitted uses should be independently verified with authorities.
How Realmo checks its estimates
Property Analytics
Contact the owner directly
Get the owner's phone numbers and email
Open Analytics
Location Intelligence
Trade Area within ½ mile
1,945
Businesses Nearby
Explore this area
Business Placement
Demographics for 11234, NY
92,133
Population
35,167
Households
2.6
Avg Household Size
41
Median Age
39%
College-Educated
89%
High-School Grad
7.4 sq mi
ZIP Area
12,450
Density / Sq Mi
$94,434
Median Household Income
$55,206
Median Earnings
$1,771
Median Rent
$746,800
Median Home Value
Check the figures for this property
Cap Rate, Value Estimation, Potential NOI and more
View Realmo Analytics
Market
Vacancy Rate% for Multifamily in Northeast region
Frequently Asked Questions
What type of property is this?
Duplex - Renovated two-unit brick duplex with updated systems, porch space, and private rear parking with Tesla charging.
Where is this duplex located?
The property is located at 2008 E 52nd St Brooklyn, NY.
What is the asking price?
The asking price for this property is $1,070,000.
What are key features of this property?
This property features: Renovated 2‑unit brick duplex built in 1965 with 2,108 SF total and renovated open‑concept living space; First‑floor 2BR rental has granite countertop kitchen and brand‑new wood floors; currently rented for $2,400/month with lease through June 2026; Lower‑level finished space includes hookups for an additional kitchenette and bathroom (additional customization potential)


