Three-Tenant Retail Office
2007 West Parker Road Jonesboro, AR 72404
2007 West Parker Road, Jonesboro, AR, 72404
Contact for pricing
For Sale
Contact for pricing
Well-maintained building with three established tenants, positioned as a Walmart outparcel off I-555 in Jonesboro.
Property Size5,820 SF
Price / SF$151.03
Days on Market58
Property Features for 2007 West Parker Road
General Information
- Standard status
- Active
- Size
- 5,820 SF
- Property subtype
- Retail, Office
Building Details
- Year Built
- 2016
Listing agency
Haag Brown Commercial Real Estate and Development
(870) 336-8000
Listed by
Nathan Eller · License #EB 00077644
Source
Crexi
Added: May 27 Updated: Jul 10 at 1:52PM Checked: Jul 22 at 10:28AM
Displayed information is deemed reliable but is not guaranteed and should be independently verified. All listing content including descriptions, pricing, images are the copyrighted material of Haag Brown Commercial Real Estate and Development
Investment Insights
Based on property information with market context.
This three-tenant retail/office property includes a well-maintained professional building configured to serve both retail and office users. The property is currently occupied by three established tenants, and the ownership period following redevelopment has maintained 100% occupancy with no tenant turnover, reflecting consistent in-place operations.
The building is strategically positioned as an outparcel to the dominant Walmart Supercenter and located just off Interstate 555. The site is described as having exceptional visibility and convenient accessibility, supported by its placement within one of Jonesboro’s most active retail corridors. The property is also noted as being surrounded by high-income residential neighborhoods.
For investors or owner-operators seeking a stabilized, income-producing asset, the current tenant roster and continued occupancy provide a straightforward starting point. The retail/office mix can appeal to tenants looking for exposure in a high-traffic retail setting while maintaining a professional environment for day-to-day operations. The property’s placement near a major anchor and its proximity to interstate access are central considerations for prospective buyers evaluating the tenant mix and long-term tenancy profile.
The building is strategically positioned as an outparcel to the dominant Walmart Supercenter and located just off Interstate 555. The site is described as having exceptional visibility and convenient accessibility, supported by its placement within one of Jonesboro’s most active retail corridors. The property is also noted as being surrounded by high-income residential neighborhoods.
For investors or owner-operators seeking a stabilized, income-producing asset, the current tenant roster and continued occupancy provide a straightforward starting point. The retail/office mix can appeal to tenants looking for exposure in a high-traffic retail setting while maintaining a professional environment for day-to-day operations. The property’s placement near a major anchor and its proximity to interstate access are central considerations for prospective buyers evaluating the tenant mix and long-term tenancy profile.
Key Highlights
- 2016‑built, well‑maintained retail/office building with 3 established tenants
- 100% occupancy reported since redevelopment, with no tenant turnover
- Positioned as an outparcel to the Walmart Supercenter off I‑555 in Jonesboro, AR
Local Financial Insights For Office B
Simulate Cap Rate and NOI
NOI Build-Up
- Vacancy
- income lost from leasable area expected to sit empty during the year — subtracted from gross rent.
- EGI (Effective Gross Income)
- gross rent minus vacancy losses — the realistic income before paying operating costs.
- OpEx (Operating Expenses)
- recurring costs to operate the property (property tax, insurance, utilities, maintenance, management) — excludes financing and capital improvements.
- NOI (Net Operating Income)
- income a property generates after operating costs but before financing and taxes.
| Component | $ | $/SF |
|---|---|---|
| Gross rent | $82.4k | $14.16 |
| − Vacancy | −$9.9k | −$1.70 |
| EGI | $72.5k | $12.46 |
| − OpEx | −$18.1k | −$3.12 |
| NOI | $54.4k | $9.35 |
5,820 SF · lease $14.16/SF/yr · vacancy 12.00% · expense 25.00%
Alternative Uses
Best Use
Office B
$777.0K
$679.9K – $906.5K
NOI $54,391 @ 7.0% cap · market cap 6.19%
Second Best
Retail
$708.3K
$619.7K – $826.3K
NOI $49,578 @ 7.0% cap · market cap 5.64%
Theoretical Best
Office A
$1.02M
$891.6K – $1.19M
NOI $71,325 @ 7.0% cap · market cap 8.11%
Zoning and permitted uses should be independently verified with local authorities.
Property Analytics
Property Profile
Location Intelligence
Current Use by Public Records
Vue Salon & Spa
Hair Salon
Similar For Sale Nearby
FAQs
What type of property is this?
Retail space - Well-maintained building with three established tenants, positioned as a Walmart outparcel off I-555 in Jonesboro.
Where is this retail space located?
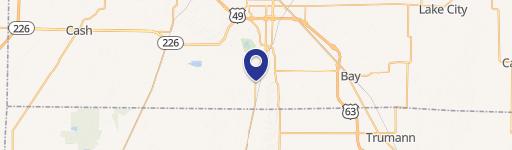
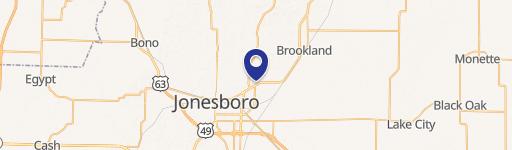
The property is located at 2007 West Parker Road Jonesboro, AR.
What is the asking price?
The asking price for this property is $879,000.
What are key features of this property?
This property features: 2016‑built, well‑maintained retail/office building with 3 established tenants; 100% occupancy reported since redevelopment, with no tenant turnover; Positioned as an outparcel to the Walmart Supercenter off I‑555 in Jonesboro, AR



