Redeveloped Retail
For Sale
$995,000
2003 E Kearney St, Springfield, MO 65803
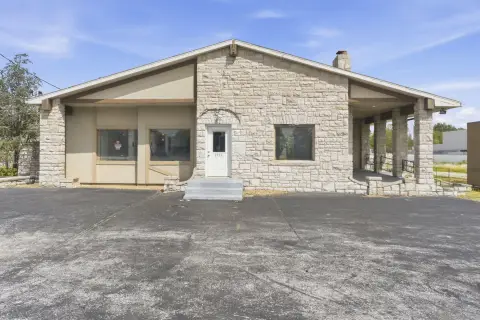
Updated commercial center offering flexible suites for single-tenant or multi-tenant occupancy in Northeast Springfield.
Property Size5,410 SF
Price / SF$183.92
Days on Market47
Property Features for 2003 E Kearney St
General Information
Standard status
Active
Size
5,410 SF
Property subtype
Street Retail
Building Details
Building Size
5,410 SF
Year Built
1968
Properties For Sale
at 2003 E Kearney St Contact usSuite A
Size
1,506 SF
Lease Type
NNN
Suite B
Size
2,240 SF
Lease Type
NNN
Suite C
Size
1,664 SF
Lease Type
NNN
Listing Agency:
SVN | Rankin Co
Listed By:
Lee McLean III, CCIM
(417) 887-8826
Source:
Thebrokerlist
Added: Aug 20
Changed: Sep 5
Last Checked: Oct 4 at 6:13AM
Displayed information is deemed reliable but is not guaranteed and should be independently verified. All listing content including descriptions, pricing, images are the copyrighted material of SVN | Rankin Co
Investment Insights
Based on property information with market context.
This retail center at 2003 E Kearney St has an updated exterior following redevelopment and offers adaptable occupancy options. The building can accommodate one user in 5,410 SF or be configured for 2 to 3 tenants, with suites available down to 1,506 SF. The landlord will provide white-box delivery for subdivided spaces. The stated square footage excludes the full basement. Originally built in 1968, the property combines existing retail infrastructure with refreshed presentation.
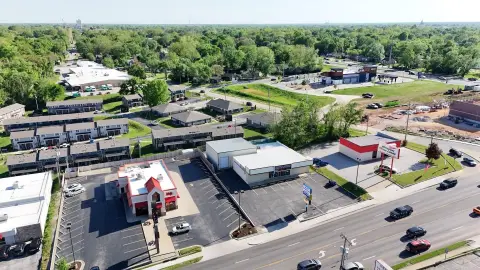
The center is positioned just off the Glenstone and Kearney intersection in Northeast Springfield. It is directly across from Big Shots Golf and shadow-anchored by Walmart Supercenter, with nearby additions including Freddy's, Chick-fil-A, Whataburger, Take 5 Oil Change, 7-Brew, and Kum & Go. Bass Pro Shops headquarters is less than 1/2 mile away, and multiple conference centers and hotels are located in the immediate area.
The property receives tax abatement through the Kearney Street Redevelopment Plan, with reduced real estate taxes described as locked in for 10 years.
The center is positioned just off the Glenstone and Kearney intersection in Northeast Springfield. It is directly across from Big Shots Golf and shadow-anchored by Walmart Supercenter, with nearby additions including Freddy's, Chick-fil-A, Whataburger, Take 5 Oil Change, 7-Brew, and Kum & Go. Bass Pro Shops headquarters is less than 1/2 mile away, and multiple conference centers and hotels are located in the immediate area.
The property receives tax abatement through the Kearney Street Redevelopment Plan, with reduced real estate taxes described as locked in for 10 years.
Key Highlights
- 5,410 SF building configuration for a single tenant
- Divisible for 2 to 3 tenants with suites down to 1,506 SF
- White‑box delivery provided by landlord for subdivided spaces
Financial Insights
Estimated NOI and Cap Rate
NOI / Yr
$40,262
Cap Rate
4.05%
Suggested Prices Based on Cap Rates
Cap Rate 5%
$805,240
$805.2K
Cap Rate 7%
$575,171
$575.2K
Cap Rate 9%
$447,356
$447.4K
Market Conditions
NOI Build-Up for 5,410 SF
Gross rent
$59.7K $11.04/SF
− Vacancy
−$2.2K −$0.41/SF
EGI
$57.5K $10.63/SF
− OpEx
−$17.3K −$3.19/SF
NOI
$40.3K $7.44/SF
Area
Springfield, MO
Vacancy
3.70%
Lease Rate
$11.04 /SF/Yr
Expense Ratio
30.00%
Simulate Cap Rate and NOI
Suggested Prices Based on Cap Rates
Cap Rate 5%
$805,240
Cap Rate 7%
$575,171
Cap Rate 9%
$447,356
Alternative Uses
Best Use
Retail
$575.2K
$503.3K – $671.0K
NOI $40,262 @ 7.0% cap · market cap 4.05%
Second Best
—
—
no second resolved use
Theoretical Best
Office A
$816.5K
$714.5K – $952.6K
NOI $57,158 @ 7.0% cap · market cap 5.74%
Zoning and permitted uses should be independently verified with authorities.
Property Analytics
Unlock full access to Insights
Subscribe to Realmo Intelligence
Open Analytics
Current Use
Location Intelligence
Trade Area within ½ mile
545
Businesses Nearby
Balanced
Demand for This Use
Explore this area
Business Placement
Demographics for 65803, MO
42,007
Population
19,659
Households
2.1
Avg Household Size
38
Median Age
22%
College-Educated
91%
High-School Grad
93.4 sq mi
ZIP Area
450
Density / Sq Mi
$46,539
Median Household Income
$33,537
Median Earnings
$890
Median Rent
$158,200
Median Home Value
Check the figures for this property
Cap Rate, Value Estimation, Potential NOI and more
View Realmo Analytics
Market
Vacancy Rate% for Retail in Midwest region

Questions? Ask Rey
Realmo’s AI knows this listing — price, zoning, demand, history. Ask anything.







Similar Off Market Nearby
- Fed Ex — 1900 E Florida St, Springfield, MO 65803, United States
- Primrose Marketplace — N Glenstone Ave, Springfield, MO 65803
- Lurvey Plaza — 2367 E Kearney St, Springfield, MO 65803
Frequently Asked Questions
What type of property is this?
Shopping center - Updated commercial center offering flexible suites for single-tenant or multi-tenant occupancy in Northeast Springfield.
Where is this shopping center located?
The property is located at 2003 E Kearney St Springfield, MO.
What is the asking price?
The asking price for this property is $995,000.
What are key features of this property?
This property features: 5,410 SF building configuration for a single tenant; Divisible for 2 to 3 tenants with suites down to 1,506 SF; White‑box delivery provided by landlord for subdivided spaces



