Commercial Development Investment
For Sale
$420,000
2 Harrison St, Sussex, NJ 07461
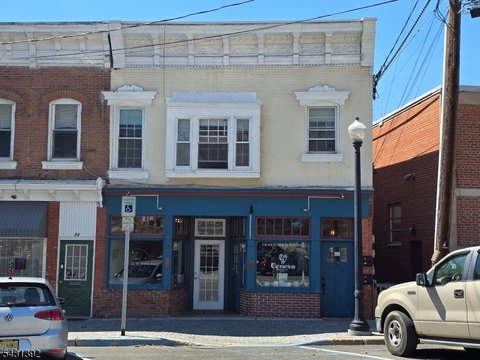
Prime commercial development opportunity in Sussex Borough with mixed-use potential.
Property Size1,488 SF
Price / SF$282.26
Days on Market501
Property Features for 2 Harrison St
General Information
Standard status
Active
Size
1,488 SF
Taxes and HOA fees
Annual Taxes
$5,340
Building Details
Year Built
1920
Listing Agency:
COLDWELL BANKER REALTY
Listed By:
SEAN CLARKIN
Source:
Corcoran
Added: Jun 2, 2025
Changed: Mar 16
Last Checked: May 8 at 5:40AM
Displayed information is deemed reliable but is not guaranteed and should be independently verified. All listing content including descriptions, pricing, images are the copyrighted material of COLDWELL BANKER REALTY

Ask AI about this property
Review the available facts, identify missing information and prepare questions for the agent.
Investment Insights
Based on property information with market context.
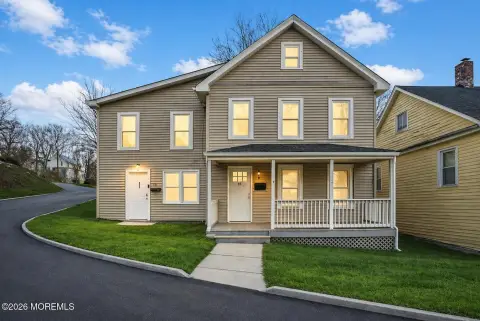
This commercial property in Sussex Borough presents a development opportunity with a combination of residential and commercial rental spaces. The main structure features three or more levels, suitable for apartments, office space, retail units, or a mixed-use concept. A separate two-level garage structure at the rear of the property offers additional development potential or secure storage. On-site parking between the two buildings enhances accessibility. The property is positioned to benefit from ongoing revitalization and expansion in Sussex Borough. The property size is 1488 square feet. The property is priced for a quick cash sale.
Key Highlights
- Prime commercial development investment opportunity in Sussex Borough.
- Opportunity to develop a distinctive combination of residential and commercial rental spaces.
- Main structure features three or more levels, ready for custom design (apartments, office, retail, mixed‑use).
Financial Insights
Estimated NOI and Cap Rate
NOI / Yr
$14,731
Cap Rate
3.51%
Suggested Prices Based on Cap Rates
Cap Rate 5%
$294,620
$294.6K
Cap Rate 7%
$210,443
$210.4K
Cap Rate 9%
$163,678
$163.7K
Market Conditions
NOI Build-Up for 1,488 SF
Gross rent
$26.8K $18.00/SF
− Vacancy
−$3.2K −$2.16/SF
EGI
$23.6K $15.84/SF
− OpEx
−$8.8K −$5.94/SF
NOI
$14.7K $9.90/SF
Area
Sussex County, NJ
Vacancy
12.00%
Lease Rate
$18.00 /SF/Yr
Expense Ratio
37.50%
Simulate Cap Rate and NOI
Suggested Prices Based on Cap Rates
Cap Rate 5%
$294,620
Cap Rate 7%
$210,443
Cap Rate 9%
$163,678
Alternative Uses
Best Use
Mixed Use
$210.4K
$184.1K – $245.5K
NOI $14,731 @ 7.0% cap · market cap 3.51%
Second Best
—
—
no second resolved use
Theoretical Best
Office A
$388.5K
$340.0K – $453.3K
NOI $27,198 @ 7.0% cap · market cap 6.48%
Zoning and permitted uses should be independently verified with authorities.
How Realmo checks its estimates
Property Analytics
Unlock full access to Insights
Subscribe to Realmo Intelligence
Open Analytics
Current Use
Location Intelligence
Trade Area within ½ mile
326
Businesses Nearby
Explore this area
Business Placement
Demographics for 07461, NJ
18,530
Population
7,972
Households
2.3
Avg Household Size
44
Median Age
28%
College-Educated
93%
High-School Grad
83.0 sq mi
ZIP Area
223
Density / Sq Mi
$104,441
Median Household Income
$46,590
Median Earnings
$1,456
Median Rent
$338,500
Median Home Value
Check the figures for this property
Cap Rate, Value Estimation, Potential NOI and more
View Realmo Analytics



Frequently Asked Questions
What type of property is this?
Commercial land - Prime commercial development opportunity in Sussex Borough with mixed-use potential.
Where is this commercial land located?
The property is located at 2 Harrison St Sussex, NJ.
What is the asking price?
The asking price for this property is $420,000.
What are key features of this property?
This property features: Prime commercial development investment opportunity in Sussex Borough.; Opportunity to develop a distinctive combination of residential and commercial rental spaces.; Main structure features three or more levels, ready for custom design (apartments, office, retail, mixed‑use).


