Mixed-Use Building With
For Sale
$2,950,000
19621 Ventura Boulevard, Tarzana, CA 91356
LAC2-zoned property with commercial storefronts and an upstairs residential unit.
Property Size4,944 SF
Price / SF$596.68
Days on Market51
Property Features for 19621 Ventura Boulevard
General Information
Standard status
Active
Size
4,944 SF
Total Parking Spaces
7
Property subtype
Mixed Use
Zoning
LAC2
Site & Location
Frontage
50 ft
Road Access
Yes
Utilities to Site
Yes
Amenities
gated parking
security fencing
camera system
Building Details
Building Size
4,944 SF
Year Built
1963
Buildings
1
Stories
2
Tenancy
Multi
Listing Agency:
Pinnacle Estate Properties
Listed By:
David Proctor · License #01182757
(818) 422-3283
Source:
Truthrealty
Added: Aug 24
Changed: Oct 11
Last Checked: Oct 13 at 2:51AM
Displayed information is deemed reliable but is not guaranteed and should be independently verified. All listing content including descriptions, pricing, images are the copyrighted material of Pinnacle Estate Properties
Investment Insights
Based on property information with market context.
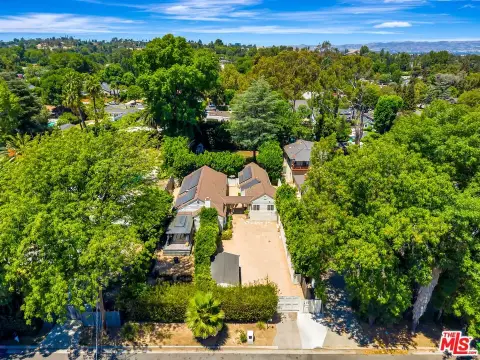
Located at 19621 Ventura Boulevard in Tarzana, this 4,944 SF mixed-use building was constructed in 1963 and combines three ground-floor commercial storefronts with an approximately 1,500 SF residential unit above. The commercial spaces total approximately 3,444 SF, with individual areas of approximately 1,110 SF, 1,167 SF, and 1,167 SF. Two suites connect through an interior doorway, while another includes a large walk-in vault.
The property has approximately 50 feet of direct Ventura Boulevard frontage. A gated rear parking area provides 7 spaces and includes new asphalt and striping, fencing, security fencing, and front, rear, and interior camera coverage. Recent work includes electrical and plumbing upgrades, a new 2-inch copper water main, a new gas line to the upstairs unit, roof coating improvements, HVAC work, LED lighting, emergency lighting, exit signs, bathroom improvements, and various interior and exterior repairs. The LAC2 zoning may accommodate retail, professional office, service, medical/dental, and other commercial uses subject to City approval and applicable requirements.
The property has approximately 50 feet of direct Ventura Boulevard frontage. A gated rear parking area provides 7 spaces and includes new asphalt and striping, fencing, security fencing, and front, rear, and interior camera coverage. Recent work includes electrical and plumbing upgrades, a new 2-inch copper water main, a new gas line to the upstairs unit, roof coating improvements, HVAC work, LED lighting, emergency lighting, exit signs, bathroom improvements, and various interior and exterior repairs. The LAC2 zoning may accommodate retail, professional office, service, medical/dental, and other commercial uses subject to City approval and applicable requirements.
Key Highlights
- 4,944 SF mixed‑use building with 3 ground‑floor commercial storefronts and an approximately 1,500 SF upstairs residential unit
- Commercial spaces total approximately 3,444 SF, with individual areas of approximately 1,110 SF, 1,167 SF, and 1,167 SF
- Approximately 50 feet of direct frontage along Ventura Boulevard in Tarzana
Financial Insights
Estimated NOI and Cap Rate
NOI / Yr
$117,352
Cap Rate
3.98%
Suggested Prices Based on Cap Rates
Cap Rate 5%
$2,347,040
$2.3M
Cap Rate 7%
$1,676,457
$1.7M
Cap Rate 9%
$1,303,911
$1.3M
Market Conditions
NOI Build-Up for 4,944 SF
Gross rent
$192.2K $38.88/SF
− Vacancy
−$35.8K −$7.23/SF
EGI
$156.5K $31.65/SF
− OpEx
−$39.1K −$7.91/SF
NOI
$117.4K $23.74/SF
Area
Los Angeles, CA
Vacancy
18.60%
Lease Rate
$38.88 /SF/Yr
Expense Ratio
25.00%
Simulate Cap Rate and NOI
Suggested Prices Based on Cap Rates
Cap Rate 5%
$2,347,040
Cap Rate 7%
$1,676,457
Cap Rate 9%
$1,303,911
Alternative Uses
Best Use
Office B
$1.68M
$1.47M – $1.96M
NOI $117,352 @ 7.0% cap · market cap 3.98%
Second Best
Retail
$1.64M
$1.43M – $1.91M
NOI $114,736 @ 7.0% cap · market cap 3.89%
Theoretical Best
Multifamily LT 5
$100.16M
$87.64M – $116.86M
NOI $7,011,373 @ 7.0% cap · market cap 237.67%
Zoning and permitted uses should be independently verified with authorities.
How Realmo checks its estimates
Property Analytics
Unlock full access to Insights
Subscribe to Realmo Intelligence
Open Analytics
Current Use
Lease Details
Multi-tenant
Tenancy
Yes
Paved road access
Yes
Utilities to site
Location Intelligence
Trade Area within ½ mile
1,846
Businesses Nearby
Explore this area
Business Placement
Demographics for 91356, CA
30,664
Population
12,715
Households
2.4
Avg Household Size
43
Median Age
56%
College-Educated
94%
High-School Grad
7.3 sq mi
ZIP Area
4,201
Density / Sq Mi
$110,094
Median Household Income
$60,504
Median Earnings
$2,027
Median Rent
$1,177,200
Median Home Value
Check the figures for this property
Cap Rate, Value Estimation, Potential NOI and more
View Realmo Analytics
Market
Vacancy Rate% for Office in West region

Questions? Ask Rey
Realmo’s AI knows this listing — price, zoning, demand, history. Ask anything.





Frequently Asked Questions
What type of property is this?
Mixed-use property - LAC2-zoned property with commercial storefronts and an upstairs residential unit.
Where is this mixed-use property located?
The property is located at 19621 Ventura Boulevard Tarzana, CA.
What is the asking price?
The asking price for this property is $2,950,000.
What are key features of this property?
This property features: 4,944 SF mixed‑use building with 3 ground‑floor commercial storefronts and an approximately 1,500 SF upstairs residential unit; Commercial spaces total approximately 3,444 SF, with individual areas of approximately 1,110 SF, 1,167 SF, and 1,167 SF; Approximately 50 feet of direct frontage along Ventura Boulevard in Tarzana


