Mixed-Use Industrial
For Sale
Contact for pricing
1920 Hancock St, San Diego, CA 92110
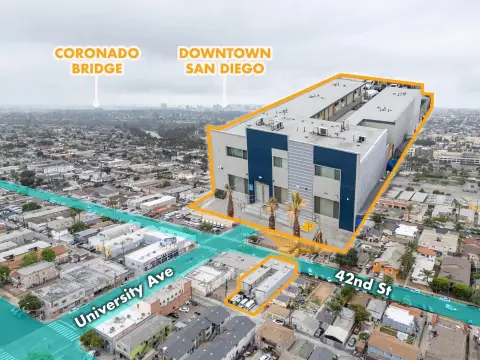
Urban infill property combines warehouse space, residential apartments, offices, and a gated parking yard.
Property Size11,400 SF
Lot Size0.23 Acres
Price / SF$412.28
Days on Market237
Property Features for 1920 Hancock St
General Information
Standard status
Active
Size
11,400 SF
Lot size
0.23 Acres
Property subtype
Industrial, Mixed Use, Multifamily
Zoning
CC-3-8
Lease Type
Gross
Site & Location
Highway Access
Yes
Fenced Yard
Yes
Warehouse & Industrial
Clear Height
15 ft
Warehouse Space
6,000 SF
Sprinkler System
Yes
Additional Details
Asking Price
$4,700,000
Multifamily Units
4
Building Details
Buildings
1
Stories
2
Building Size
11,400 SF
Listing Agency:
CAST CAPITAL PARTNERS
Listed By:
Bret Morriss · License #CA 02037074
(619) 308-6787
Source:
Crexi
Added: Feb 19
Changed: Oct 6
Last Checked: Oct 12 at 8:56PM
Displayed information is deemed reliable but is not guaranteed and should be independently verified. All listing content including descriptions, pricing, images are the copyrighted material of CAST CAPITAL PARTNERS
Investment Insights
Based on property information with market context.
This mixed-use building contains 11,400 square feet on 0.23 acres, with approximately 6,000 square feet dedicated to leasable warehouse and industrial space alongside four residential apartment units. The industrial portion includes four private offices, two restrooms, 15-foot clear height, heating throughout, and a full sprinkler system. A secure gated parking yard supports the property’s operational configuration.
The asset is in San Diego’s urban core, with access and visibility from I-5. San Diego International Airport, Downtown, Little Italy, Old Town, and the Midway/Sports Arena District are all located nearby. CC-3-8 zoning is identified for the property.
The asset is in San Diego’s urban core, with access and visibility from I-5. San Diego International Airport, Downtown, Little Italy, Old Town, and the Midway/Sports Arena District are all located nearby. CC-3-8 zoning is identified for the property.
Key Highlights
- 11,400 SF mixed‑use building on 0.23 acres
- Approximately 6,000 SF of leasable warehouse and industrial space
- Four residential apartment units provide income‑producing space
Financial Insights
Estimated NOI and Cap Rate
NOI / Yr
$220,248
Cap Rate
4.69%
Suggested Prices Based on Cap Rates
Cap Rate 5%
$4,404,960
$4.4M
Cap Rate 7%
$3,146,400
$3.1M
Cap Rate 9%
$2,447,200
$2.4M
Market Conditions
NOI Build-Up for 11,400 SF
Gross rent
$383.0K $33.60/SF
− Vacancy
−$30.6K −$2.69/SF
EGI
$352.4K $30.91/SF
− OpEx
−$132.1K −$11.59/SF
NOI
$220.2K $19.32/SF
Area
San Diego, CA
Vacancy
8.00%
Lease Rate
$33.60 /SF/Yr
Expense Ratio
37.50%
Simulate Cap Rate and NOI
Suggested Prices Based on Cap Rates
Cap Rate 5%
$4,404,960
Cap Rate 7%
$3,146,400
Cap Rate 9%
$2,447,200
Alternative Uses
Best Use
Mixed Use
$3.15M
$2.75M – $3.67M
NOI $220,248 @ 7.0% cap · market cap 4.69%
Second Best
Apartment 5plus
$2.69M
$2.36M – $3.14M
NOI $188,420 @ 7.0% cap · market cap 4.01%
Theoretical Best
Specialty Retail
$4.50M
$3.94M – $5.25M
NOI $315,187 @ 7.0% cap · market cap 6.71%
Zoning and permitted uses should be independently verified with authorities.
How Realmo checks its estimates
Property Analytics
Current Use
Lease Details
15 ft
Clear height
4
Residential units
Yes
Sprinkler system
Yes
Fenced yard
Yes
Highway access
Location Intelligence
Trade Area within ½ mile
1,775
Businesses Nearby
Explore this area
Business Placement
Demographics for 92110, CA
31,048
Population
13,227
Households
2.3
Avg Household Size
34
Median Age
54%
College-Educated
96%
High-School Grad
5.0 sq mi
ZIP Area
6,210
Density / Sq Mi
$102,508
Median Household Income
$52,150
Median Earnings
$2,298
Median Rent
$885,200
Median Home Value
Market
Vacancy Rate% for Industrial in San Diego, CA

Questions? Ask Rey
Realmo’s AI knows this listing — price, zoning, demand, history. Ask anything.




Frequently Asked Questions
What type of property is this?
Mixed-use property - Urban infill property combines warehouse space, residential apartments, offices, and a gated parking yard.
Where is this mixed-use property located?
The property is located at 1920 Hancock St San Diego, CA.
What is the asking price?
The asking price for this property is $4,700,000.
What are key features of this property?
This property features: 11,400 SF mixed‑use building on 0.23 acres; Approximately 6,000 SF of leasable warehouse and industrial space; Four residential apartment units provide income‑producing space


