Remodeled Live-Work
For Sale
Contact for pricing
19094 FM 2854 Rd, Montgomery, TX 77316
Fenced, unrestricted property supports both commercial and residential use.
Property Size1,300 SF
Lot Size0.34 Acres
Price / SF$269.04
Days on Market179
Property Features for 19094 FM 2854 Rd
General Information
Standard status
Active
Size
1,300 SF
Class
B
Total Parking Spaces
2
Lot size
0.34 Acres
Property subtype
Office
Investment Type
Owner/User
Additional Details
Asking Price
$349,750
Road Access
Yes
Amenities
Kitchen
Storage
Wood Burning Fireplace
Building Details
Buildings
1
Listing Agency:
eXp Realty
Listed By:
Bill Smith · License #TX 291078
(281) 723-3336
Source:
Crexi
Added: Apr 20
Changed: Oct 8
Last Checked: Oct 14 at 8:18PM
Displayed information is deemed reliable but is not guaranteed and should be independently verified. All listing content including descriptions, pricing, images are the copyrighted material of eXp Realty
Investment Insights
Based on property information with market context.
This completely remodeled live-work space offers 1,300 square feet on 0.34 acres. The interior includes a den, kitchen, breakfast area, two bedrooms, and one-and-a-half baths, along with a wood-burning fireplace. Exterior improvements include a two-car carport, 19' x 7' storage area, fencing, and frontage along FM 2854 Road.
The property is situated between Montgomery and Conroe and falls within Montgomery ISD. Its unrestricted status allows commercial or residential use, while the source information also identifies the property as suitable for horses.
The property is situated between Montgomery and Conroe and falls within Montgomery ISD. Its unrestricted status allows commercial or residential use, while the source information also identifies the property as suitable for horses.
Key Highlights
- 1,300 SF live‑work space on 0.34 acres
- Completely remodeled interior with den, kitchen, breakfast area, 2 bedrooms, and 1‑1/2 baths
- Two‑car carport plus 19' x 7' storage area
Financial Insights
Estimated NOI and Cap Rate
NOI / Yr
$15,240
Cap Rate
4.36%
Suggested Prices Based on Cap Rates
Cap Rate 5%
$304,800
$304.8K
Cap Rate 7%
$217,714
$217.7K
Cap Rate 9%
$169,333
$169.3K
Market Conditions
NOI Build-Up for 1,300 SF
Gross rent
$26.1K $20.04/SF
− Vacancy
−$5.7K −$4.41/SF
EGI
$20.3K $15.63/SF
− OpEx
−$5.1K −$3.91/SF
NOI
$15.2K $11.72/SF
Area
Montgomery County, TX
Vacancy
22.00%
Lease Rate
$20.04 /SF/Yr
Expense Ratio
25.00%
Simulate Cap Rate and NOI
Suggested Prices Based on Cap Rates
Cap Rate 5%
$304,800
Cap Rate 7%
$217,714
Cap Rate 9%
$169,333
Alternative Uses
Best Use
Office B
$217.7K
$190.5K – $254.0K
NOI $15,240 @ 7.0% cap · market cap 4.36%
Second Best
Mixed Use
$192.2K
$168.2K – $224.3K
NOI $13,455 @ 7.0% cap · market cap 3.85%
Theoretical Best
Specialty Retail
$328.2K
$287.2K – $382.9K
NOI $22,973 @ 7.0% cap · market cap 6.57%
Zoning and permitted uses should be independently verified with authorities.
How Realmo checks its estimates
Property Analytics
Unlock full access to Insights
Subscribe to Realmo Intelligence
Open Analytics
Current Use
Lease Details
Yes
Paved road access
Location Intelligence
Trade Area within ½ mile
16
Businesses Nearby
Explore this area
Business Placement
Demographics for 77316, TX
30,598
Population
11,879
Households
2.6
Avg Household Size
40
Median Age
44%
College-Educated
96%
High-School Grad
129.0 sq mi
ZIP Area
237
Density / Sq Mi
$129,418
Median Household Income
$63,663
Median Earnings
$1,419
Median Rent
$396,500
Median Home Value
Check the figures for this property
Cap Rate, Value Estimation, Potential NOI and more
View Realmo Analytics
Market
Vacancy Rate% for Office in South region

Questions? Ask Rey
Realmo’s AI knows this listing — price, zoning, demand, history. Ask anything.




Frequently Asked Questions
What type of property is this?
Live-work space - Fenced, unrestricted property supports both commercial and residential use.
Where is this live-work space located?
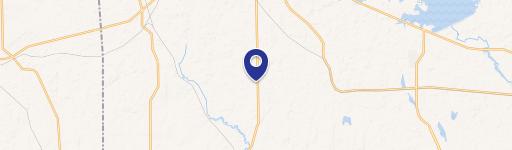
The property is located at 19094 FM 2854 Rd Montgomery, TX.
What is the asking price?
The asking price for this property is $349,750.
What are key features of this property?
This property features: 1,300 SF live‑work space on 0.34 acres; Completely remodeled interior with den, kitchen, breakfast area, 2 bedrooms, and 1‑1/2 baths; Two‑car carport plus 19' x 7' storage area


