Automotive Service Building with
For Sale
$1,200,000
1903 S Delsea Dr, Vineland, NJ 08360
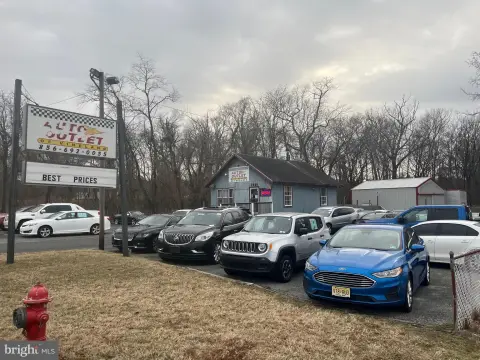
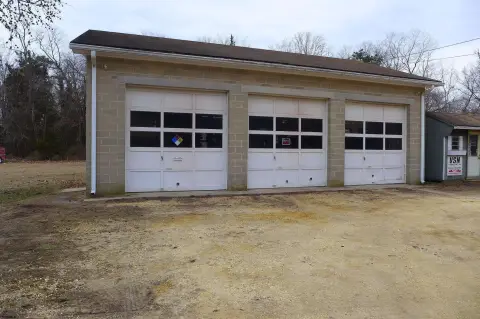
Service building includes 10 service bays and a lift, with 120 feet of frontage on Delsea Drive.
Property Size5,000 SF
Price / SF$240
Days on Market96
Property Features for 1903 S Delsea Dr
General Information
Standard status
Active
Size
5,000 SF
Zoning
UEZ
Additional Details
Road Access
Yes
Service Bays
10
Building Details
Year Built
1979
Listing Agency:
Axis Realty Associates
Listed By:
Kelly Pladeck
(856) 297-2583
Source:
Premierehomegroup
Added: Jul 23
Changed: Oct 25
Last Checked: Oct 7 at 4:25PM
Displayed information is deemed reliable but is not guaranteed and should be independently verified. All listing content including descriptions, pricing, images are the copyrighted material of Axis Realty Associates

Ask AI about this property
Review the available facts, identify missing information and prepare questions for the agent.
Investment Insights
Based on property information with market context.
This automotive property includes a service building with 10 service bays and a lift, plus three detached buildings. The current site has been licensed for auto sales since 2001.
The property features approximately 120 feet of frontage on Delsea Drive, with high visibility and a traffic light at the nearby intersection. Public remarks also note the location within an UEZ Zone and that major retail and service destinations are within a short drive, including Cumberland Mall and County College.
The owner will consider financing. The business is not for sale, and the listing is for the real estate.
The property features approximately 120 feet of frontage on Delsea Drive, with high visibility and a traffic light at the nearby intersection. Public remarks also note the location within an UEZ Zone and that major retail and service destinations are within a short drive, including Cumberland Mall and County College.
The owner will consider financing. The business is not for sale, and the listing is for the real estate.
Key Highlights
- Service building built in 1979 with 10 service bays and a lift
- 120 ft of frontage on Delsea Drive
- Currently licensed for auto sales since 2001 (business not for sale)
Financial Insights
Estimated NOI and Cap Rate
NOI / Yr
$60,354
Cap Rate
5.03%
Suggested Prices Based on Cap Rates
Cap Rate 5%
$1,207,080
$1.2M
Cap Rate 7%
$862,200
$862.2K
Cap Rate 9%
$670,600
$670.6K
Market Conditions
NOI Build-Up for 5,000 SF
Gross rent
$90.0K $18.00/SF
− Vacancy
−$3.8K −$0.76/SF
EGI
$86.2K $17.24/SF
− OpEx
−$25.9K −$5.17/SF
NOI
$60.4K $12.07/SF
Area
Cumberland County, NJ
Vacancy
4.20%
Lease Rate
$18.00 /SF/Yr
Expense Ratio
30.00%
Simulate Cap Rate and NOI
Suggested Prices Based on Cap Rates
Cap Rate 5%
$1,207,080
Cap Rate 7%
$862,200
Cap Rate 9%
$670,600
Alternative Uses
Best Use
Retail
$862.2K
$754.4K – $1.01M
NOI $60,354 @ 7.0% cap · market cap 5.03%
Second Best
Industrial
$417.6K
$365.4K – $487.2K
NOI $29,232 @ 7.0% cap · market cap 2.44%
Theoretical Best
Office A
$7.51M
$6.57M – $8.76M
NOI $525,528 @ 7.0% cap · market cap 43.79%
Zoning and permitted uses should be independently verified with authorities.
How Realmo checks its estimates
Property Analytics
Unlock full access to Insights
Subscribe to Realmo Intelligence
Open Analytics
Current Use
Lease Details
10
Service bays
Yes
Paved road access
Location Intelligence
Trade Area within ½ mile
146
Businesses Nearby
3k
Monthly Visits Nearby
Well-served
Demand for This Use
Explore this area
Business Placement
Foot Traffic Nearby
Shops & Services 100%
U-Haul Moving & Storage Of South Vineland
Shops & Services
1,492 visits/mo
0.4 miles
OneMain Financial
Shops & Services
1,025 visits/mo
0.1 miles
Demographics for 08360, NJ
43,043
Population
16,797
Households
2.6
Avg Household Size
38
Median Age
17%
College-Educated
79%
High-School Grad
44.3 sq mi
ZIP Area
972
Density / Sq Mi
$62,604
Median Household Income
$37,236
Median Earnings
$1,164
Median Rent
$199,600
Median Home Value
Check the figures for this property
Cap Rate, Value Estimation, Potential NOI and more
View Realmo Analytics
Market
Vacancy Rate% for Retail in Northeast region




Similar Off Market Nearby
- South Jersey Motor Trends — 2059 S Delsea Dr, Vineland, NJ 08360
- Custom Trends — 2059 S Delsea Dr suite b, Vineland, NJ 08360
- Accurate Collision Center — 351 W Elmer Rd, Vineland, NJ 08360
- Fred Bianco Auto Body, The Automotive Collision Repair Experts — 1791 S Delsea Dr, Vineland, NJ 08360
- Scott Honda of Vineland Service Center — 1517 S Delsea Dr, Vineland, NJ 08360
Frequently Asked Questions
What type of property is this?
Auto shop - Service building includes 10 service bays and a lift, with 120 feet of frontage on Delsea Drive.
Where is this auto shop located?
The property is located at 1903 S Delsea Dr Vineland, NJ.
What is the asking price?
The asking price for this property is $1,200,000.
What are key features of this property?
This property features: Service building built in 1979 with 10 service bays and a lift; 120 ft of frontage on Delsea Drive; Currently licensed for auto sales since 2001 (business not for sale)