Warehouse with Two Grade-Level
For Sale
$1,500,000
Pending
1900 W Elm St, Ozark, MO 65721
Turnkey warehouse-mall with open layout, central heat/AC, and two grade-level overhead doors on a major highway intersection.
Property Size25,600 SF
Days on Market130
Property Features for 1900 W Elm St
General Information
Standard status
Pending
Size
25,600 SF
Property subtype
Commercial
Occupancy
100%
Site & Location
Highway Access
Yes
Road Access
Yes
Additional Details
Business Included
Yes
Drive-In Doors
2
Building Details
Year Built
1989
Stories
2
Listing Agency:
AMAX Real Estate
Listed By:
Jennifer Jackson · License #2025028715
(417) 861-2279
Source:
Trilakeshomesearch
Added: Jun 17
Changed: Oct 7
Last Checked: Oct 24 at 5:16PM
Displayed information is deemed reliable but is not guaranteed and should be independently verified. All listing content including descriptions, pricing, images are the copyrighted material of AMAX Real Estate

Ask AI about this property
Review the available facts, identify missing information and prepare questions for the agent.
Investment Insights
Based on property information with market context.
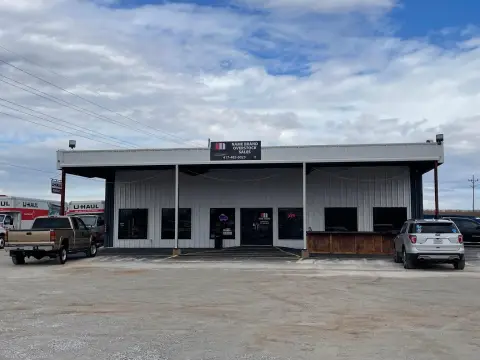
This approximately 25,600 SF warehouse is currently operating as a turnkey antique mall. The building includes high ceilings and an open floor plan with temporarily constructed booth spaces, plus a front desk/cashier area. There are two grade-level overhead doors and multiple ceiling fans for air flow. Interior amenities include central heat and A/C, a restroom with two stalls, and a lofted second floor.
The property is located at the high-visibility intersection of U.S. Highway 65 and Missouri Route 14 in Ozark, Missouri, positioned between Springfield and Branson. A rooftop billboard is included, and the current operation benefits from the existing, recognizable setup as an antique marketplace.
For an investor or operator seeking a ready-to-run retail concept, the property is being offered with systems in place for point-of-sale by vendor and evidence of active demand, including 100% booth occupancy and an existing waiting list of renters. For alternate retail or warehousing use, the combination of high ceilings, flexible open layout, and grade-level access can support a variety of configuration strategies, while the included billboard offers ongoing external visibility.
The property is located at the high-visibility intersection of U.S. Highway 65 and Missouri Route 14 in Ozark, Missouri, positioned between Springfield and Branson. A rooftop billboard is included, and the current operation benefits from the existing, recognizable setup as an antique marketplace.
For an investor or operator seeking a ready-to-run retail concept, the property is being offered with systems in place for point-of-sale by vendor and evidence of active demand, including 100% booth occupancy and an existing waiting list of renters. For alternate retail or warehousing use, the combination of high ceilings, flexible open layout, and grade-level access can support a variety of configuration strategies, while the included billboard offers ongoing external visibility.
Key Highlights
- ~25,600 SF warehouse‑mall building operating as an antique mall for more than a decade
- Turnkey setup with 100% booth occupancy and an existing waiting list of renters
- Open layout with temporarily constructed booth spaces, front desk/cashier area, and restroom with 2 stalls plus lofted 2nd floor
Financial Insights
Estimated NOI and Cap Rate
NOI / Yr
$99,698
Cap Rate
6.65%
Suggested Prices Based on Cap Rates
Cap Rate 5%
$1,993,960
$2.0M
Cap Rate 7%
$1,424,257
$1.4M
Cap Rate 9%
$1,107,756
$1.1M
Market Conditions
NOI Build-Up for 25,600 SF
Gross rent
$119.8K $4.68/SF
− Vacancy
−$2.5K −$0.10/SF
EGI
$117.3K $4.58/SF
− OpEx
−$17.6K −$0.69/SF
NOI
$99.7K $3.89/SF
Area
Christian County, MO
Vacancy
2.10%
Lease Rate
$4.68 /SF/Yr
Expense Ratio
15.00%
Simulate Cap Rate and NOI
Suggested Prices Based on Cap Rates
Cap Rate 5%
$1,993,960
Cap Rate 7%
$1,424,257
Cap Rate 9%
$1,107,756
Alternative Uses
Best Use
Retail
$2.72M
$2.38M – $3.18M
NOI $190,517 @ 7.0% cap · market cap 12.70%
Second Best
Warehouse
$1.42M
$1.25M – $1.66M
NOI $99,698 @ 7.0% cap · market cap 6.65%
Theoretical Best
Office A
$3.86M
$3.38M – $4.51M
NOI $270,471 @ 7.0% cap · market cap 18.03%
Zoning and permitted uses should be independently verified with authorities.
How Realmo checks its estimates
Property Analytics
Contact the owner directly
Get the owner's phone numbers and email
Open Analytics
Current Use
Lease Details
2
Drive-in doors
100%
Occupancy
Turnkey business
Opportunity
Yes
Highway access
Yes
Paved road access
Location Intelligence
Trade Area within ½ mile
340
Businesses Nearby
Balanced
Demand for This Use
Explore this area
Business Placement
Demographics for 65721, MO
32,975
Population
13,467
Households
2.4
Avg Household Size
36
Median Age
35%
College-Educated
93%
High-School Grad
95.9 sq mi
ZIP Area
344
Density / Sq Mi
$76,552
Median Household Income
$41,653
Median Earnings
$991
Median Rent
$253,700
Median Home Value
Check the figures for this property
Cap Rate, Value Estimation, Potential NOI and more
View Realmo Analytics
Market
Vacancy Rate% for Industrial in Midwest region







Similar Off Market Nearby
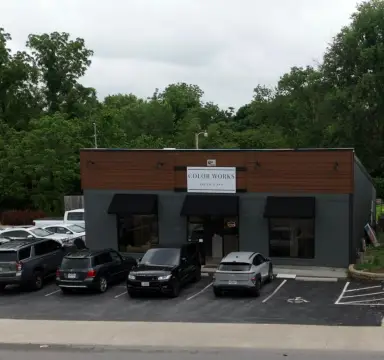
- Kansas Expwy Self Storage — 1031 S Wabash Ave, Springfield, MO 65802
- Park Avenue Self Storage — 840 S Park Ave, Springfield, MO 65802
- Store-More Self Storage — 2201 W College St, Springfield, MO 65806
- College Street Mobile Mini Park-Storage — 1909 W College St, Springfield, MO 65806
Frequently Asked Questions
What type of property is this?
Warehouse - Turnkey warehouse-mall with open layout, central heat/AC, and two grade-level overhead doors on a major highway intersection.
Where is this warehouse located?
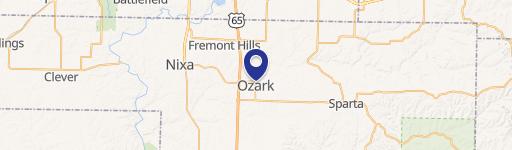
The property is located at 1900 W Elm St Ozark, MO.
What is the asking price?
The asking price for this property is $1,500,000.
What are key features of this property?
This property features: ~25,600 SF warehouse‑mall building operating as an antique mall for more than a decade; Turnkey setup with 100% booth occupancy and an existing waiting list of renters; Open layout with temporarily constructed booth spaces, front desk/cashier area, and restroom with 2 stalls plus lofted 2nd floor


