Corner Retail Property with
For Sale
$1,388,888
190 14th Street, Oakland, CA 94612
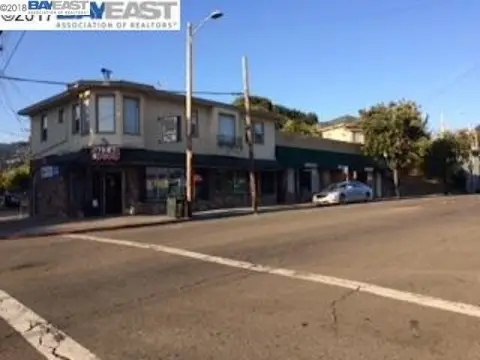
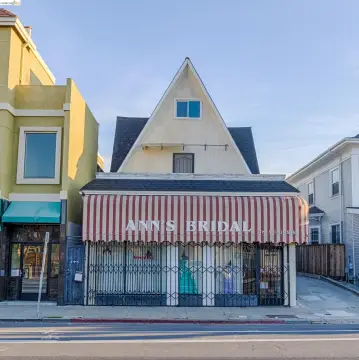
Vacant corner retail property with private drive-through parking, offering flexible use options for owner-users or redevelopment.
Property Size2,772 SF
Lot Size0.15 Acres
Price / SF$501.04
Days on Market107
Property Features for 190 14th Street
General Information
Standard status
Active
Size
2,772 SF
Lot size
0.15 Acres
Property subtype
Retail
Zoning
D-LM-12
Additional Details
Highway Access
Yes
Building Details
Building Size
2,772 SF
Year Built
1964
Listing Agency:
eXp Realty of Northern California, Inc
Listed By:
Lynnette Stroeger
(650) 440-0099
Source:
Annnewtoncane
Added: Jun 23
Changed: Sep 29
Last Checked: Oct 5 at 9:09PM
Displayed information is deemed reliable but is not guaranteed and should be independently verified. All listing content including descriptions, pricing, images are the copyrighted material of eXp Realty of Northern California, Inc
Investment Insights
Based on property information with market context.
190 14th Street is a highly visible corner retail property delivered vacant and configured with a 2,772 SF building on a 6,750 SF lot. The site includes private drive-through parking, which supports access for customers and deliveries and can simplify on-site circulation for a range of commercial concepts. The property sits within the D-LM-2 zoning district.
Located in Oakland’s Lake Merritt area, the property benefits from proximity to Lake Merritt, Laney College, the Oakland Museum of California, and two BART stations. The setting is described as a dense urban corridor with surrounding residential towers, local retail, and cultural institutions. Access is noted to I-880 and Hwy 24.
For tenants or owner-users, the ground-floor retail configuration can support active retail use on site, while the D-LM-2 zoning district is described as allowing office or residential uses on upper levels. With the property available vacant, it may also suit operators looking for control of the build-out and branding from day one, or parties evaluating a redevelopment strategy in a transit-oriented mixed-use area.
Located in Oakland’s Lake Merritt area, the property benefits from proximity to Lake Merritt, Laney College, the Oakland Museum of California, and two BART stations. The setting is described as a dense urban corridor with surrounding residential towers, local retail, and cultural institutions. Access is noted to I-880 and Hwy 24.
For tenants or owner-users, the ground-floor retail configuration can support active retail use on site, while the D-LM-2 zoning district is described as allowing office or residential uses on upper levels. With the property available vacant, it may also suit operators looking for control of the build-out and branding from day one, or parties evaluating a redevelopment strategy in a transit-oriented mixed-use area.
Key Highlights
- Vacant corner retail property at 190 14th Street with private drive‑through parking
- Built in 1964 with 2,772 SF building on a 6,750 SF lot
- Zoned D‑LM‑2, supporting active ground‑floor retail plus office or residential uses on upper levels
Financial Insights
Estimated NOI and Cap Rate
NOI / Yr
$53,747
Cap Rate
3.87%
Suggested Prices Based on Cap Rates
Cap Rate 5%
$1,074,940
$1.1M
Cap Rate 7%
$767,814
$767.8K
Cap Rate 9%
$597,189
$597.2K
Market Conditions
NOI Build-Up for 2,772 SF
Gross rent
$81.2K $29.28/SF
− Vacancy
−$4.4K −$1.58/SF
EGI
$76.8K $27.70/SF
− OpEx
−$23.0K −$8.31/SF
NOI
$53.7K $19.39/SF
Area
Oakland, CA
Vacancy
5.40%
Lease Rate
$29.28 /SF/Yr
Expense Ratio
30.00%
Simulate Cap Rate and NOI
Suggested Prices Based on Cap Rates
Cap Rate 5%
$1,074,940
Cap Rate 7%
$767,814
Cap Rate 9%
$597,189
Alternative Uses
Best Use
Retail
$767.8K
$671.8K – $895.8K
NOI $53,747 @ 7.0% cap · market cap 3.87%
Second Best
—
—
no second resolved use
Theoretical Best
Multifamily LT 5
$907.5K
$794.1K – $1.06M
NOI $63,528 @ 7.0% cap · market cap 4.57%
Zoning and permitted uses should be independently verified with authorities.
Property Analytics
Unlock full access to Insights
Subscribe to Realmo Intelligence
Open Analytics
Current Use
Lease Details
Yes
Highway access
Location Intelligence
Trade Area within ½ mile
8,955
Businesses Nearby
34k
Monthly Visits Nearby
Balanced
Demand for This Use
Explore this area
Business Placement
Foot Traffic Nearby
Dining 48%
Shops & Services 39%
Hotels & Casinos 14%
McDonald's
Dining
13,504 visits/mo
0.1 miles
Shell
Shops & Services
11,553 visits/mo
0.4 miles
Americas Best Value Inn
Hotels & Casinos
3,864 visits/mo
0.5 miles
Mountain Mike's Pizza
Dining
2,457 visits/mo
0.4 miles
Caliber Collision
Shops & Services
1,458 visits/mo
0.1 miles
Demographics for 94612, CA
19,773
Population
11,928
Households
1.7
Avg Household Size
38
Median Age
54%
College-Educated
87%
High-School Grad
1.0 sq mi
ZIP Area
19,773
Density / Sq Mi
$77,069
Median Household Income
$70,221
Median Earnings
$1,936
Median Rent
$814,000
Median Home Value
Check the figures for this property
Cap Rate, Value Estimation, Potential NOI and more
View Realmo Analytics
Market
Vacancy Rate% for Retail in West region

Questions? Ask Rey
Realmo’s AI knows this listing — price, zoning, demand, history. Ask anything.





Similar Off Market Nearby
- Nathalie Beauty Flower — 827 International Blvd, Oakland, CA 94606
- Elaine's Flowers — 295 9th St, Oakland, CA 94607
- From the Heart Florist — 1016 Webster St, Oakland, CA 94607
- Oakland Florist — 1101 Webster St, Oakland, CA 94607
- SLAK Flowers — 388 9th St, Oakland, CA 94607
Frequently Asked Questions
What type of property is this?
Storefront property - Vacant corner retail property with private drive-through parking, offering flexible use options for owner-users or redevelopment.
Where is this storefront property located?
The property is located at 190 14th Street Oakland, CA.
What is the asking price?
The asking price for this property is $1,388,888.
What are key features of this property?
This property features: Vacant corner retail property at 190 14th Street with private drive‑through parking; Built in 1964 with 2,772 SF building on a 6,750 SF lot; Zoned D‑LM‑2, supporting active ground‑floor retail plus office or residential uses on upper levels