Two-Family Residential Income
For Sale
$1,250,000
19 Codman Hill Ave, Boston, MA 02124
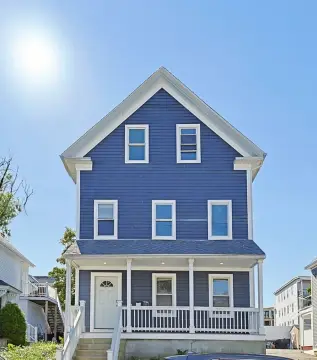
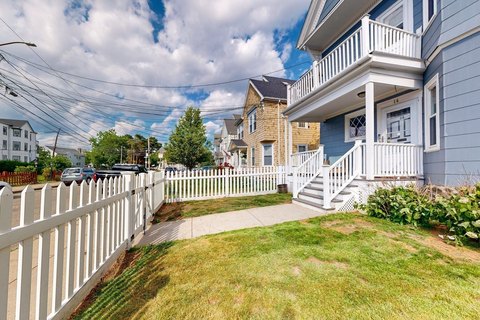
Well-maintained two-family home with 7 bedrooms, finished basement and attic, and parking for 3+ vehicles.
Property Size2,412 SF
Price / SF$518.24
Days on Market100
Property Features for 19 Codman Hill Ave
General Information
Standard status
Active
Size
2,412 SF
Total Parking Spaces
4
Property subtype
Multi-Family
Zoning
R2
Net Operating Income
$76,800
Additional Details
Multifamily Units
2
Taxes and HOA fees
Annual Taxes
$9,391
Amenities
finished basement
finished attic
private yard
mini splits A/C
solar panels
Building Details
Building Size
2,412 SF
Year Built
1935
Stories
4
Listing Agency:
Cameron Real Estate Group
(781) 486-3180
Listed By:
Liliana Delgado
(781) 267-2999
Source:
Churchillprop
Added: Jul 15
Changed: Oct 6
Last Checked: Oct 20 at 6:53PM
Displayed information is deemed reliable but is not guaranteed and should be independently verified. All listing content including descriptions, pricing, images are the copyrighted material of Cameron Real Estate Group

Ask AI about this property
Review the available facts, identify missing information and prepare questions for the agent.
Investment Insights
Based on property information with market context.
Well-maintained two-family residential income property offering 7 bedrooms and 4 bathrooms, with a finished basement and finished attic. The home includes a large private yard and parking for 3+ vehicles. Both units are certified de-leaded. Updates include mini-split A/C units, a new Navien gas/hot water heating system, and electric solar panels.
Located in the Codman Hill/Codman Square area of Dorchester, the property provides access to public transportation and is positioned near Ashmont, Adams Village, and Lower Mills. It is also close to Franklin Park and neighborhood green spaces, with shopping, restaurants, schools, parks, and everyday amenities within reach, along with easy access to major roadways.
The current configuration supports a flexible setup for an owner-occupant or an investor, with finished interior space across multiple levels and an on-site yard for outdoor use.
Located in the Codman Hill/Codman Square area of Dorchester, the property provides access to public transportation and is positioned near Ashmont, Adams Village, and Lower Mills. It is also close to Franklin Park and neighborhood green spaces, with shopping, restaurants, schools, parks, and everyday amenities within reach, along with easy access to major roadways.
The current configuration supports a flexible setup for an owner-occupant or an investor, with finished interior space across multiple levels and an on-site yard for outdoor use.
Key Highlights
- Well‑maintained two‑family home built in 1935 with 7 bedrooms and 4 bathrooms.
- Finished basement and finished attic provide extra living space.
- Certified de‑leaded for both units.
Financial Insights
Estimated NOI and Cap Rate
NOI / Yr
$60,950
Cap Rate
4.88%
Suggested Prices Based on Cap Rates
Cap Rate 5%
$1,219,000
$1.2M
Cap Rate 7%
$870,714
$870.7K
Cap Rate 9%
$677,222
$677.2K
Market Conditions
NOI Build-Up for 2,412 SF
Gross rent
$91.2K $37.80/SF
− Vacancy
−$4.1K −$1.70/SF
EGI
$87.1K $36.10/SF
− OpEx
−$26.1K −$10.83/SF
NOI
$60.9K $25.27/SF
Area
Boston, MA
Vacancy
4.50%
Lease Rate
$37.80 /SF/Yr
Expense Ratio
30.00%
Simulate Cap Rate and NOI
Suggested Prices Based on Cap Rates
Cap Rate 5%
$1,219,000
Cap Rate 7%
$870,714
Cap Rate 9%
$677,222
Alternative Uses
Best Use
Multifamily LT 5
$870.7K
$761.9K – $1.02M
NOI $60,950 @ 7.0% cap · market cap 4.88%
Second Best
Apartment 5plus
$809.5K
$708.3K – $944.4K
NOI $56,663 @ 7.0% cap · market cap 4.53%
Theoretical Best
Office A
$1.81M
$1.58M – $2.11M
NOI $126,427 @ 7.0% cap · market cap 10.11%
Zoning and permitted uses should be independently verified with authorities.
How Realmo checks its estimates
Property Analytics
Who owns this building?
See the owner, sales and loan history
Open Analytics
Lease Details
2
Residential units
Location Intelligence
Trade Area within ½ mile
1,440
Businesses Nearby
Explore this area
Business Placement
Demographics for 02124, MA
50,972
Population
21,264
Households
2.4
Avg Household Size
36
Median Age
31%
College-Educated
85%
High-School Grad
3.0 sq mi
ZIP Area
16,991
Density / Sq Mi
$79,168
Median Household Income
$43,483
Median Earnings
$1,783
Median Rent
$607,200
Median Home Value
Check the figures for this property
Cap Rate, Value Estimation, Potential NOI and more
View Realmo Analytics
Market
Vacancy Rate% for Multifamily in Northeast region






Frequently Asked Questions
What type of property is this?
Duplex - Well-maintained two-family home with 7 bedrooms, finished basement and attic, and parking for 3+ vehicles.
Where is this duplex located?
The property is located at 19 Codman Hill Ave Boston, MA.
What is the asking price?
The asking price for this property is $1,250,000.
What are key features of this property?
This property features: Well‑maintained two‑family home built in 1935 with 7 bedrooms and 4 bathrooms.; Finished basement and finished attic provide extra living space.; Certified de‑leaded for both units.


