Modern Office Building with
For Sale
Contact for pricing
Pending
1899 S Clyde Morris Blvd, Daytona Beach, FL 32119
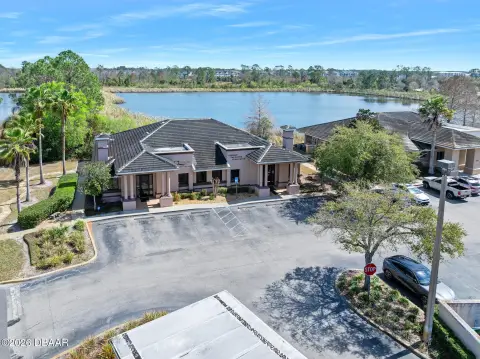
Modern office building with over a dozen private offices, reception, meeting area, and 50+ parking spaces.
Property Size10,770 SF
Days on Market263
Property Features for 1899 S Clyde Morris Blvd
General Information
Standard status
Pending
Size
10,770 SF
Property subtype
Office
Zoning
BP
Building Details
Year Built
1994
Year Renovated
2002
Buildings
1
Stories
1
Units
1
Construction
concrete block
Listing Agency:
SVN | Alliance Commercial Real Estate Advisors Ormond Beach
Listed By:
Michael Baxter · License #SL3451680
(386) 999-1762
Source:
Crexi
Added: Feb 3
Changed: Oct 24
Last Checked: Oct 23 at 6:05AM
Displayed information is deemed reliable but is not guaranteed and should be independently verified. All listing content including descriptions, pricing, images are the copyrighted material of SVN | Alliance Commercial Real Estate Advisors Ormond Beach

Ask AI about this property
Review the available facts, identify missing information and prepare questions for the agent.
Investment Insights
Based on property information with market context.
This modern professional office building features concrete block construction and a layout that includes more than a dozen private offices, an open meeting area, reception, and several work spaces. The owner is vacating the building, and the property was renovated in 2022 with a new roof, followed by additional mechanical upgrades including a new heat pump in 2023 and new A/C in 2025.
The building sits on a lit corner and includes 50+ parking spaces, with a former drive-thru on site. Two large monument signs are also present.
With its enclosed office configuration and dedicated reception and meeting space, the building is positioned for professional services use, including attorney, insurance, or medical users as described in the remarks.
The building sits on a lit corner and includes 50+ parking spaces, with a former drive-thru on site. Two large monument signs are also present.
With its enclosed office configuration and dedicated reception and meeting space, the building is positioned for professional services use, including attorney, insurance, or medical users as described in the remarks.
Key Highlights
- 1994‑built modern professional office building with concrete block construction
- More than a dozen private offices plus reception and an open meeting area
- Lit corner location with 50+ parking spaces and former drive‑thru
Financial Insights
Estimated NOI and Cap Rate
NOI / Yr
$161,388
Cap Rate
6.46%
Suggested Prices Based on Cap Rates
Cap Rate 5%
$3,227,760
$3.2M
Cap Rate 7%
$2,305,543
$2.3M
Cap Rate 9%
$1,793,200
$1.8M
Market Conditions
NOI Build-Up for 10,770 SF
Gross rent
$232.6K $21.60/SF
− Vacancy
−$17.4K −$1.62/SF
EGI
$215.2K $19.98/SF
− OpEx
−$53.8K −$5.00/SF
NOI
$161.4K $14.99/SF
Area
Volusia County, FL
Vacancy
7.50%
Lease Rate
$21.60 /SF/Yr
Expense Ratio
25.00%
Simulate Cap Rate and NOI
Suggested Prices Based on Cap Rates
Cap Rate 5%
$3,227,760
Cap Rate 7%
$2,305,543
Cap Rate 9%
$1,793,200
Alternative Uses
Best Use
Office B
$2.31M
$2.02M – $2.69M
NOI $161,388 @ 7.0% cap · market cap 6.46%
Second Best
—
—
no second resolved use
Theoretical Best
Office A
$3.18M
$2.78M – $3.70M
NOI $222,293 @ 7.0% cap · market cap 8.89%
Zoning and permitted uses should be independently verified with authorities.
How Realmo checks its estimates
Property Analytics
Contact the owner directly
Get the owner's phone numbers and email
Open Analytics
Current Use
Location Intelligence
Trade Area within ½ mile
245
Businesses Nearby
Explore this area
Business Placement
Demographics for 32119, FL
22,498
Population
12,629
Households
1.8
Avg Household Size
50
Median Age
27%
College-Educated
91%
High-School Grad
7.8 sq mi
ZIP Area
2,884
Density / Sq Mi
$53,795
Median Household Income
$37,675
Median Earnings
$1,371
Median Rent
$215,200
Median Home Value
Check the figures for this property
Cap Rate, Value Estimation, Potential NOI and more
View Realmo Analytics
Market
Vacancy Rate% for Office in South region




Frequently Asked Questions
What type of property is this?
Office building - Modern office building with over a dozen private offices, reception, meeting area, and 50+ parking spaces.
Where is this office building located?
The property is located at 1899 S Clyde Morris Blvd Daytona Beach, FL.
What is the asking price?
The asking price for this property is $2,500,000.
What are key features of this property?
This property features: 1994‑built modern professional office building with concrete block construction; More than a dozen private offices plus reception and an open meeting area; Lit corner location with 50+ parking spaces and former drive‑thru


