Duplex With Detached
For Sale
$370,000
18758 NW 243RD Terrace, High Springs, FL 32643
Residential Income, HIGH SPRINGS, FL
Property Size1,442 SF
Lot Size0.24 Acres
Price / SF$256.59
Days on Market50
Property Features for 18758 NW 243RD Terrace
General Information
Property type
Residential Multi Family
Property subtype
Duplex
Zoning
R2
Bedrooms
4
Bathrooms
3
Full bathrooms
3
Rooms
Bedroom 2, Bathroom 2, Bedroom 3, Bedroom 4, Bedroom 1, Bathroom 1, Bathroom 3
Parking features
Off Street, Underground/Basement
Patio and Porch features
Porch
Interior features
Primary Bedroom Main Floor, Thermostat
Appliances
Dishwasher, Dryer, Electric Water Heater, Range, Refrigerator, Washer
Subdivision
HOLLAND & GVILLES REP
Lot features
Corner Lot, City Limits, Paved
Elementary school
Alachua Elementary School-AL
Middle school
High Springs Community School-AL
High school
Santa Fe High School-AL
Directions
From US Hwy 27 go north on NW 243rd Terrace to home on left.
Standard status
Active
APN
01026-000-000
Size
1,442 SF
Lot size
0.24 Acres
Taxes and HOA fees
Tax Year
2025
Tax Description
PATTON ADDN PB A-52 HOLLAND & EVILLE REPLAT OF BK 16 PATTON ADDN & OF BK 109 G E FOSTER ADDN PB A-125 LOT 4 OR 5049/0152 & OR 5085/2045
Tax Annual Amount
4009
Legal Description
PATTON ADDN PB A-52 HOLLAND & EVILLE REPLAT OF BK 16 PATTON ADDN & OF BK 109 G E FOSTER ADDN PB A-125 LOT 4 OR 5049/0152 & OR 5085/2045
Utilities
Utilities
Cable Available
Sewer type
Public Sewer
Heating system
Electric (Heating)
Cooling system
Wall/Window Unit(s), Window Unit(s), Central Air
Water source
Public
Amenities
wraparound porch
Building Details
Year built
1935
Floors in Building
2
Flooring type
Wood, Tile - Ceramic
Building materials
Frame, Wood Siding
Roof type
Metal
Listing Agency:
LPT REALTY, LLC
(877) 366-2213
Listed By:
Jim Knetsch · License #3015997
(813) 629-0341
Added: Aug 23
Changed: Oct 1
Last Checked: Oct 11 at 8:06PM
MLS# TB8541805
Copyright © 2026 Stellar MLS. All rights reserved. All information provided by the listing agent/broker is deemed reliable but is not guaranteed and should be independently verified.
Investment Insights
Based on property information with market context.
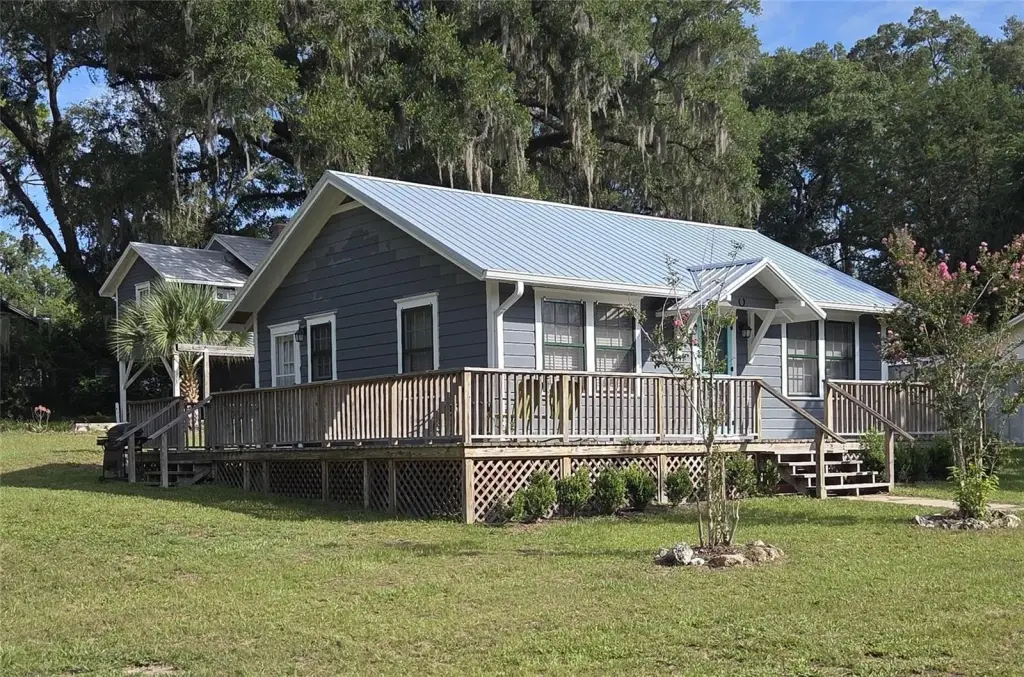
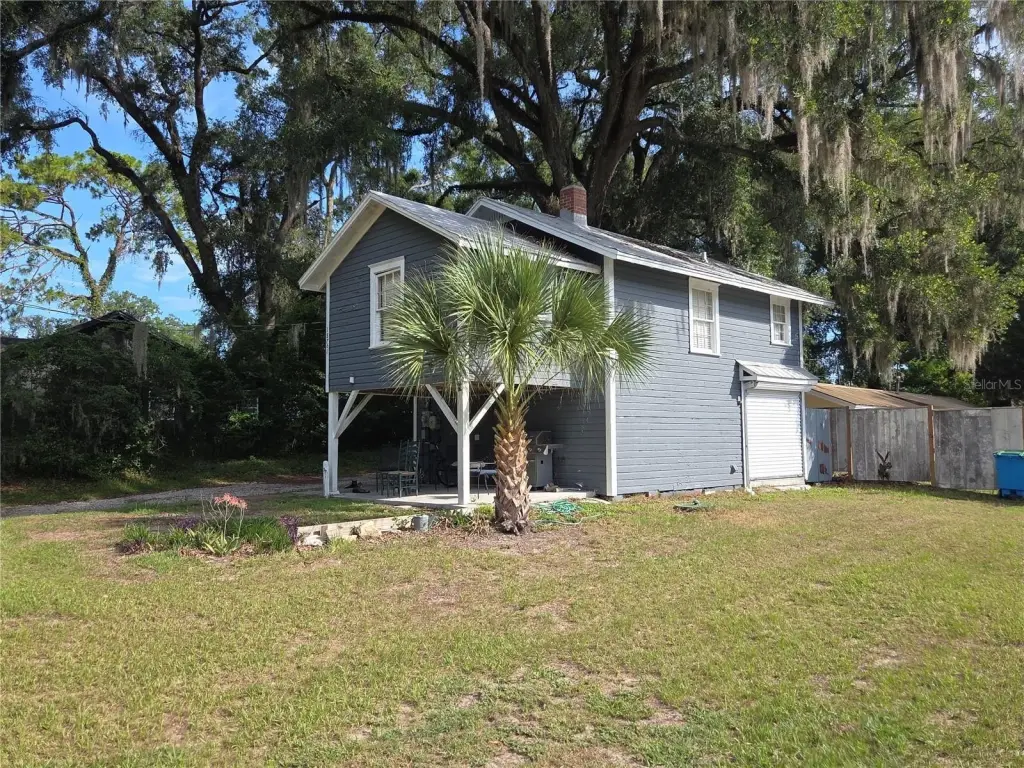
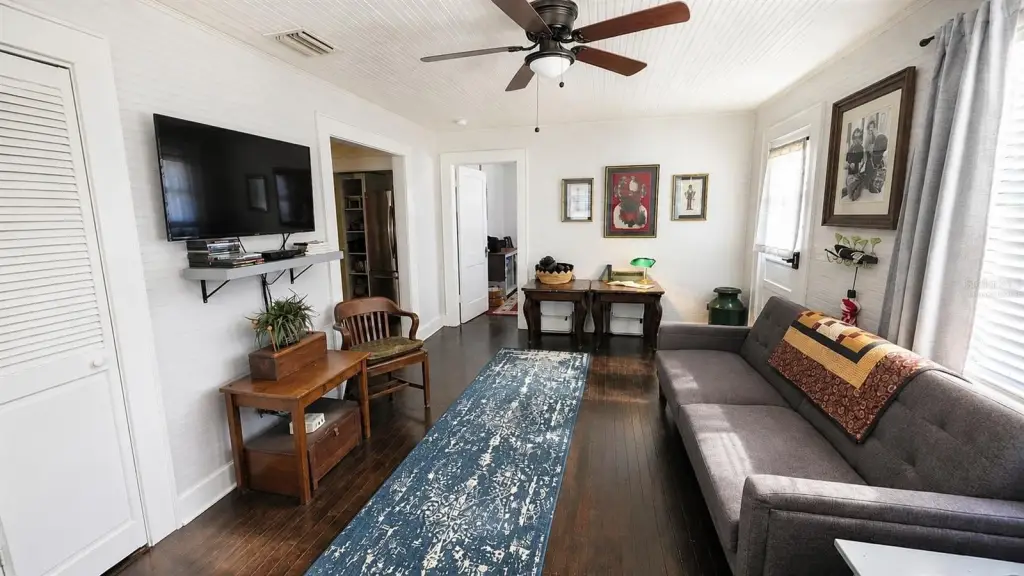
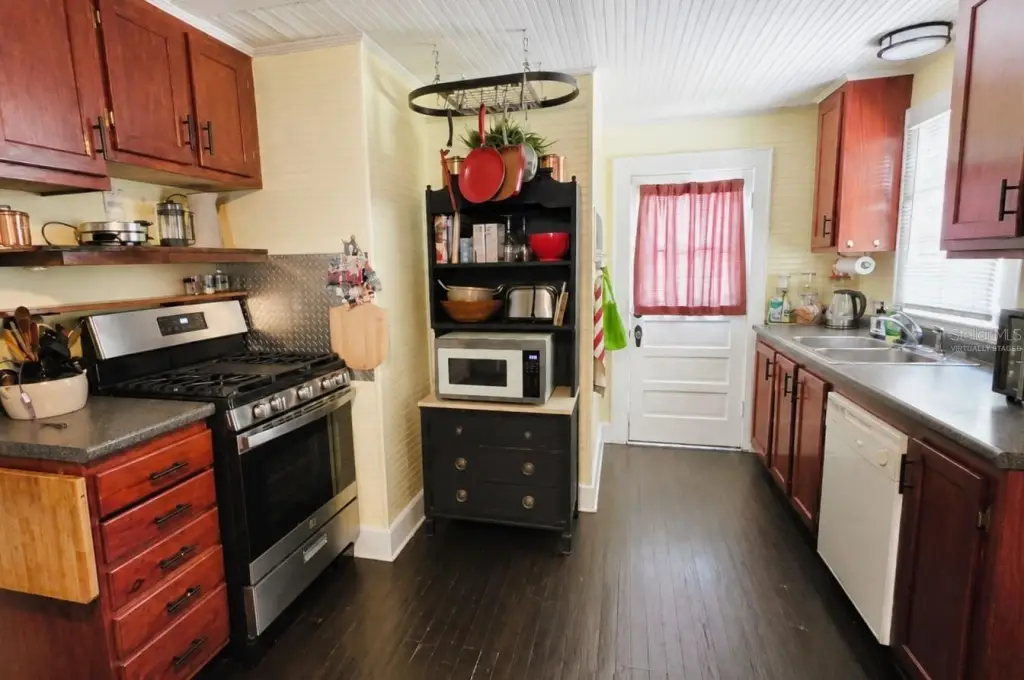
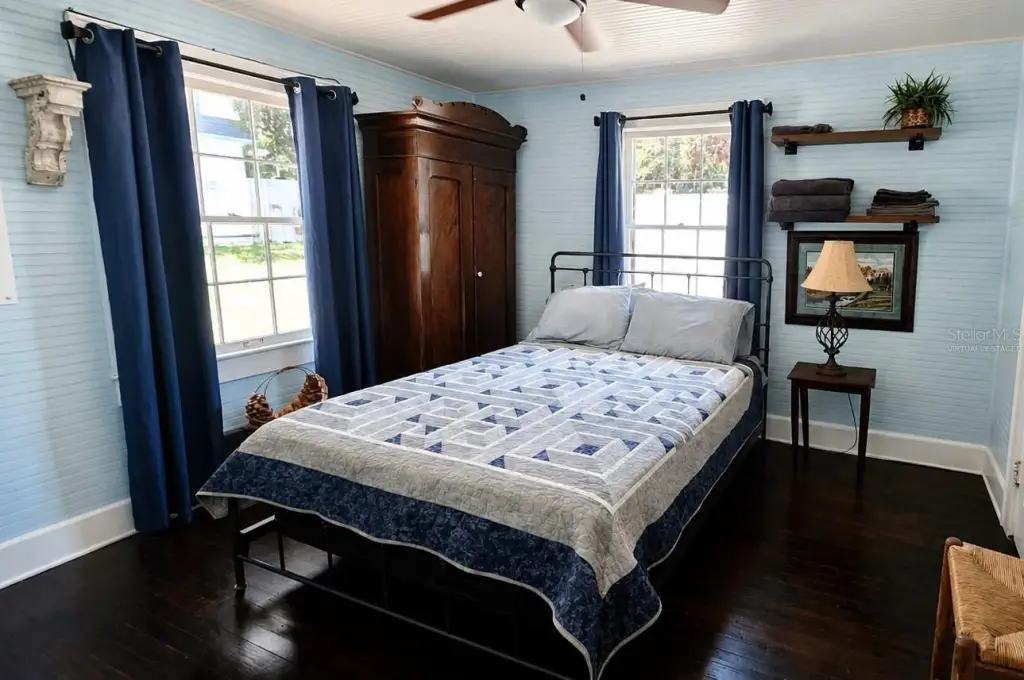
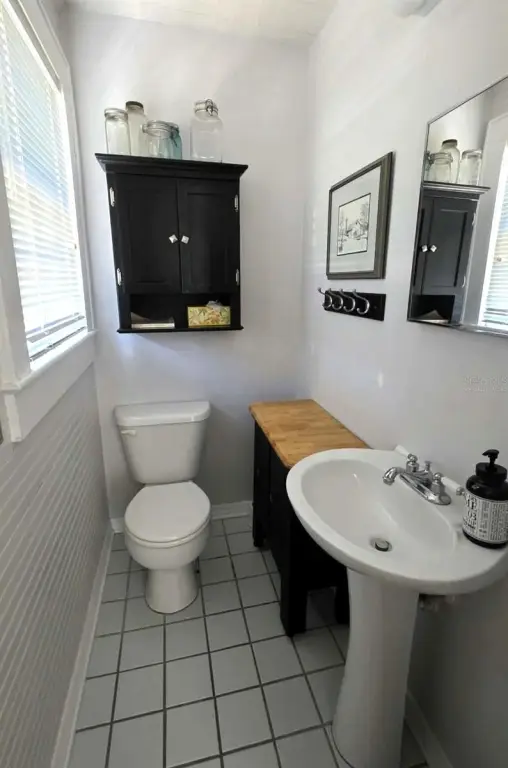
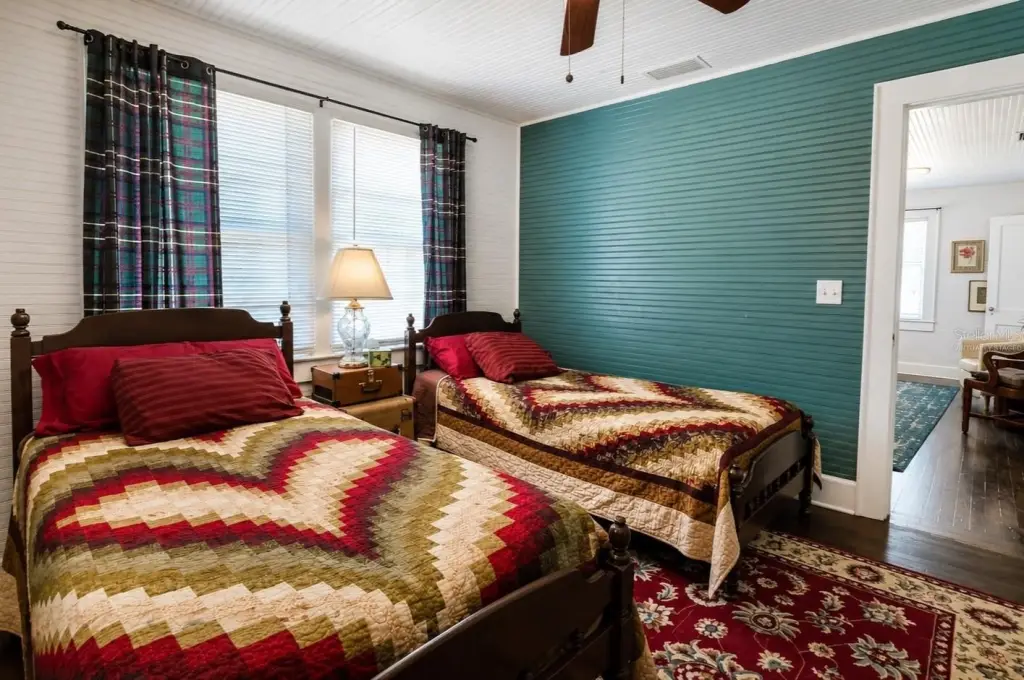
This duplex property includes a remodeled main residence with 2 bedrooms and 1.5 bathrooms, genuine wood floors, historic architectural features, and a wraparound porch. Updates include a metal roof, newer A/C, interior and exterior paint, and renovated kitchen and bathrooms. The detached garage and carport contain a separate 2-bedroom, 1-bath apartment above, creating two distinct residential spaces on the property.
The 0.24-acre corner lot is located at 18758 NW 243RD Terrace in High Springs, less than 3/4 mile from historic downtown. Public water and public sewer are connected. The apartment is occupied by a long-term tenant on a month-to-month basis. Additional property features include off-street parking, wood and ceramic tile flooring, a dishwasher, range, refrigerator, washer, dryer, electric water heater, central air, and window or wall units.
The 0.24-acre corner lot is located at 18758 NW 243RD Terrace in High Springs, less than 3/4 mile from historic downtown. Public water and public sewer are connected. The apartment is occupied by a long-term tenant on a month-to-month basis. Additional property features include off-street parking, wood and ceramic tile flooring, a dishwasher, range, refrigerator, washer, dryer, electric water heater, central air, and window or wall units.
Key Highlights
- Two separate residences: a 2‑bedroom, 1.5‑bath main home and a 2‑bedroom, 1‑bath apartment
- Apartment is positioned above a detached garage and carport
- Remodeled main home includes a metal roof, updated kitchen and baths, and newer A/C
Financial Insights
Estimated NOI and Cap Rate
NOI / Yr
$15,502
Cap Rate
4.19%
Suggested Prices Based on Cap Rates
Cap Rate 5%
$310,040
$310.0K
Cap Rate 7%
$221,457
$221.5K
Cap Rate 9%
$172,244
$172.2K
Market Conditions
NOI Build-Up for 1,442 SF
Gross rent
$23.4K $16.20/SF
− Vacancy
−$1.2K −$0.84/SF
EGI
$22.1K $15.36/SF
− OpEx
−$6.6K −$4.61/SF
NOI
$15.5K $10.75/SF
Area
Alachua County, FL
Vacancy
5.20%
Lease Rate
$16.20 /SF/Yr
Expense Ratio
30.00%
Simulate Cap Rate and NOI
Suggested Prices Based on Cap Rates
Cap Rate 5%
$310,040
Cap Rate 7%
$221,457
Cap Rate 9%
$172,244
Alternative Uses
Best Use
Multifamily LT 5
$221.5K
$193.8K – $258.4K
NOI $15,502 @ 7.0% cap · market cap 4.19%
Second Best
Apartment 5plus
$204.1K
$178.6K – $238.1K
NOI $14,285 @ 7.0% cap · market cap 3.86%
Theoretical Best
Office A
$363.5K
$318.1K – $424.1K
NOI $25,447 @ 7.0% cap · market cap 6.88%
Zoning and permitted uses should be independently verified with authorities.
Property Analytics
Unlock full access to Insights
Subscribe to Realmo Intelligence
Open Analytics
Current Use
Lease Details
2
Residential units
Yes
Utilities to site
Location Intelligence
Trade Area within ½ mile
432
Businesses Nearby
Explore this area
Business Placement
Demographics for 32643, FL
12,549
Population
4,487
Households
2.8
Avg Household Size
44
Median Age
25%
College-Educated
90%
High-School Grad
112.1 sq mi
ZIP Area
112
Density / Sq Mi
$69,871
Median Household Income
$40,458
Median Earnings
$1,515
Median Rent
$254,900
Median Home Value
Check the figures for this property
Cap Rate, Value Estimation, Potential NOI and more
View Realmo Analytics
Market
Vacancy Rate% for Multifamily in South region

Questions? Ask Rey
Realmo’s AI knows this listing — price, zoning, demand, history. Ask anything.




Frequently Asked Questions
What type of property is this?
Duplex - Two separate residences occupy an oversized corner lot near historic downtown, with public water and sewer service connected.
Where is this duplex located?
The property is located at 18758 NW 243RD Terrace High Springs, FL.
What is the asking price?
The asking price for this property is $370,000.
What are key features of this property?
This property features: Two separate residences: a 2‑bedroom, 1.5‑bath main home and a 2‑bedroom, 1‑bath apartment; Apartment is positioned above a detached garage and carport; Remodeled main home includes a metal roof, updated kitchen and baths, and newer A/C