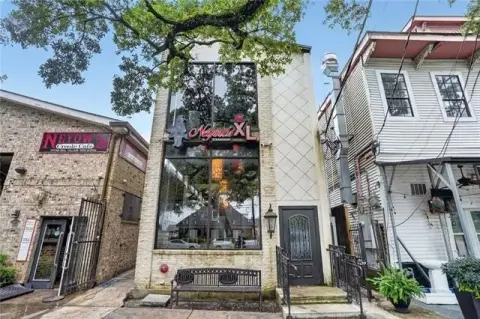
Neighborhood Bar With Adjoining
For Sale
$425,000
1832 SEVENTH Street, New Orleans, LA 70115
Commercial, New Orleans, LA
Property Size2,700 SF
Price / SF$157.41
Days on Market78
Property Features for 1832 SEVENTH Street
General Information
Property type
Commercial Sale
Property subtype
Other
Zoning
HU-RD2
Lot features
Corner
Standard status
Active
APN
412200601
Size
2,700 SF
Taxes and HOA fees
Tax Description
SQ 256 LOT 1 SEVENTH ST AND DRYADES 60X50 = 3000 SQ FT FILE #16954, SQ 256 LOT C DRYADES ST 25X60 = 1500 SQ FT LAND ONLY P-B22104 08/03/94 FILE #18137
Legal Description
SQ 256 LOT 1 SEVENTH ST AND DRYADES 60X50 = 3000 SQ FT FILE #16954, SQ 256 LOT C DRYADES ST 25X60 = 1500 SQ FT LAND ONLY P-B22104 08/03/94 FILE #18137
Utilities
Water source
Public
Amenities
kitchen
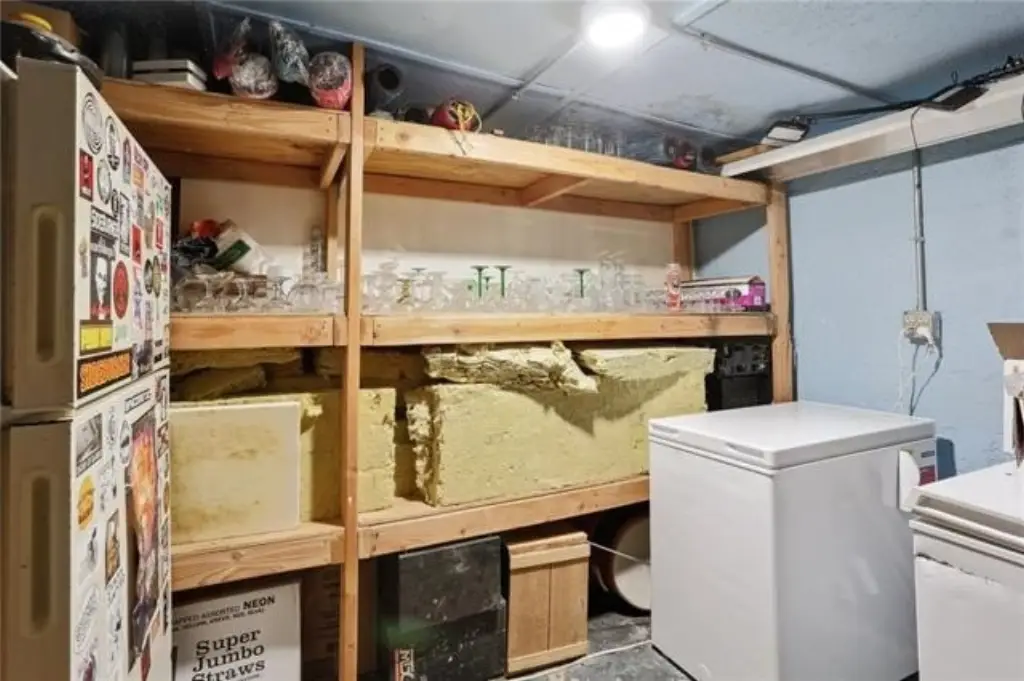
walk-in cooler
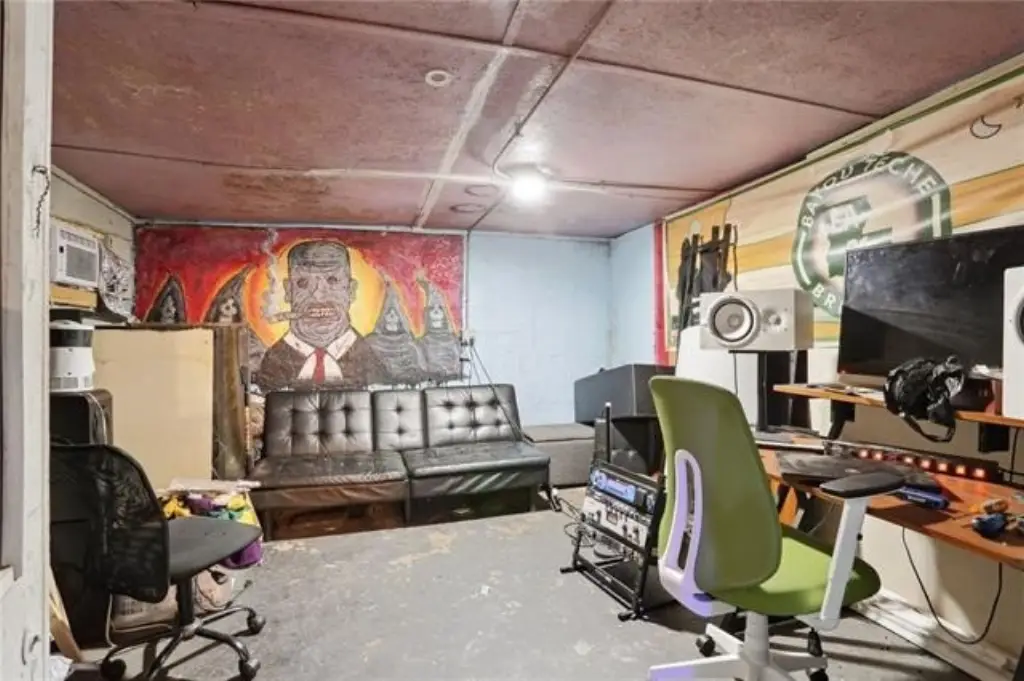
office
bathrooms
storage space
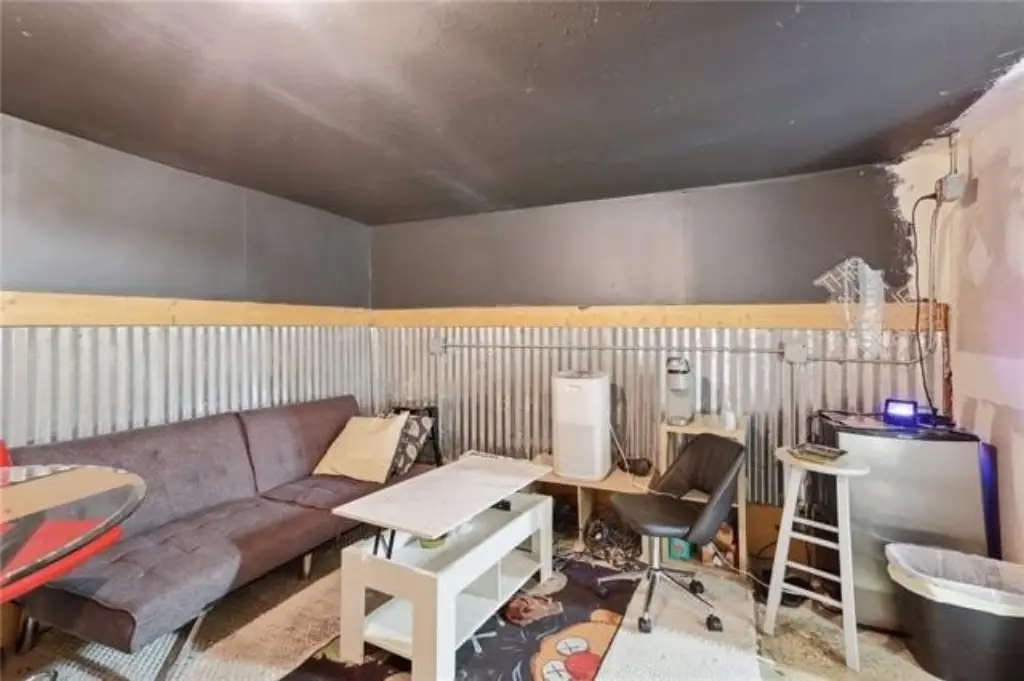
green rooms
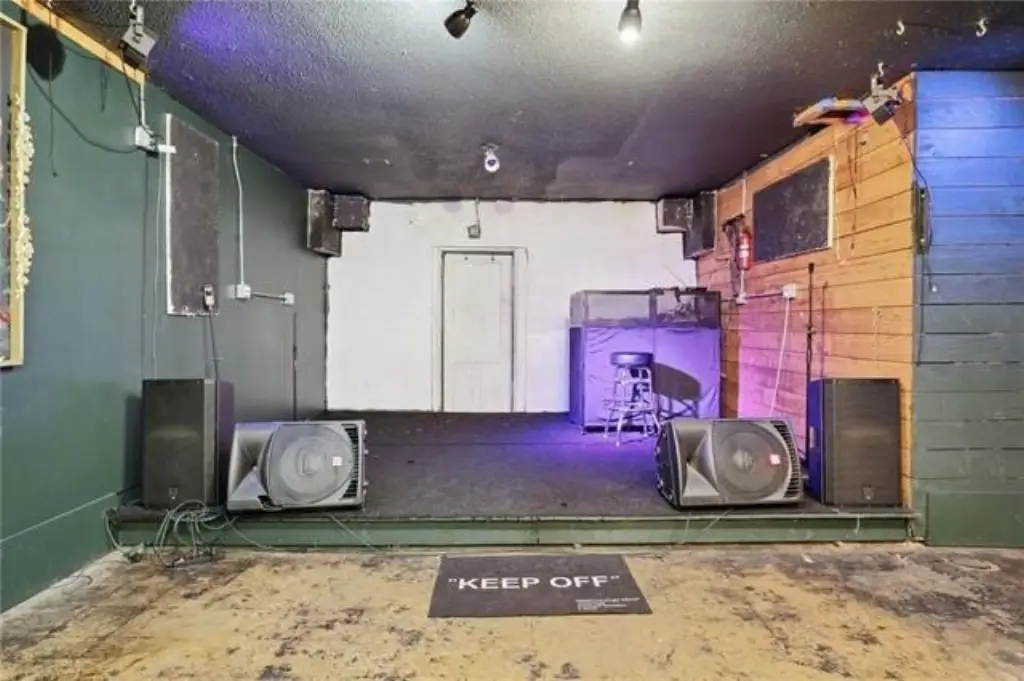
performance space
Building Details
Year built
1964
Floors in Building
1
Listing Agency:
REVE, REALTORS
(504) 300-0700
Listed By:
Tracey Moore · License #73376
(504) 352-3303
Added: Jul 22
Changed: Aug 19
Last Checked: Oct 7 at 6:06AM
MLS# 2568673
Copyright © 2026 New Orleans Metropolitan Association of REALTORS®. All rights reserved. All information provided by the listing agent/broker is deemed reliable but is not guaranteed and should be independently verified.
Investment Insights
Based on property information with market context.
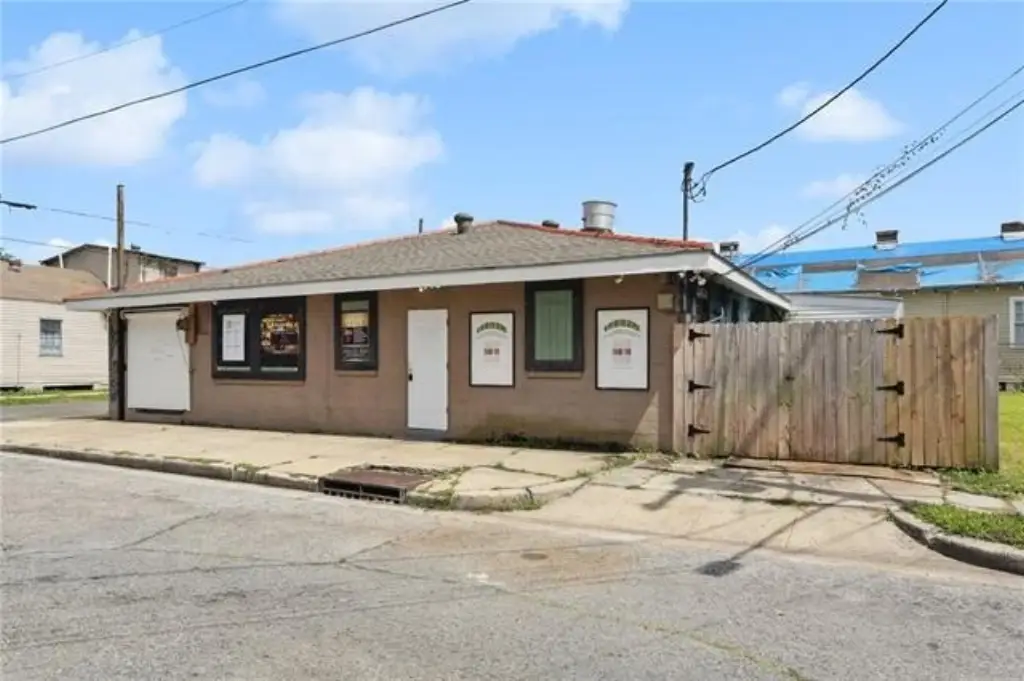
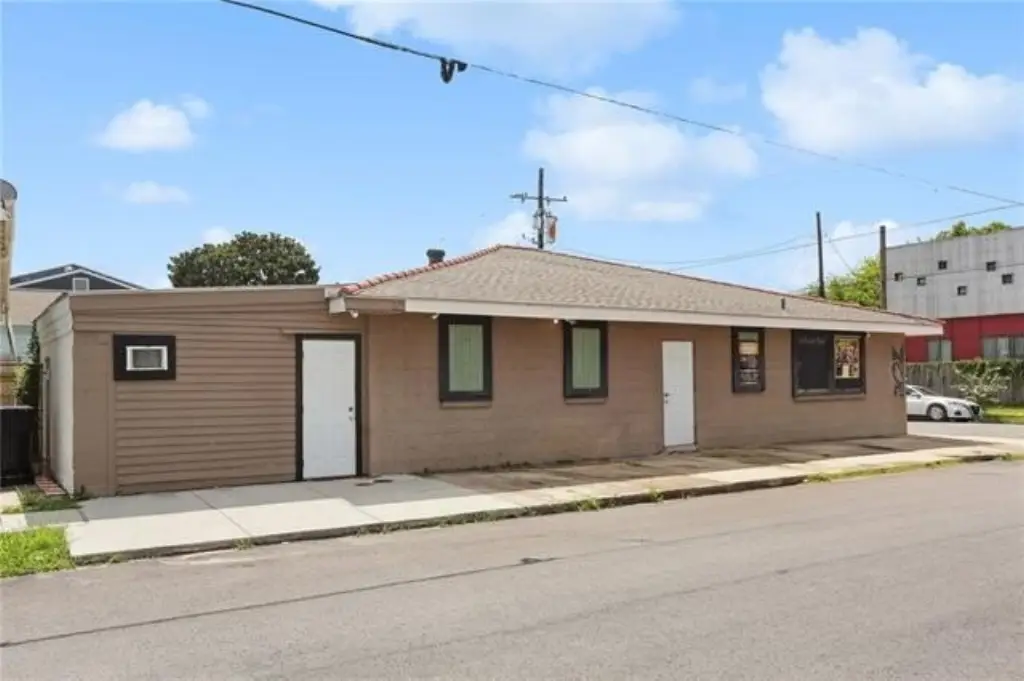
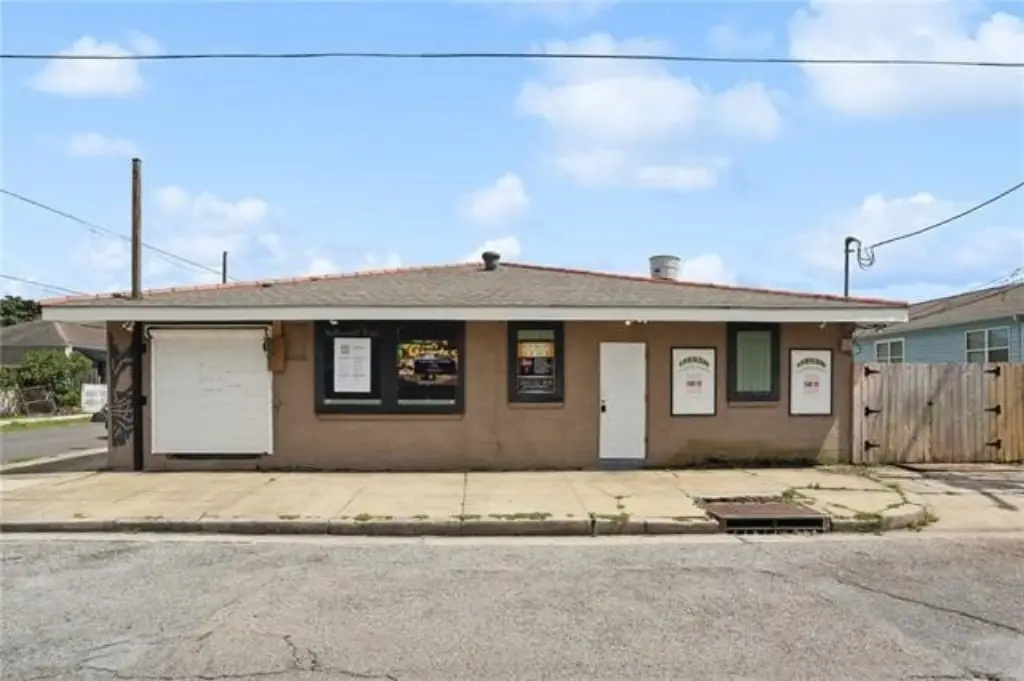
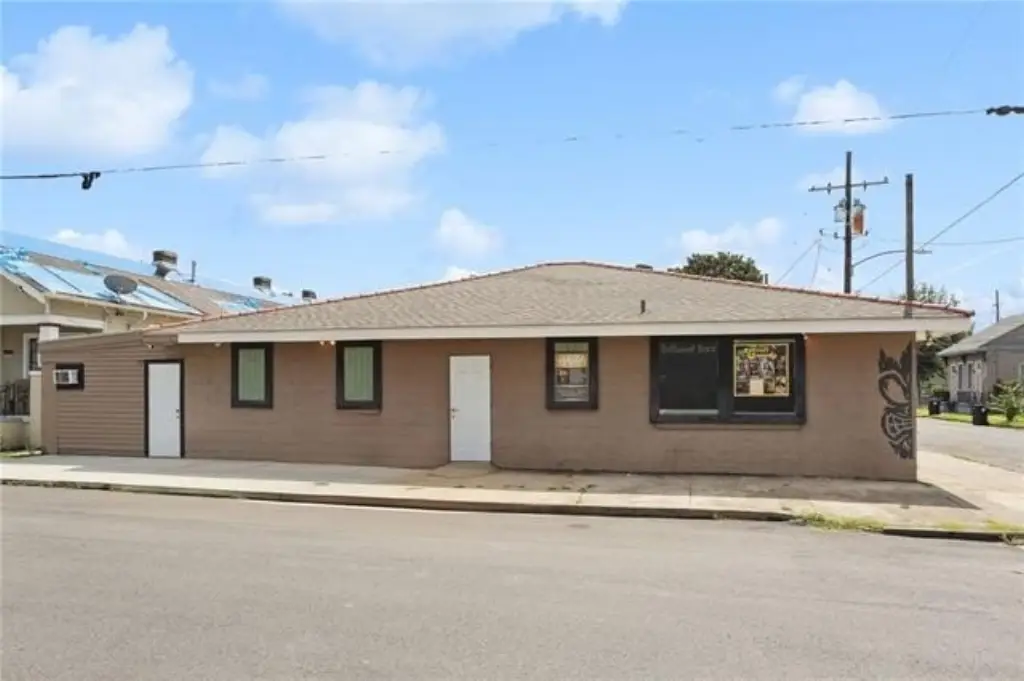
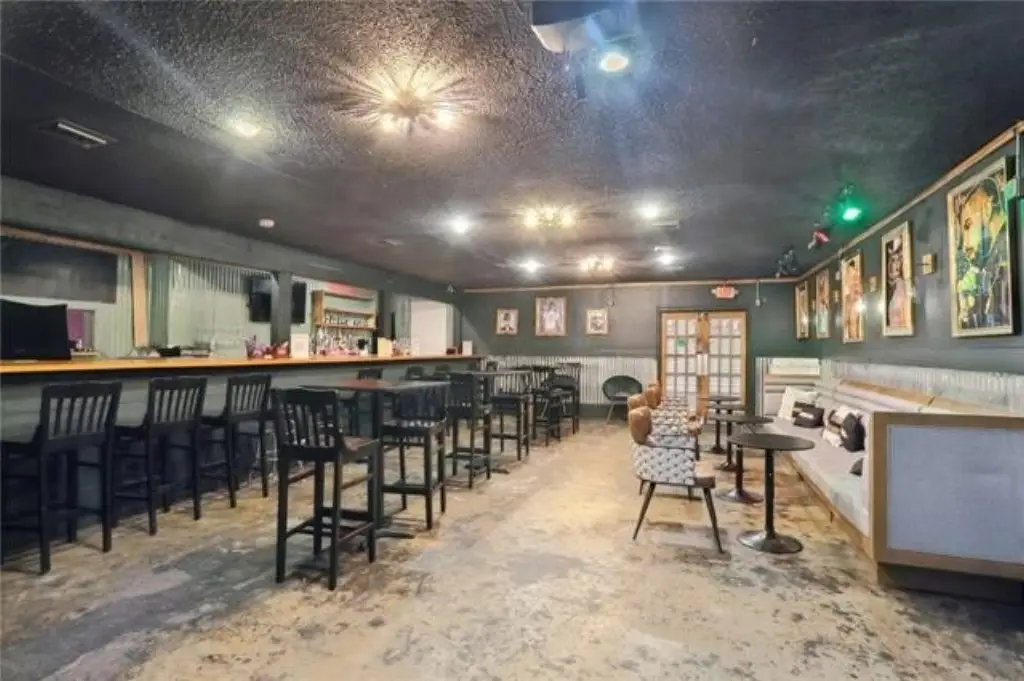
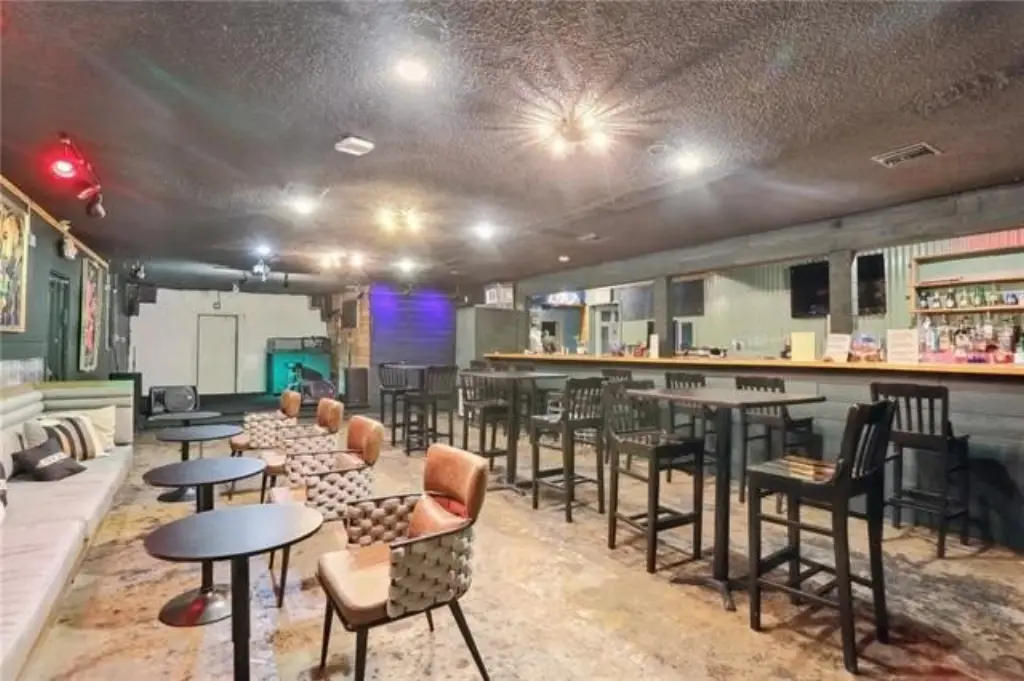
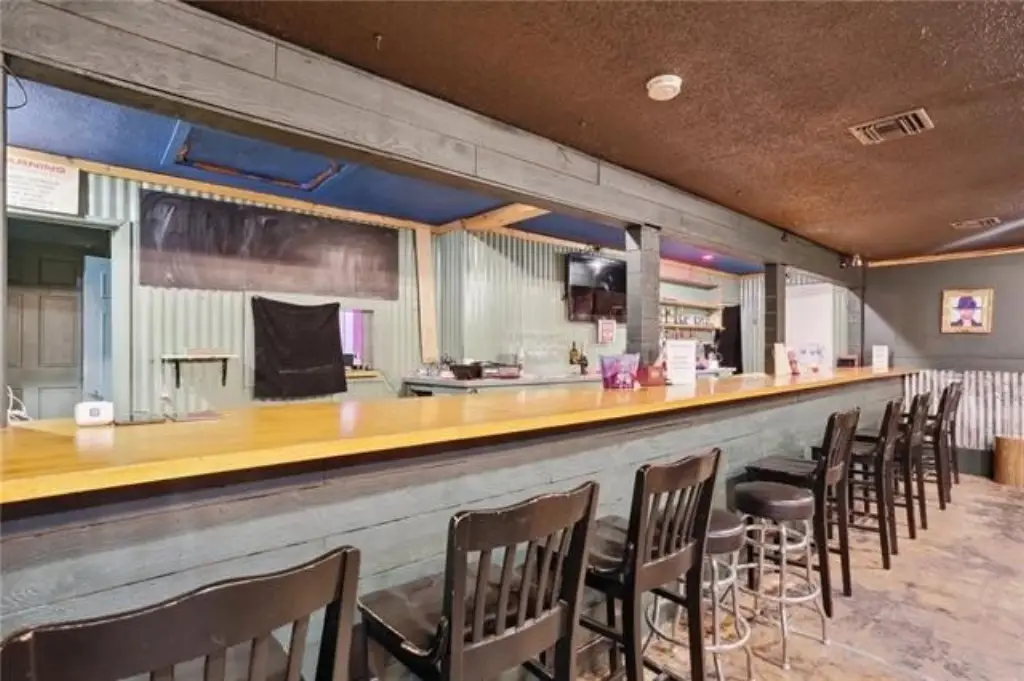
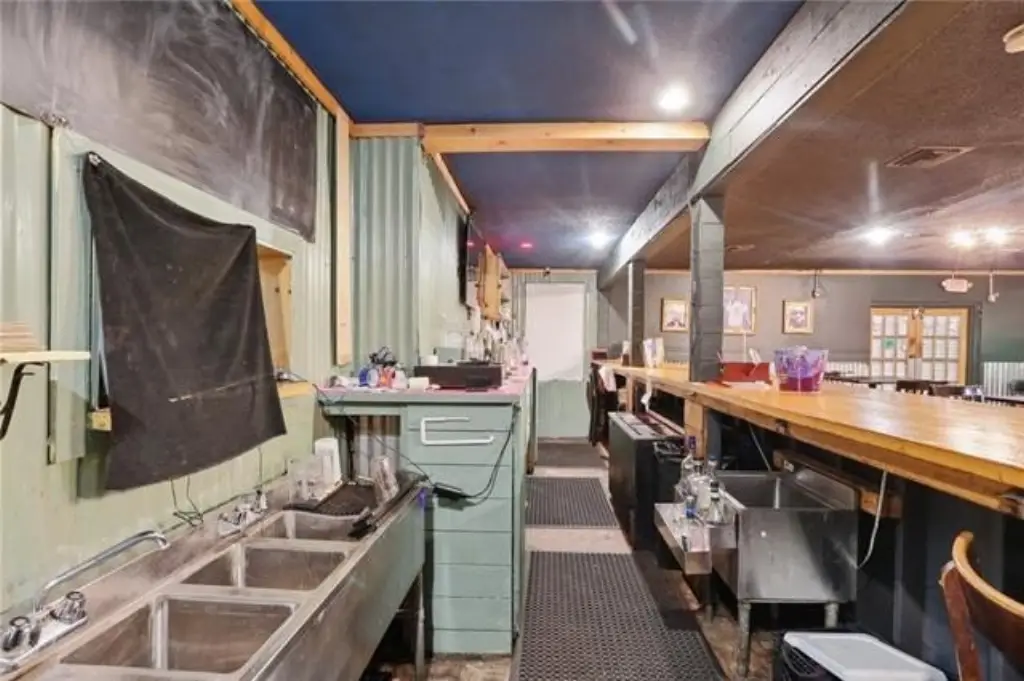
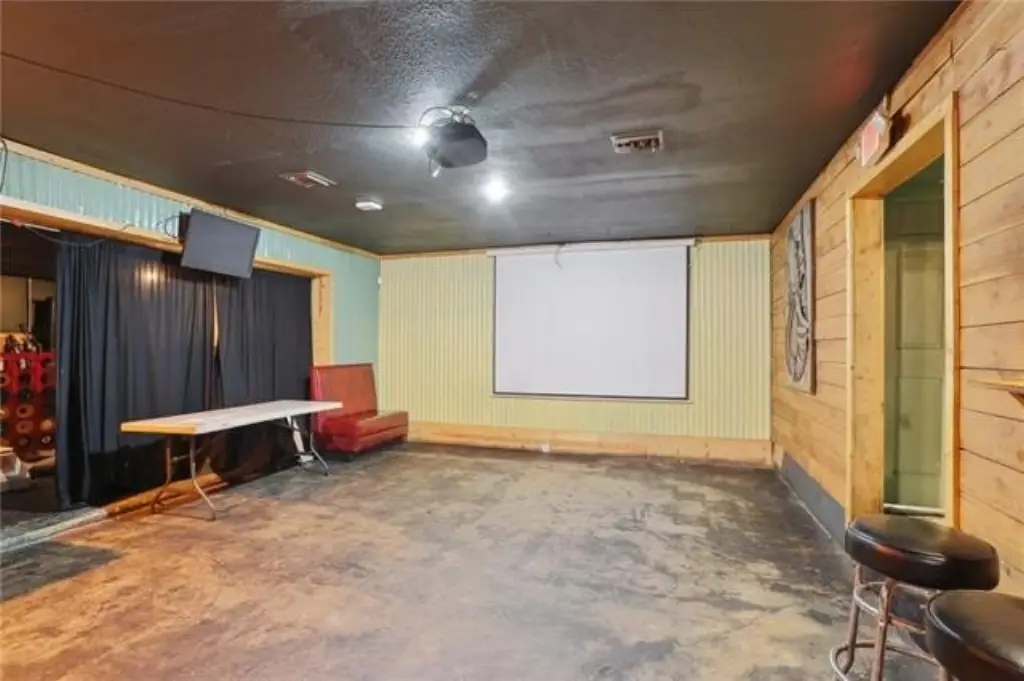
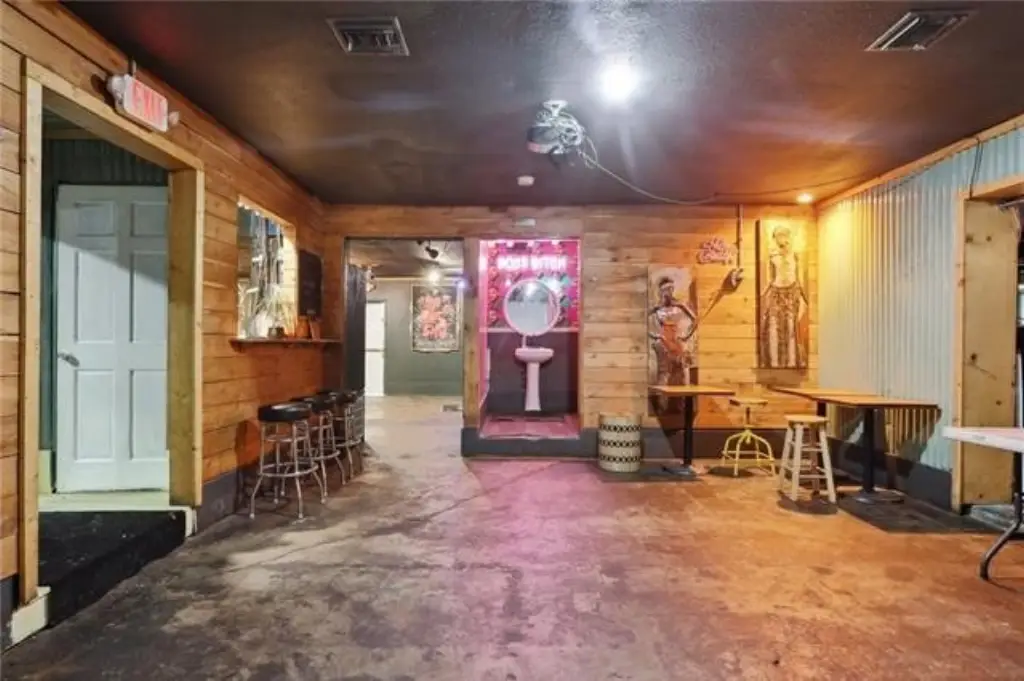
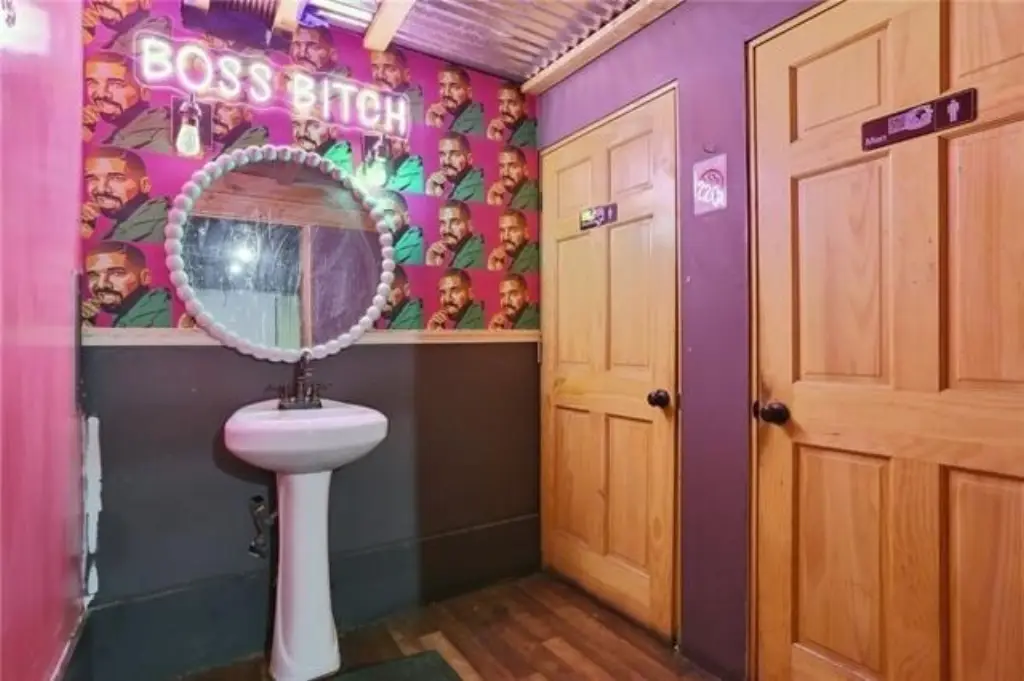
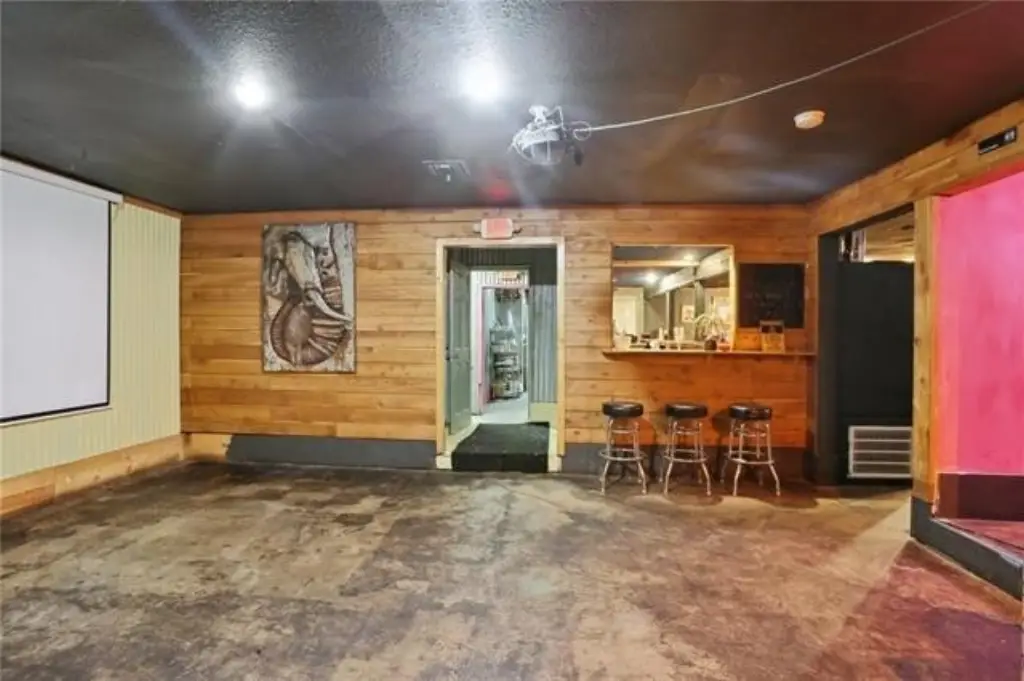
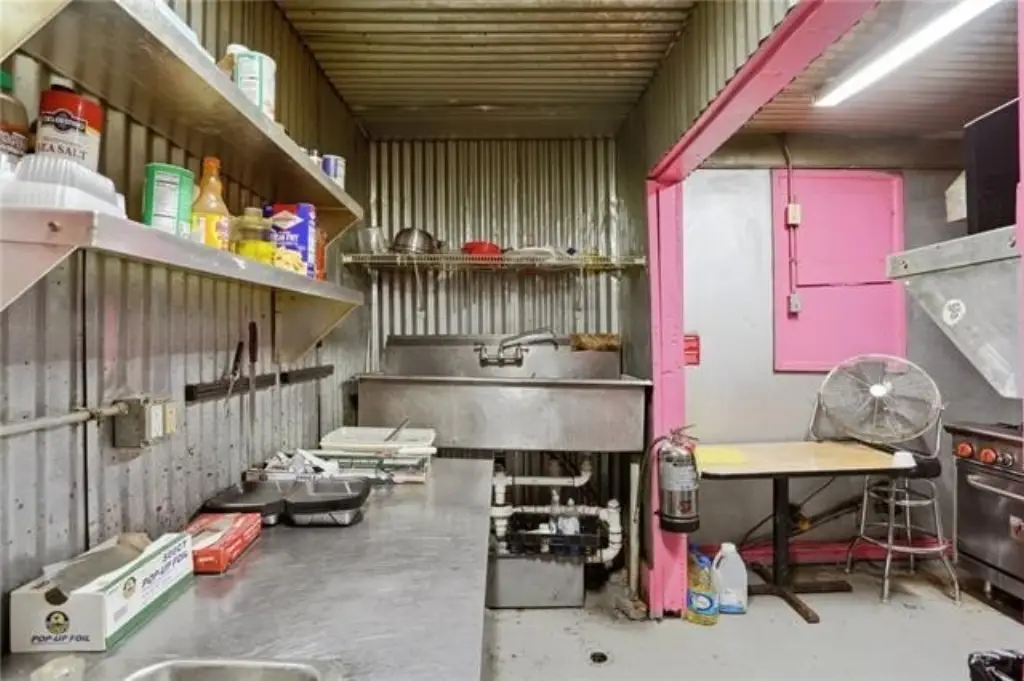
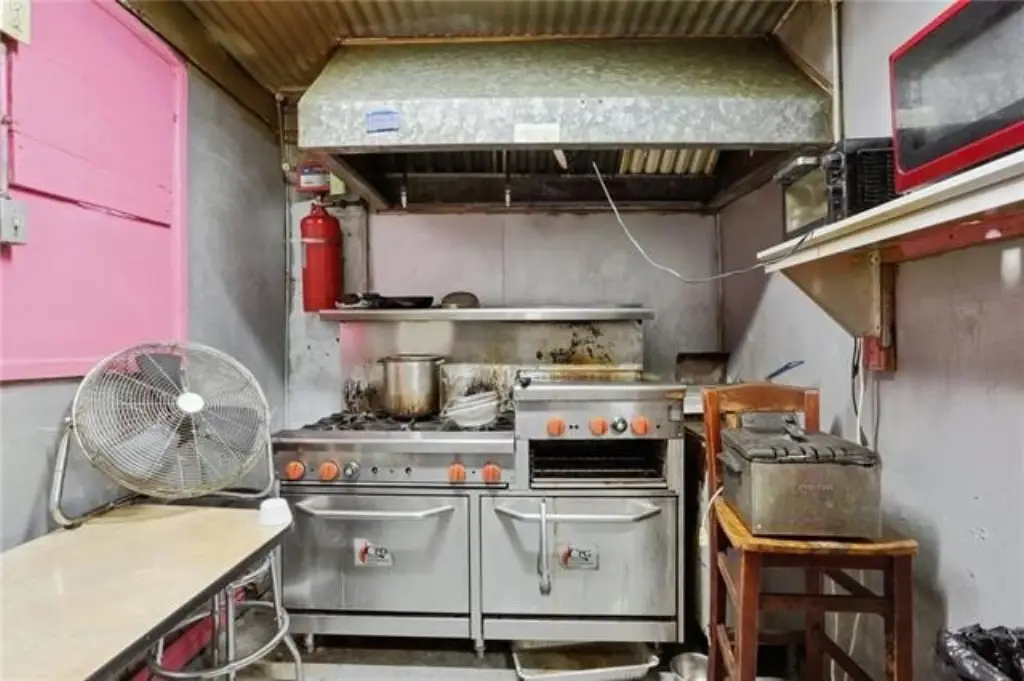
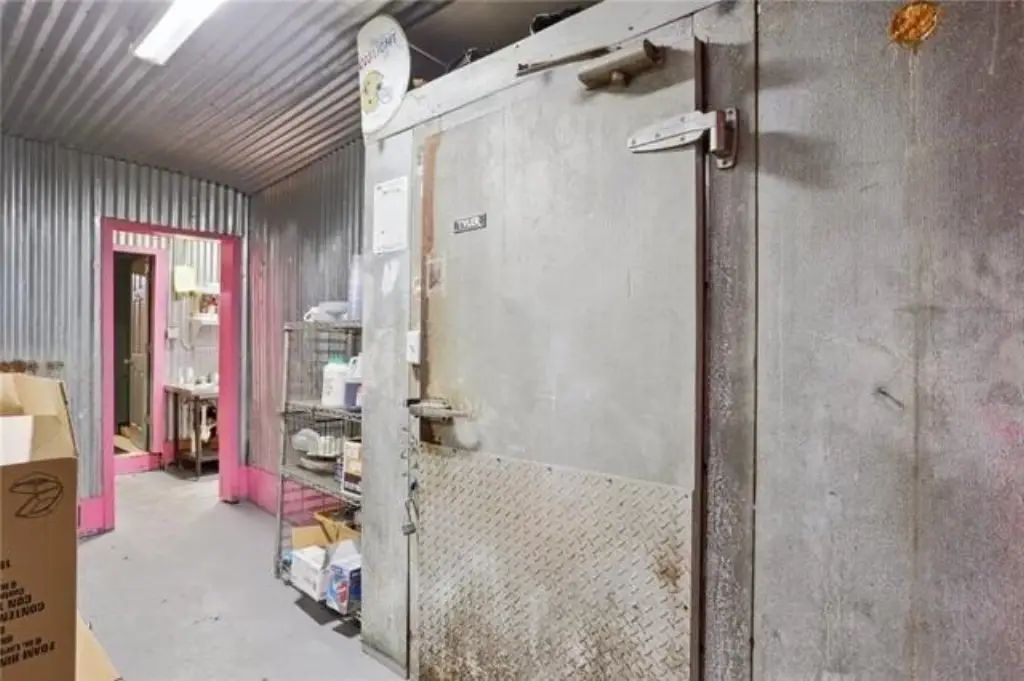
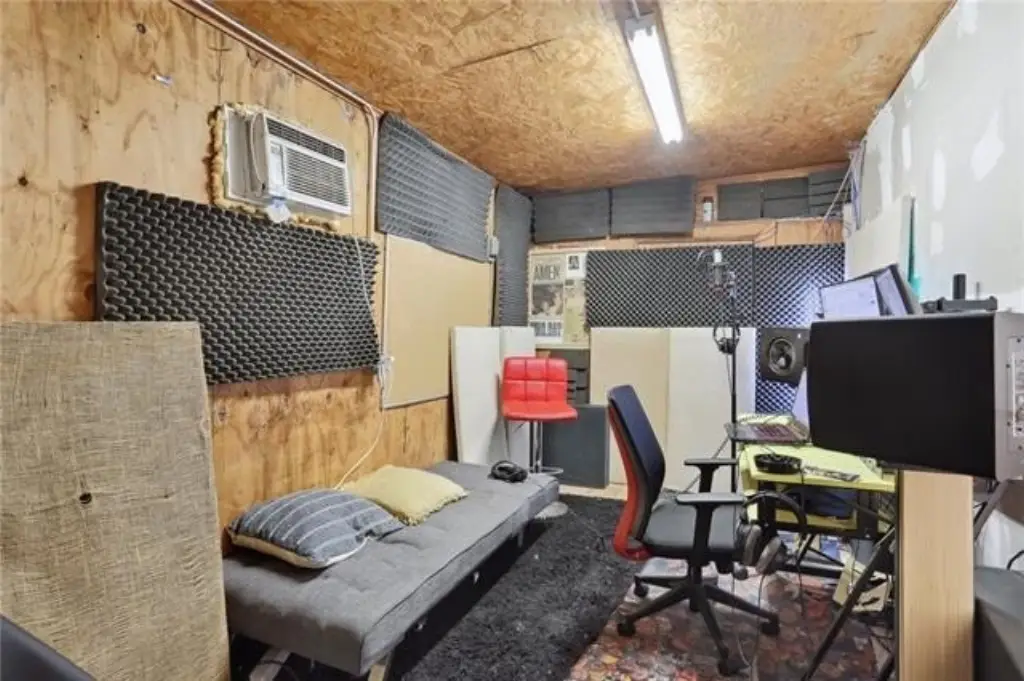
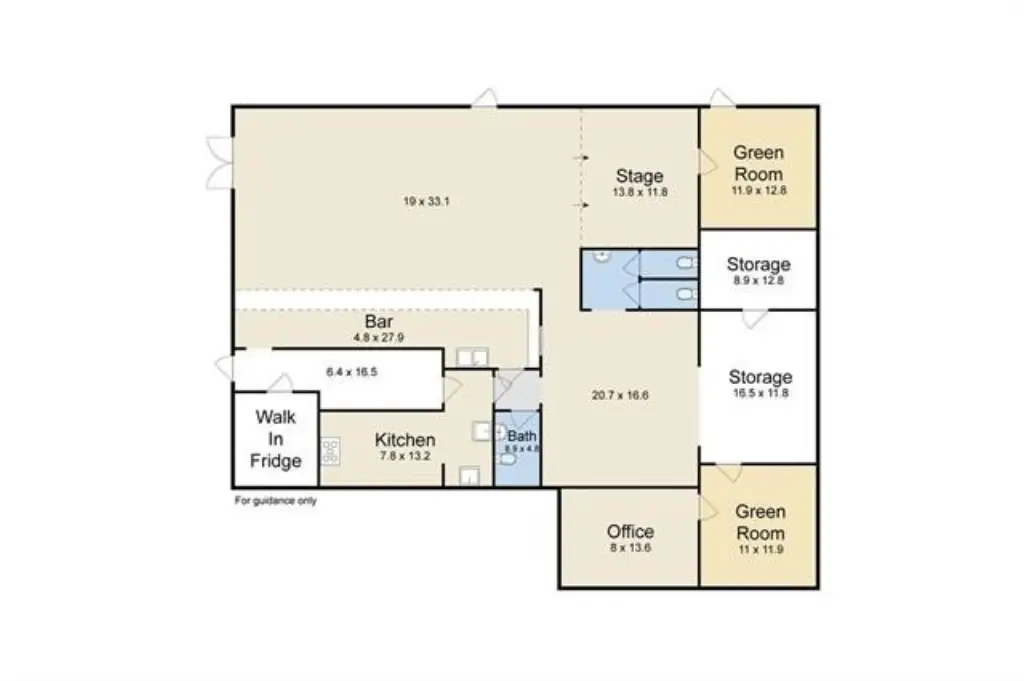
This bar property includes a commercial kitchen, walk-in cooler, office, three bathrooms, and substantial storage. Two restrooms serve patrons, while a separate bathroom is designated for staff. One storage area could be adapted into additional bar space, and the interior configuration includes two potential green rooms near the performance area. Furniture, fixtures, and equipment convey with the sale.
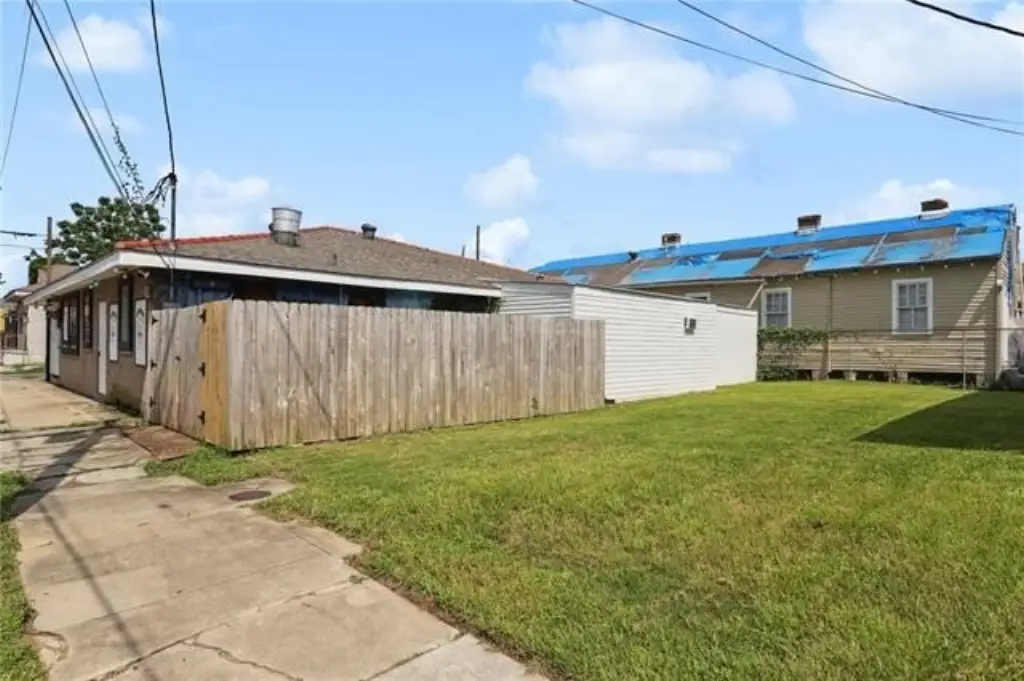
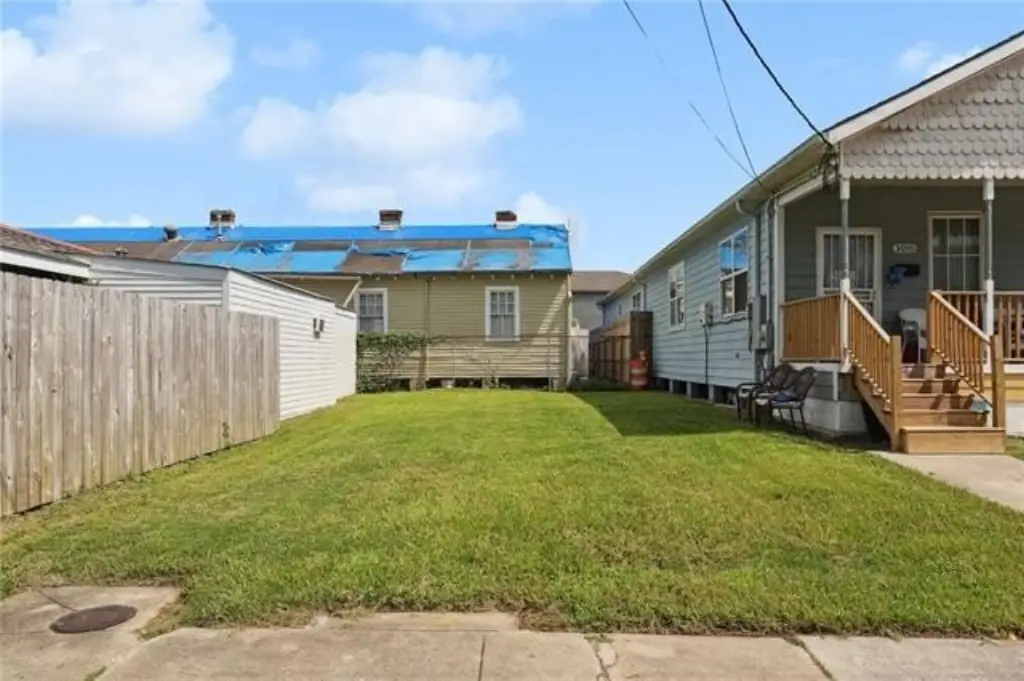
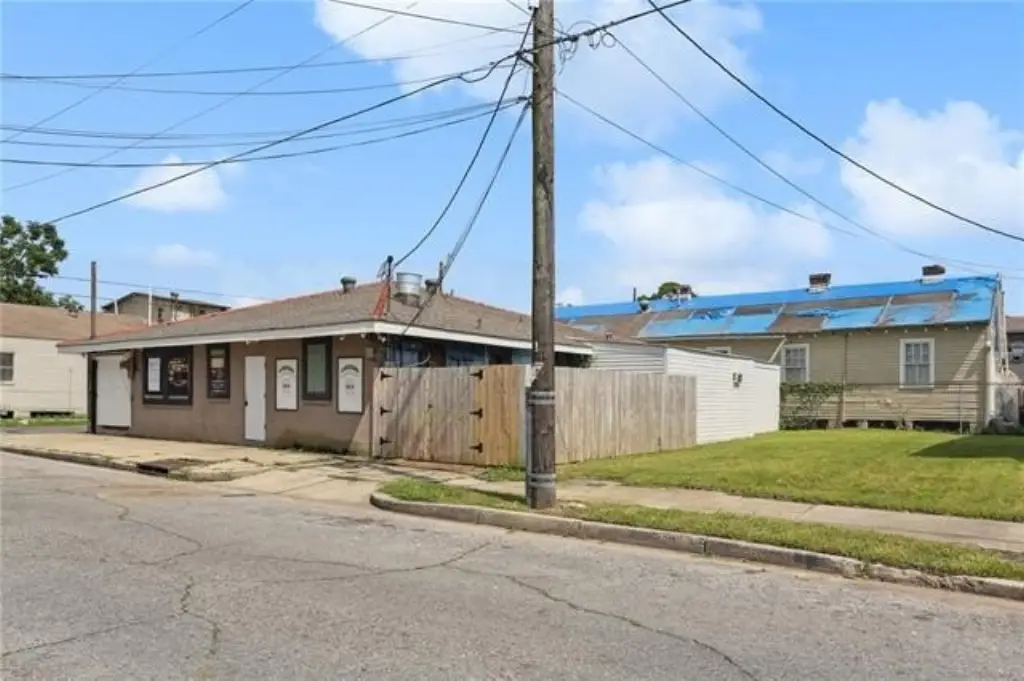
The offering combines the bar at 1832 SEVENTH Street with the neighboring vacant lot at 3008 Dryades. The lot adds 1,500 square feet to the package, while the existing bar contains 2,700 square feet. The property is located in New Orleans near St. Charles Avenue and has public water service. The building was constructed in 1964; zoning is identified as HU-RD2 and should be verified by the purchaser.
The offering combines the bar at 1832 SEVENTH Street with the neighboring vacant lot at 3008 Dryades. The lot adds 1,500 square feet to the package, while the existing bar contains 2,700 square feet. The property is located in New Orleans near St. Charles Avenue and has public water service. The building was constructed in 1964; zoning is identified as HU-RD2 and should be verified by the purchaser.
Key Highlights
- 2,700‑square‑foot bar building constructed in 1964
- Neighboring vacant lot at 3008 Dryades adds 1,500 square feet
- Kitchen includes a walk‑in cooler; FF&E included
Financial Insights
Estimated NOI and Cap Rate
NOI / Yr
$25,243
Cap Rate
5.94%
Suggested Prices Based on Cap Rates
Cap Rate 5%
$504,860
$504.9K
Cap Rate 7%
$360,614
$360.6K
Cap Rate 9%
$280,478
$280.5K
Market Conditions
NOI Build-Up for 2,700 SF
Gross rent
$34.3K $12.72/SF
− Vacancy
−$687 −$0.25/SF
EGI
$33.7K $12.47/SF
− OpEx
−$8.4K −$3.12/SF
NOI
$25.2K $9.35/SF
Area
ZIP 70115
Vacancy
2.00%
Lease Rate
$12.72 /SF/Yr
Expense Ratio
25.00%
Simulate Cap Rate and NOI
Suggested Prices Based on Cap Rates
Cap Rate 5%
$504,860
Cap Rate 7%
$360,614
Cap Rate 9%
$280,478
Alternative Uses
Best Use
Specialty Retail
$360.6K
$315.5K – $420.7K
NOI $25,243 @ 7.0% cap · market cap 5.94%
Second Best
—
—
no second resolved use
Theoretical Best
Office A
$712.3K
$623.3K – $831.1K
NOI $49,864 @ 7.0% cap · market cap 11.73%
Zoning and permitted uses should be independently verified with authorities.
Property Analytics
Unlock full access to Insights
Subscribe to Realmo Intelligence
Open Analytics
Current Use
Location Intelligence
Trade Area within ½ mile
2,551
Businesses Nearby
52k
Monthly Visits Nearby
Well-served
Demand for This Use
Explore this area
Business Placement
Foot Traffic Nearby
Dining 55%
Groceries 43%
Shops & Services 2%
McDonald's
Dining
29,032 visits/mo
0.3 miles
The Fresh Market
Groceries
22,387 visits/mo
0.3 miles
Whitney Bank
Shops & Services
1,011 visits/mo
0.3 miles
Demographics for 70115, LA
31,736
Population
18,134
Households
1.8
Avg Household Size
38
Median Age
64%
College-Educated
95%
High-School Grad
3.8 sq mi
ZIP Area
8,352
Density / Sq Mi
$94,181
Median Household Income
$57,242
Median Earnings
$1,442
Median Rent
$616,600
Median Home Value
Check the figures for this property
Cap Rate, Value Estimation, Potential NOI and more
View Realmo Analytics
Market
Vacancy Rate% for Retail in New Orleans, LA

Questions? Ask Rey
Realmo’s AI knows this listing — price, zoning, demand, history. Ask anything.



Similar Off Market Nearby
- Lilette — 3637 Magazine St, New Orleans, LA 70115
- Bouligny Tavern — 3641 Magazine St, New Orleans, LA 70115
- Uptown Sports Social — 3218 Magazine St #200, New Orleans, LA 70115
- The Bulldog, Uptown — 3236 Magazine St, New Orleans, LA 70115
- Pete’s Out In the Cold Inc — 701 Sixth St, New Orleans, LA 70115
Frequently Asked Questions
What type of property is this?
Bar & Pub - Established bar property with kitchen infrastructure, patron and staff restrooms, storage, and included FF&E.
Where is this bar & pub located?
The property is located at 1832 SEVENTH Street New Orleans, LA.
What is the asking price?
The asking price for this property is $425,000.
What are key features of this property?
This property features: 2,700‑square‑foot bar building constructed in 1964; Neighboring vacant lot at 3008 Dryades adds 1,500 square feet; Kitchen includes a walk‑in cooler; FF&E included



