Four-Unit Apartment
For Sale
$415,000
1816 SAINT PAUL STREET, Baltimore, MD 21202
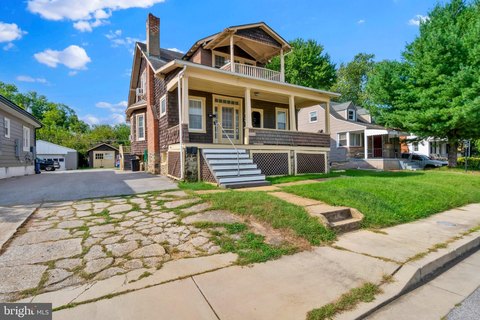
Four-unit, all-electric building with individually controlled HVAC, on-site coin laundry, and two rear off-street parking spaces.
Property Size2,397 SF
Price / SF$173.13
Days on Market91
Property Features for 1816 SAINT PAUL STREET
General Information
Standard status
Active
Size
2,397 SF
Total Parking Spaces
2
Property subtype
Quadruplex
Additional Details
Multifamily Units
4
Building Details
Year Built
1890
Tenancy
Multi
Listing Agency:
Ben Frederick Realty, Inc.
(410) 235-9500
Listed By:
Thomas H Fair · License #649854
(410) 235-5200
Source:
Cummingsrealtors
Added: Jul 14
Changed: Oct 11
Last Checked: Oct 11 at 7:57AM
Displayed information is deemed reliable but is not guaranteed and should be independently verified. All listing content including descriptions, pricing, images are the copyrighted material of Ben Frederick Realty, Inc.
Investment Insights
Based on property information with market context.
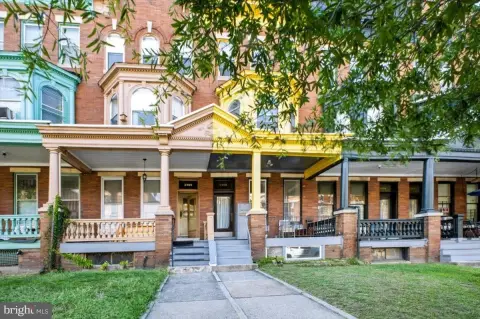
1816 Saint Paul Street is a four-unit apartment building featuring three one-bedroom apartments and one studio apartment. The building is all-electric and certified Lead-Free, with individually controlled heating and cooling in each unit. Additional onsite amenities include coin-operated laundry, and there are two rear off-street parking spaces.
The property is located in Baltimore’s Charles North area, positioned between Charles Village and Midtown. It is approximately three blocks from Penn Station and about one block south of the Station North Arts & Entertainment District, with the University of Baltimore roughly four blocks away. Public transportation and nearby employers, restaurants, entertainment, and higher education are within close reach.
As currently configured, the mix of unit types supports an in-place rental stream, with each apartment operating independently thanks to the individually controlled HVAC systems.
The property is located in Baltimore’s Charles North area, positioned between Charles Village and Midtown. It is approximately three blocks from Penn Station and about one block south of the Station North Arts & Entertainment District, with the University of Baltimore roughly four blocks away. Public transportation and nearby employers, restaurants, entertainment, and higher education are within close reach.
As currently configured, the mix of unit types supports an in-place rental stream, with each apartment operating independently thanks to the individually controlled HVAC systems.
Key Highlights
- Four‑unit all‑electric apartment building built in 1890
- Unit mix: three 1‑bedroom apartments and one studio apartment
- Individually controlled heating and cooling in each apartment
Financial Insights
Estimated NOI and Cap Rate
NOI / Yr
$35,201
Cap Rate
8.48%
Suggested Prices Based on Cap Rates
Cap Rate 5%
$704,020
$704.0K
Cap Rate 7%
$502,871
$502.9K
Cap Rate 9%
$391,122
$391.1K
Market Conditions
NOI Build-Up for 2,397 SF
Gross rent
$53.2K $22.20/SF
− Vacancy
−$2.9K −$1.22/SF
EGI
$50.3K $20.98/SF
− OpEx
−$15.1K −$6.29/SF
NOI
$35.2K $14.69/SF
Area
Baltimore, MD
Vacancy
5.50%
Lease Rate
$22.20 /SF/Yr
Expense Ratio
30.00%
Simulate Cap Rate and NOI
Suggested Prices Based on Cap Rates
Cap Rate 5%
$704,020
Cap Rate 7%
$502,871
Cap Rate 9%
$391,122
Alternative Uses
Best Use
Multifamily LT 5
$502.9K
$440.0K – $586.7K
NOI $35,201 @ 7.0% cap · market cap 8.48%
Second Best
Apartment 5plus
$446.1K
$390.4K – $520.5K
NOI $31,229 @ 7.0% cap · market cap 7.53%
Theoretical Best
Office A
$574.3K
$502.5K – $670.0K
NOI $40,198 @ 7.0% cap · market cap 9.69%
Zoning and permitted uses should be independently verified with authorities.
Property Analytics
Unlock full access to Insights
Subscribe to Realmo Intelligence
Open Analytics
Current Use
Lease Details
4
Residential units
Multi-tenant
Tenancy
Location Intelligence
Trade Area within ½ mile
3,263
Businesses Nearby
Explore this area
Business Placement
Demographics for 21202, MD
22,247
Population
12,731
Households
1.7
Avg Household Size
33
Median Age
48%
College-Educated
86%
High-School Grad
1.6 sq mi
ZIP Area
13,904
Density / Sq Mi
$61,578
Median Household Income
$53,609
Median Earnings
$1,497
Median Rent
$307,700
Median Home Value
Check the figures for this property
Cap Rate, Value Estimation, Potential NOI and more
View Realmo Analytics
Market
Vacancy Rate% for Multifamily in South region

Questions? Ask Rey
Realmo’s AI knows this listing — price, zoning, demand, history. Ask anything.



Frequently Asked Questions
What type of property is this?
Quadplex - Four-unit, all-electric building with individually controlled HVAC, on-site coin laundry, and two rear off-street parking spaces.
Where is this quadplex located?
The property is located at 1816 SAINT PAUL STREET Baltimore, MD.
What is the asking price?
The asking price for this property is $415,000.
What are key features of this property?
This property features: Four‑unit all‑electric apartment building built in 1890; Unit mix: three 1‑bedroom apartments and one studio apartment; Individually controlled heating and cooling in each apartment