Uptown Waterville Mixed-Use






For Sale
$488,000
18 3Rd St, Waterville, OH 43566
PRIME UPTOWN WATERVILLE COMMERCIAL BUILDING - BUSINESS. 18 S Third Street Waterville, OHio 43566
Property Size2,188 SF
Lot Size0.25 Acres
Price / SF$223.03
Days on Market374
Property Features for 18 3Rd St
General Information
Standard status
Active
Property type
Office buildings, Mixed-use properties, Commercial land, Office Spaces
Size
2,188 SF
Net Rentable
2,188 SF
Total Parking Spaces
5
Elevators
No
Lot size
0.25 Acres
Occupancy
100%
Building Details
Year Built
1896
Buildings
3
Stories
2
Units
2
Listed By:
Cathy Smith
(419) 280-3942
Added: Sep 28, 2025
Changed: Mar 16
Investment Insights
Based on property information with market context.
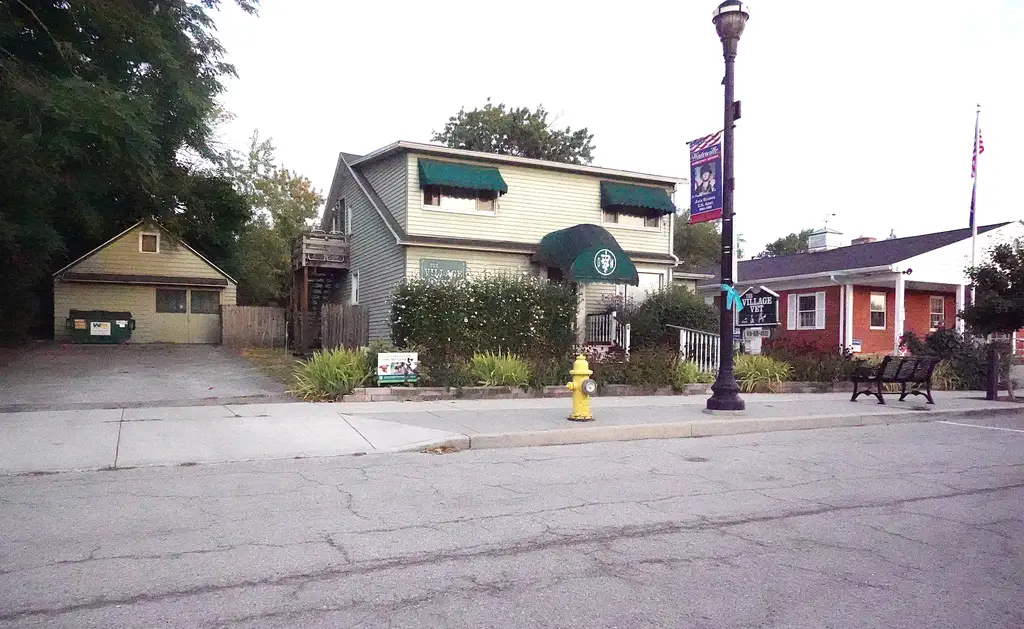
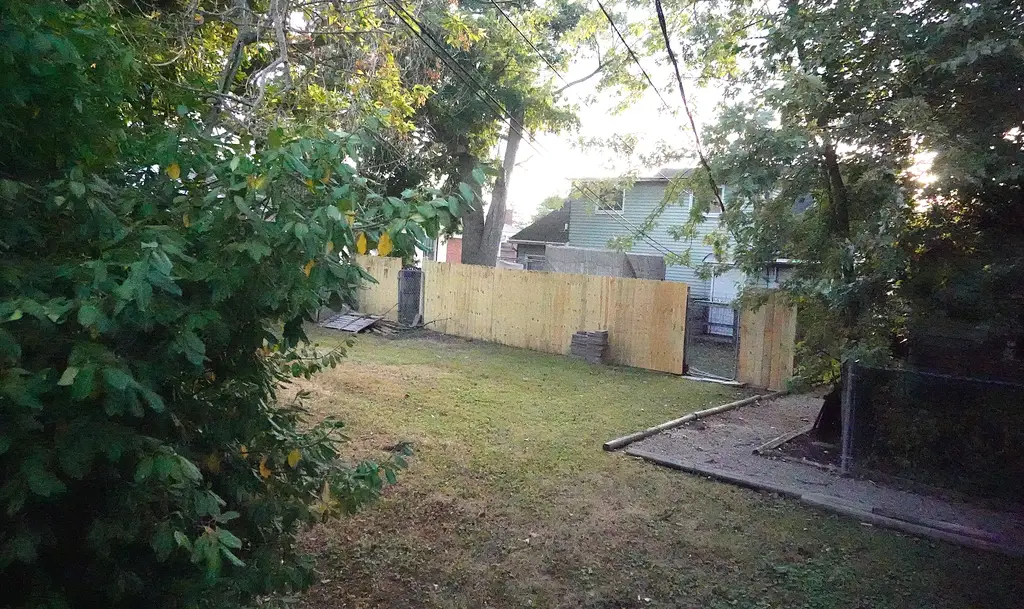
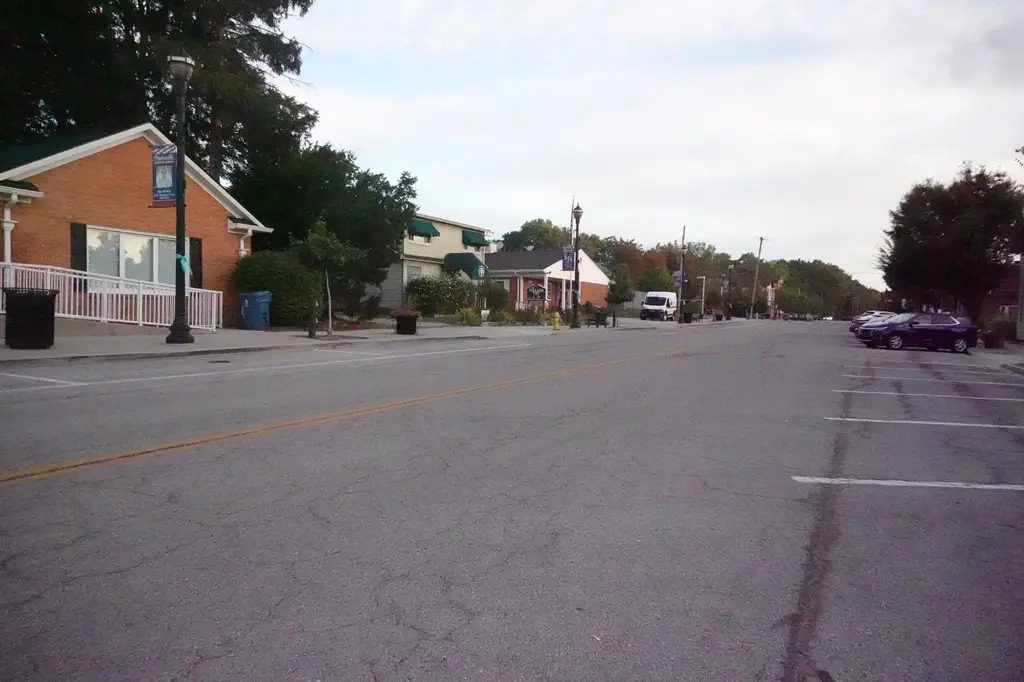
This mixed-use building is located in Uptown Waterville. The two-story building has 2,188 square feet of space and includes a second-floor two-bedroom apartment, as well as two out-buildings. Situated on an 11,001 square foot lot, the property currently operates as a veterinary hospital, complete with equipment and furnishings. The property's layout and location lend itself to various business opportunities, including a storefront retail store, health and wellness facility, bar, restaurant, shop, or salon. The building features over 85 feet of frontage in uptown Waterville. The property includes two bedrooms, two bathrooms, two kitchens, and a total of 13 rooms. City parking areas are close and accessible. There is a proposal for Waterville City to use vacant land near the back of this property to offer more parking for the town.
Key Highlights
- Vet Clinic and apartment, lends itself to storefront retail store, health and wellness facility, bar restaurant, shop, salon, with over 85 feet of uptown Waterville frontage.
Financial Insights
Estimated NOI and Cap Rate
NOI / Yr
$18,765
Cap Rate
3.85%
Suggested Prices Based on Cap Rates
Cap Rate 5%
$375,300
$375.3K
Cap Rate 7%
$268,071
$268.1K
Cap Rate 9%
$208,500
$208.5K
Market Conditions
NOI Build-Up for 2,188 SF
Gross rent
$36.0K $16.44/SF
− Vacancy
−$5.9K −$2.72/SF
EGI
$30.0K $13.72/SF
− OpEx
−$11.3K −$5.15/SF
NOI
$18.8K $8.58/SF
Area
Lucas County, OH
Vacancy
16.53%
Lease Rate
$16.44 /SF/Yr
Expense Ratio
37.50%
Simulate Cap Rate and NOI
Suggested Prices Based on Cap Rates
Cap Rate 5%
$375,300
Cap Rate 7%
$268,071
Cap Rate 9%
$208,500
Alternative Uses
Best Use
Mixed Use
$268.1K
$234.6K – $312.8K
NOI $18,765 @ 7.0% cap · market cap 3.85%
Second Best
Office B
$258.5K
$226.2K – $301.6K
NOI $18,094 @ 7.0% cap · market cap 3.71%
Theoretical Best
Specialty Retail
$400.5K
$350.4K – $467.2K
NOI $28,032 @ 7.0% cap · market cap 5.74%
Zoning and permitted uses should be independently verified with authorities.
Property Analytics
Unlock full access to Insights
Subscribe to Realmo Intelligence
Open Analytics
Current Use
Location Intelligence
Trade Area within ½ mile
209
Businesses Nearby
Explore this area
Business Placement
Demographics for 43566, OH
8,371
Population
3,594
Households
2.3
Avg Household Size
43
Median Age
46%
College-Educated
98%
High-School Grad
18.4 sq mi
ZIP Area
455
Density / Sq Mi
$108,497
Median Household Income
$57,413
Median Earnings
$1,378
Median Rent
$283,500
Median Home Value
Check the figures for this property
Cap Rate, Value Estimation, Potential NOI and more
View Realmo Analytics
Market
Vacancy Rate% for Office in Midwest region

Questions? Ask Rey
Realmo’s AI knows this listing — price, zoning, demand, history. Ask anything.


Frequently Asked Questions
What type of property is this?
Office building - PRIME UPTOWN WATERVILLE COMMERCIAL BUILDING - BUSINESS. 18 S Third Street Waterville, OHio 43566
Where is this office building located?
The property is located at 18 3Rd St Waterville, OH.
What is the asking price?
The asking price for this property is $488,000.
What are key features of this property?
This property features: Vet Clinic and apartment, lends itself to storefront retail store, health and wellness facility, bar restaurant, shop, salon, with over 85 feet of uptown Waterville frontage.


