Equipped Restaurant
For Sale
$1,900,000
18-28 Oneida St, Oneonta, NY 13820
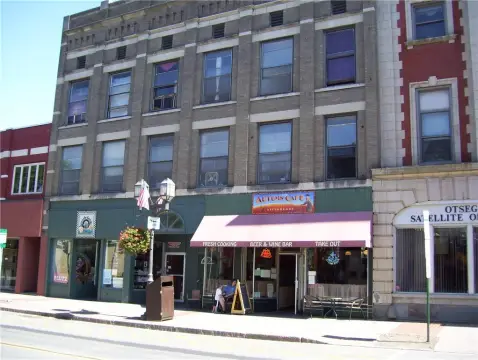
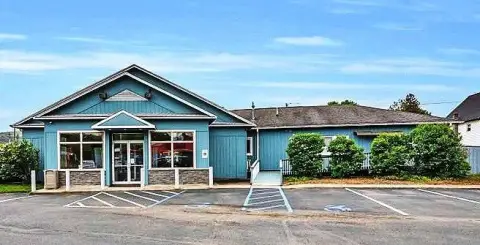
Restaurant property with adjacent office, residential, and commercial buildings across a multi-parcel site.
Property Size9,234 SF
Lot Size2.13 Acres
Days on Market48
Property Features for 18-28 Oneida St
General Information
Standard status
Active
Size
9,234 SF
Lot size
2.13 Acres
Property subtype
Commercial
Site & Location
Highway Access
Yes
Utilities to Site
Yes
Additional Details
Equipment Included
Yes
Taxes and HOA fees
Annual Taxes
$21,718
Building Details
Building Size
9,234 SF
Year Built
1965
Buildings
5
Stories
1
Listing Agency:
Benson Agency Real Estate LLC
Listed By:
Rodger B Moran · License #30MO0797197
(607) 287-1559
Source:
Elliman
Added: Sep 6
Changed: Oct 10
Last Checked: Oct 20 at 10:17PM
Displayed information is deemed reliable but is not guaranteed and should be independently verified. All listing content including descriptions, pricing, images are the copyrighted material of Benson Agency Real Estate LLC

Ask AI about this property
Review the available facts, identify missing information and prepare questions for the agent.
Investment Insights
Based on property information with market context.
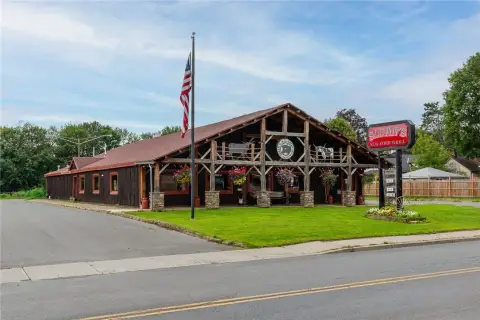
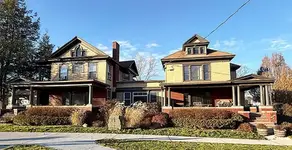
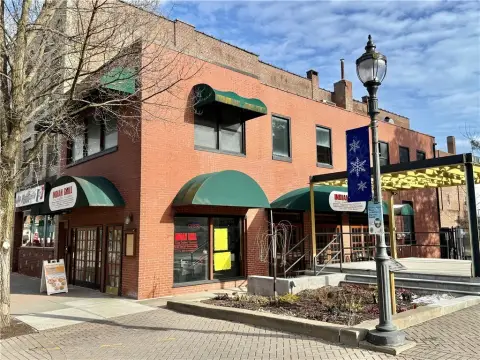
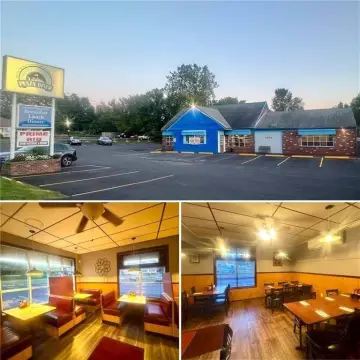
This restaurant offering includes a 4,000-square-foot building with equipment in place, along with an adjacent 1,792-square-foot office building. The site also contains a 1,479-square-foot Arts and Crafts brick bungalow, a 1,008-square-foot block commercial building, and a 955-square-foot Cape-style home.
The assemblage covers 2.13 acres across four tax parcels at 18-28 Oneida St in Oneonta, New York. Public water, sewer, and natural gas serve the property. The site is less than one mile from Cooperstown All Star Village and offers access from I-88, with the corner home positioned at Oneida Street and Van Woert Avenue.
The restaurant building has operated under the same family ownership for 55 years and conveys with its existing equipment.
The assemblage covers 2.13 acres across four tax parcels at 18-28 Oneida St in Oneonta, New York. Public water, sewer, and natural gas serve the property. The site is less than one mile from Cooperstown All Star Village and offers access from I-88, with the corner home positioned at Oneida Street and Van Woert Avenue.
The restaurant building has operated under the same family ownership for 55 years and conveys with its existing equipment.
Key Highlights
- 4,000‑square‑foot restaurant building conveys fully equipped
- 2.13 acres across four tax parcels
- Includes 1,792‑square‑foot office building and 1,008‑square‑foot commercial building
Financial Insights
Estimated NOI and Cap Rate
NOI / Yr
$127,893
Cap Rate
6.73%
Suggested Prices Based on Cap Rates
Cap Rate 5%
$2,557,860
$2.6M
Cap Rate 7%
$1,827,043
$1.8M
Cap Rate 9%
$1,421,033
$1.4M
Market Conditions
NOI Build-Up for 9,234 SF
Gross rent
$175.1K $18.96/SF
− Vacancy
−$4.6K −$0.49/SF
EGI
$170.5K $18.47/SF
− OpEx
−$42.6K −$4.62/SF
NOI
$127.9K $13.85/SF
Area
Otsego County, NY
Vacancy
2.60%
Lease Rate
$18.96 /SF/Yr
Expense Ratio
25.00%
Simulate Cap Rate and NOI
Suggested Prices Based on Cap Rates
Cap Rate 5%
$2,557,860
Cap Rate 7%
$1,827,043
Cap Rate 9%
$1,421,033
Alternative Uses
Best Use
Specialty Retail
$1.83M
$1.60M – $2.13M
NOI $127,893 @ 7.0% cap · market cap 6.73%
Second Best
Office B
$1.67M
$1.46M – $1.94M
NOI $116,681 @ 7.0% cap · market cap 6.14%
Theoretical Best
Office A
$2.55M
$2.23M – $2.97M
NOI $178,179 @ 7.0% cap · market cap 9.38%
Zoning and permitted uses should be independently verified with authorities.
How Realmo checks its estimates
Property Analytics
Unlock full access to Insights
Subscribe to Realmo Intelligence
Open Analytics
Current Use
Lease Details
Yes
Highway access
Yes
Utilities to site
Location Intelligence
Trade Area within ½ mile
216
Businesses Nearby
Under-served
Demand for This Use
Explore this area
Business Placement
Demographics for 13820, NY
21,605
Population
10,083
Households
2.1
Avg Household Size
30
Median Age
40%
College-Educated
91%
High-School Grad
107.3 sq mi
ZIP Area
201
Density / Sq Mi
$66,217
Median Household Income
$26,154
Median Earnings
$983
Median Rent
$176,300
Median Home Value
Check the figures for this property
Cap Rate, Value Estimation, Potential NOI and more
View Realmo Analytics
Market
Vacancy Rate% for Office in Northeast region






Frequently Asked Questions
What type of property is this?
Conventional restaurant - Restaurant property with adjacent office, residential, and commercial buildings across a multi-parcel site.
Where is this conventional restaurant located?
The property is located at 18-28 Oneida St Oneonta, NY.
What is the asking price?
The asking price for this property is $1,900,000.
What are key features of this property?
This property features: 4,000‑square‑foot restaurant building conveys fully equipped; 2.13 acres across four tax parcels; Includes 1,792‑square‑foot office building and 1,008‑square‑foot commercial building


