Restaurant with Commercial
For Sale
$1,900,000
337 Chestnut St, Oneonta, NY 13820
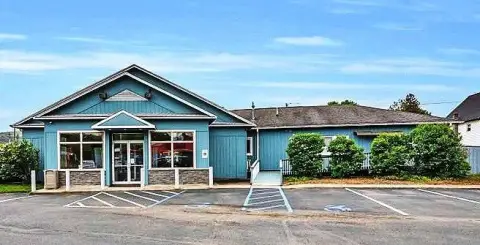
Full-service restaurant and bar with separate dining areas, extensive equipment, and space for a substantial guest capacity.
Property Size5,355 SF
Price / SF$354.81
Days on Market52
Property Features for 337 Chestnut St
General Information
Standard status
Active
Size
5,355 SF
Total Parking Spaces
80
Restaurant
Seating Capacity
204
Commercial Hood
Yes
Equipment Included
Yes
Additional Details
Furnished
Yes
Business Included
Yes
Utilities to Site
Yes
Amenities
gas fireplace
custom wooden partitions
POS terminals
stereo/speaker system
security system
storage buildings
municipal water and sewer
natural gas
three-phase electric
rooftop HVAC units
Building Details
Year Built
1977
Listing Agency:
Keller Williams Upstate NY Properties
Listed By:
David C. Brower · License #40BR1082970
(607) 435-4800
Source:
Skinnercnyrealty
Added: Aug 25
Changed: Oct 3
Last Checked: Oct 7 at 3:01PM
Displayed information is deemed reliable but is not guaranteed and should be independently verified. All listing content including descriptions, pricing, images are the copyrighted material of Keller Williams Upstate NY Properties
Investment Insights
Based on property information with market context.
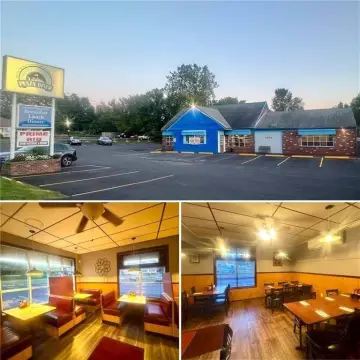
This restaurant and bar at 337 Chestnut St in Oneonta includes approximately 5,400 square feet, separate main dining and bar areas, and seating for 204 guests. The interior features a double-sided gas fireplace with custom stonework, wooden partitions, four Soft Touch POS terminals, and a stereo and speaker system. Paved parking accommodates approximately 80 vehicles, while two 10' x 16' storage buildings provide additional support space.
The commercial kitchen is equipped for high-volume food service with an 8'x30' walk-in cooler, 7'x13' walk-in freezer, commercial cooking lines, electric smokers, refrigeration, ice production, exhaust hoods, and fire suppression systems. The bar includes an eight-tap Micro-Matic kegerator, an eight-foot three-door beer cooler, mug chiller, televisions, monitors, and sound equipment. Building infrastructure includes municipal water and sewer, natural gas, three-phase electric, two rooftop Ruud HVAC units, and a 14-camera security system.
The property is located in Oneonta's West End, less than two miles from the Cooperstown All Star Village campus. The sale includes furnishings, kitchen smallwares, dishware, glassware, silverware, repair parts, accessories, and other restaurant inventory.
The commercial kitchen is equipped for high-volume food service with an 8'x30' walk-in cooler, 7'x13' walk-in freezer, commercial cooking lines, electric smokers, refrigeration, ice production, exhaust hoods, and fire suppression systems. The bar includes an eight-tap Micro-Matic kegerator, an eight-foot three-door beer cooler, mug chiller, televisions, monitors, and sound equipment. Building infrastructure includes municipal water and sewer, natural gas, three-phase electric, two rooftop Ruud HVAC units, and a 14-camera security system.
The property is located in Oneonta's West End, less than two miles from the Cooperstown All Star Village campus. The sale includes furnishings, kitchen smallwares, dishware, glassware, silverware, repair parts, accessories, and other restaurant inventory.
Key Highlights
- Approximately 5,400‑square‑foot restaurant with seating for 204 guests
- Separate bar and main dining areas with a double‑sided gas fireplace and custom stonework
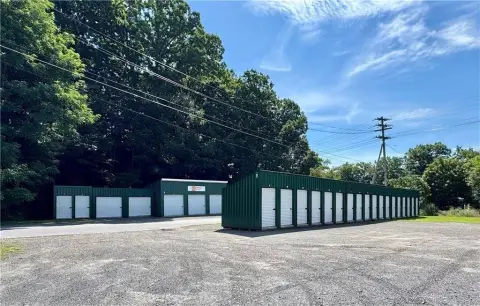
- Paved parking for approximately 80 vehicles plus two 10' x 16' storage buildings
Financial Insights
Estimated NOI and Cap Rate
NOI / Yr
$74,168
Cap Rate
3.90%
Suggested Prices Based on Cap Rates
Cap Rate 5%
$1,483,360
$1.5M
Cap Rate 7%
$1,059,543
$1.1M
Cap Rate 9%
$824,089
$824.1K
Market Conditions
NOI Build-Up for 5,355 SF
Gross rent
$101.5K $18.96/SF
− Vacancy
−$2.6K −$0.49/SF
EGI
$98.9K $18.47/SF
− OpEx
−$24.7K −$4.62/SF
NOI
$74.2K $13.85/SF
Area
Otsego County, NY
Vacancy
2.60%
Lease Rate
$18.96 /SF/Yr
Expense Ratio
25.00%
Simulate Cap Rate and NOI
Suggested Prices Based on Cap Rates
Cap Rate 5%
$1,483,360
Cap Rate 7%
$1,059,543
Cap Rate 9%
$824,089
Alternative Uses
Best Use
Specialty Retail
$1.06M
$927.1K – $1.24M
NOI $74,168 @ 7.0% cap · market cap 3.90%
Second Best
—
—
no second resolved use
Theoretical Best
Office A
$1.48M
$1.29M – $1.72M
NOI $103,330 @ 7.0% cap · market cap 5.44%
Zoning and permitted uses should be independently verified with authorities.
How Realmo checks its estimates
Property Analytics
Unlock full access to Insights
Subscribe to Realmo Intelligence
Open Analytics
Current Use
Lease Details
Turnkey business
Opportunity
Yes
Utilities to site
Yes
Commercial hood
Location Intelligence
Trade Area within ½ mile
315
Businesses Nearby
18k
Monthly Visits Nearby
Under-served
Demand for This Use
Explore this area
Business Placement
Foot Traffic Nearby
Dining 56%
Shops & Services 44%
Dunkin' Donuts
Dining
10,064 visits/mo
0.5 miles
Speedway
Shops & Services
6,832 visits/mo
0.5 miles
Napa Auto Parts
Shops & Services
1,225 visits/mo
0.5 miles
Dairy Queen
Dining
216 visits/mo
0.4 miles
Demographics for 13820, NY
21,605
Population
10,083
Households
2.1
Avg Household Size
30
Median Age
40%
College-Educated
91%
High-School Grad
107.3 sq mi
ZIP Area
201
Density / Sq Mi
$66,217
Median Household Income
$26,154
Median Earnings
$983
Median Rent
$176,300
Median Home Value
Check the figures for this property
Cap Rate, Value Estimation, Potential NOI and more
View Realmo Analytics
Market
Vacancy Rate% for Retail in Northeast region

Questions? Ask Rey
Realmo’s AI knows this listing — price, zoning, demand, history. Ask anything.





Frequently Asked Questions
What type of property is this?
Conventional restaurant - Full-service restaurant and bar with separate dining areas, extensive equipment, and space for a substantial guest capacity.
Where is this conventional restaurant located?
The property is located at 337 Chestnut St Oneonta, NY.
What is the asking price?
The asking price for this property is $1,900,000.
What are key features of this property?
This property features: Approximately 5,400‑square‑foot restaurant with seating for 204 guests; Separate bar and main dining areas with a double‑sided gas fireplace and custom stonework; Paved parking for approximately 80 vehicles plus two 10' x 16' storage buildings


