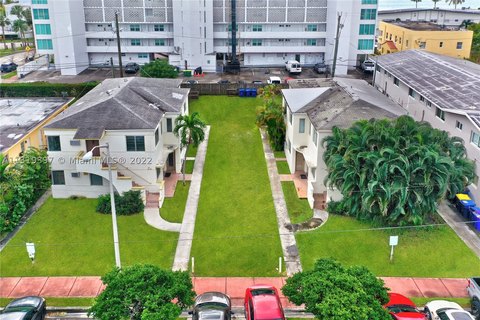
Renovated Fourplex in Miami
For Sale
$1,430,000
1784 Marseille Drive, Miami Beach, FL 33141
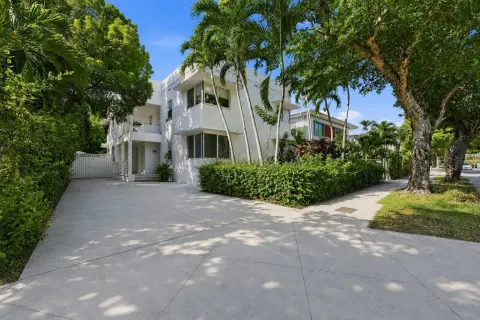
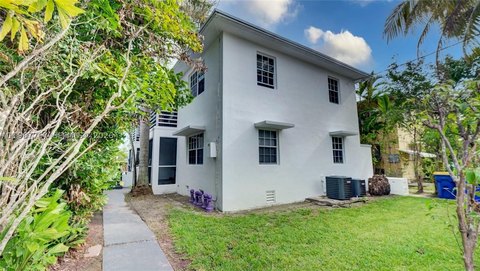
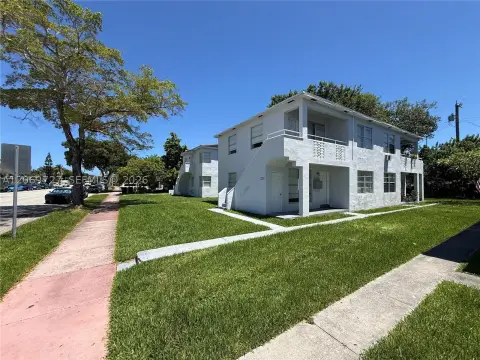
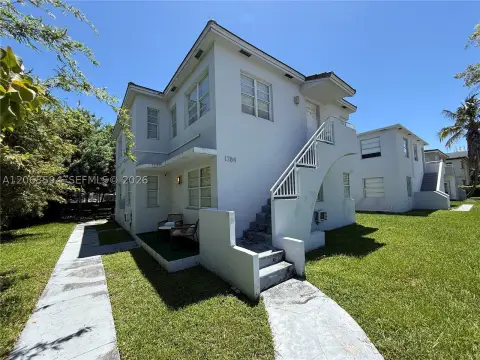
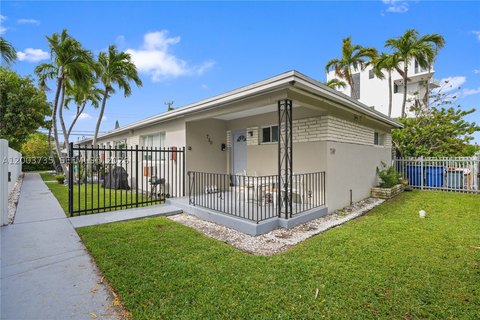
Recently renovated fourplex in prime Miami Beach location.
Property Size3,784 SF
Days on Market406
Property Features for 1784 Marseille Drive
General Information
Standard status
Active
Size
3,784 SF
Property subtype
Quadruplex
Taxes and HOA fees
Annual Taxes
$16,292
Building Details
Building Size
3,784 SF
Year Built
1945
Listing Agency:
The Brokerage South Florida Real Estate, LLC.
Listed By:
Eli Jacoby · License #3570436
(440) 622-9740
Source:
Silverleafrealtygroup
Added: Sep 4, 2025
Changed: Oct 8
Last Checked: Oct 13 at 3:00AM
Displayed information is deemed reliable but is not guaranteed and should be independently verified. All listing content including descriptions, pricing, images are the copyrighted material of The Brokerage South Florida Real Estate, LLC.
Investment Insights
Based on property information with market context.
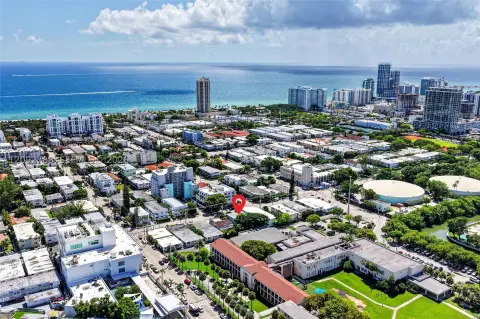
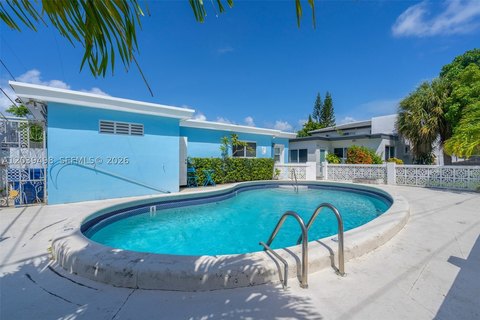
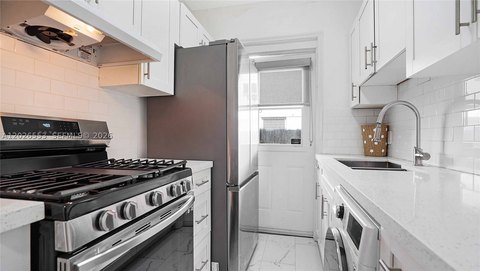
This fourplex is located in Miami Beach, specifically on Normandy Isle. The property has been recently renovated, featuring a new roof, central A/C, updated flooring in every unit, and fresh paint throughout. Situated in a waterfront community near Biscayne Bay, the property is located minutes from the beach, Bal Harbour, and Downtown Miami. The surrounding neighborhood is walkable and offers cafes, shops, and local conveniences. Residents have easy access to the Normandy Shores Golf Club, tennis courts, and parks. The Isle of Normandy is noted for its historic charm and strong rental demand.
Key Highlights
- Prime Miami Beach location on desirable Normandy Isle.
- Recently renovated with new roof, central A/C, updated flooring, and fresh paint.
- True fourplex offering strong investment potential.
Financial Insights
Estimated NOI and Cap Rate
NOI / Yr
$63,079
Cap Rate
4.41%
Suggested Prices Based on Cap Rates
Cap Rate 5%
$1,261,580
$1.3M
Cap Rate 7%
$901,129
$901.1K
Cap Rate 9%
$700,878
$700.9K
Market Conditions
NOI Build-Up for 3,784 SF
Gross rent
$95.4K $25.20/SF
− Vacancy
−$5.2K −$1.39/SF
EGI
$90.1K $23.81/SF
− OpEx
−$27.0K −$7.14/SF
NOI
$63.1K $16.67/SF
Area
Miami-Dade County, FL
Vacancy
5.50%
Lease Rate
$25.20 /SF/Yr
Expense Ratio
30.00%
Simulate Cap Rate and NOI
Suggested Prices Based on Cap Rates
Cap Rate 5%
$1,261,580
Cap Rate 7%
$901,129
Cap Rate 9%
$700,878
Alternative Uses
Best Use
Multifamily LT 5
$901.1K
$788.5K – $1.05M
NOI $63,079 @ 7.0% cap · market cap 4.41%
Second Best
Apartment 5plus
$831.4K
$727.4K – $969.9K
NOI $58,195 @ 7.0% cap · market cap 4.07%
Theoretical Best
Office A
$1.92M
$1.68M – $2.24M
NOI $134,385 @ 7.0% cap · market cap 9.40%
Zoning and permitted uses should be independently verified with authorities.
How Realmo checks its estimates
Property Analytics
Unlock full access to Insights
Subscribe to Realmo Intelligence
Open Analytics
Current Use
Location Intelligence
Trade Area within ½ mile
1,156
Businesses Nearby
Explore this area
Business Placement
Demographics for 33141, FL
35,995
Population
21,793
Households
1.7
Avg Household Size
44
Median Age
44%
College-Educated
91%
High-School Grad
2.3 sq mi
ZIP Area
15,650
Density / Sq Mi
$64,457
Median Household Income
$36,899
Median Earnings
$1,739
Median Rent
$434,500
Median Home Value
Check the figures for this property
Cap Rate, Value Estimation, Potential NOI and more
View Realmo Analytics
Market
Vacancy Rate% for Multifamily in South region

Questions? Ask Rey
Realmo’s AI knows this listing — price, zoning, demand, history. Ask anything.



Frequently Asked Questions
What type of property is this?
Quadplex - Recently renovated fourplex in prime Miami Beach location.
Where is this quadplex located?
The property is located at 1784 Marseille Drive Miami Beach, FL.
What is the asking price?
The asking price for this property is $1,430,000.
What are key features of this property?
This property features: Prime Miami Beach location on desirable Normandy Isle.; Recently renovated with **new roof, central A/C, updated flooring, and fresh paint.**; True fourplex offering strong investment potential.


