Turnkey Retail and Office
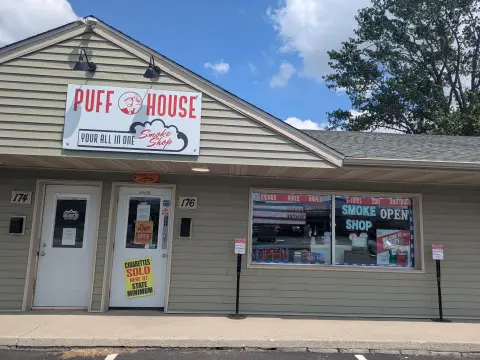
176 Deanna Drive Lowell, IN 46356
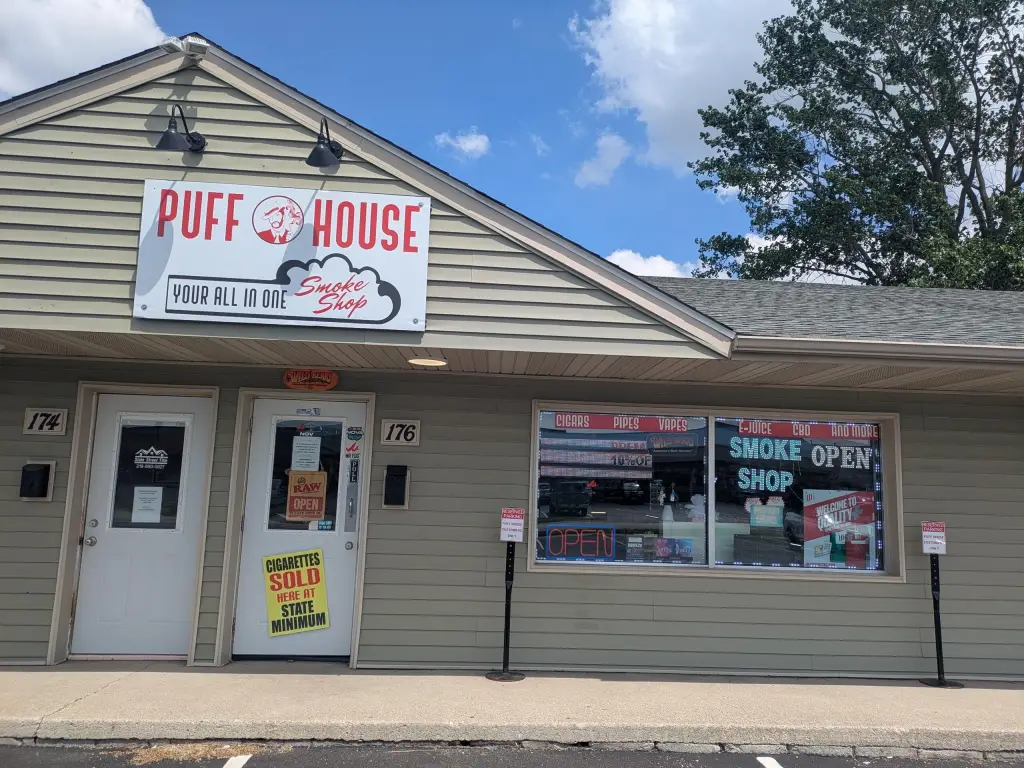
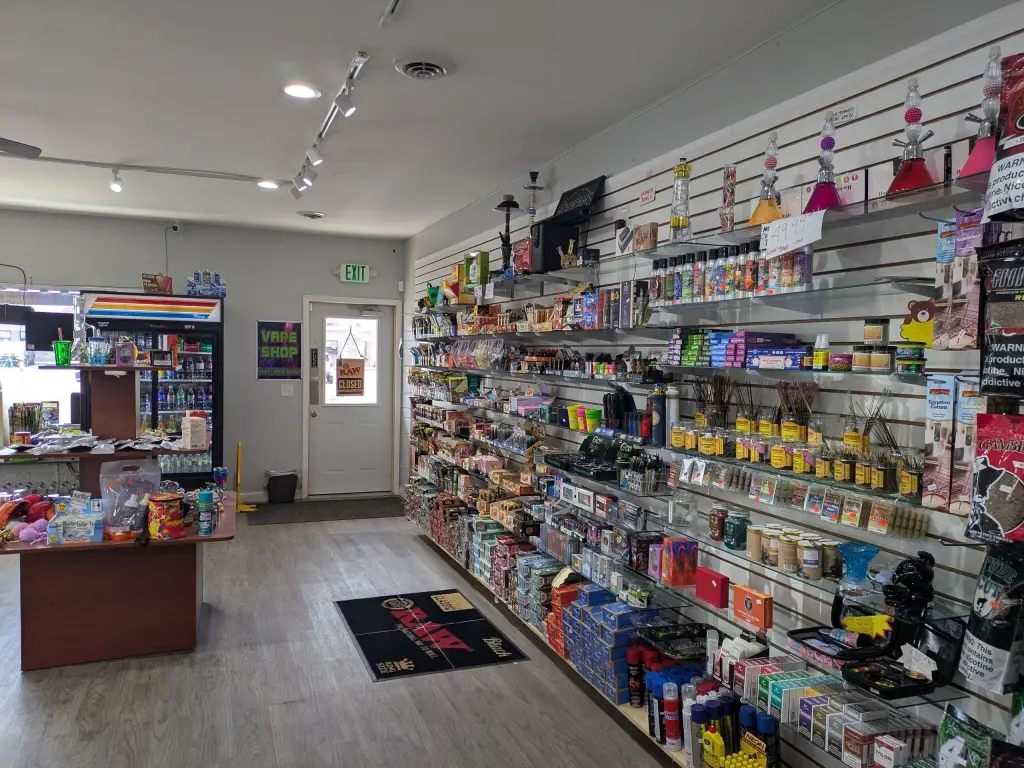
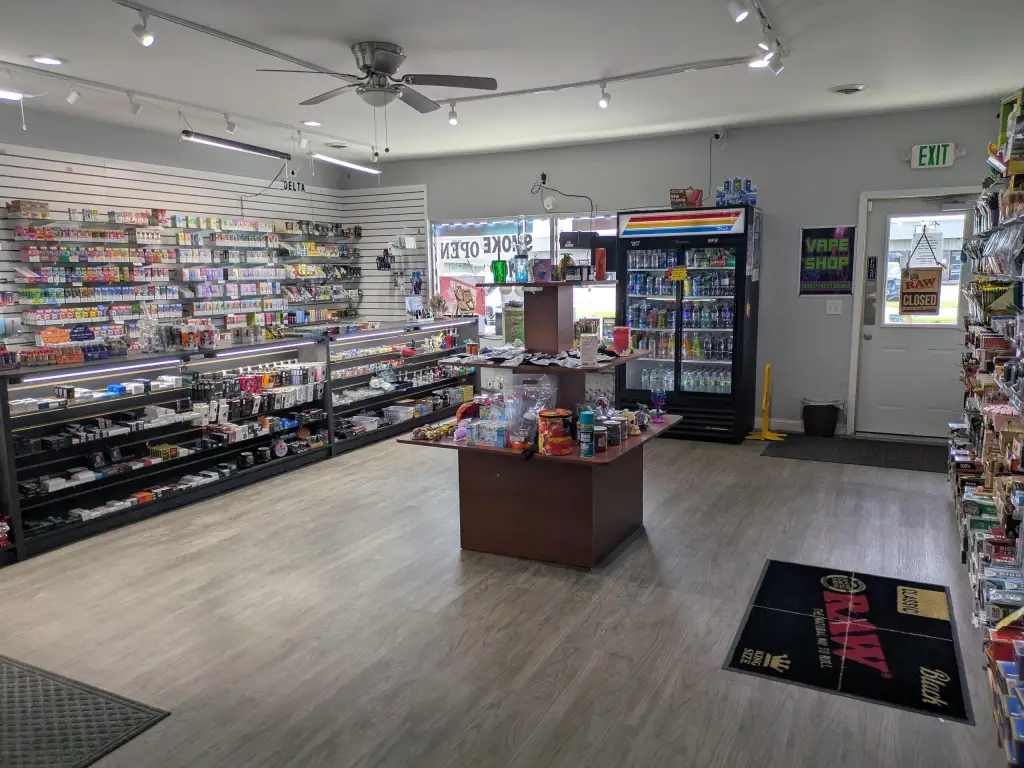
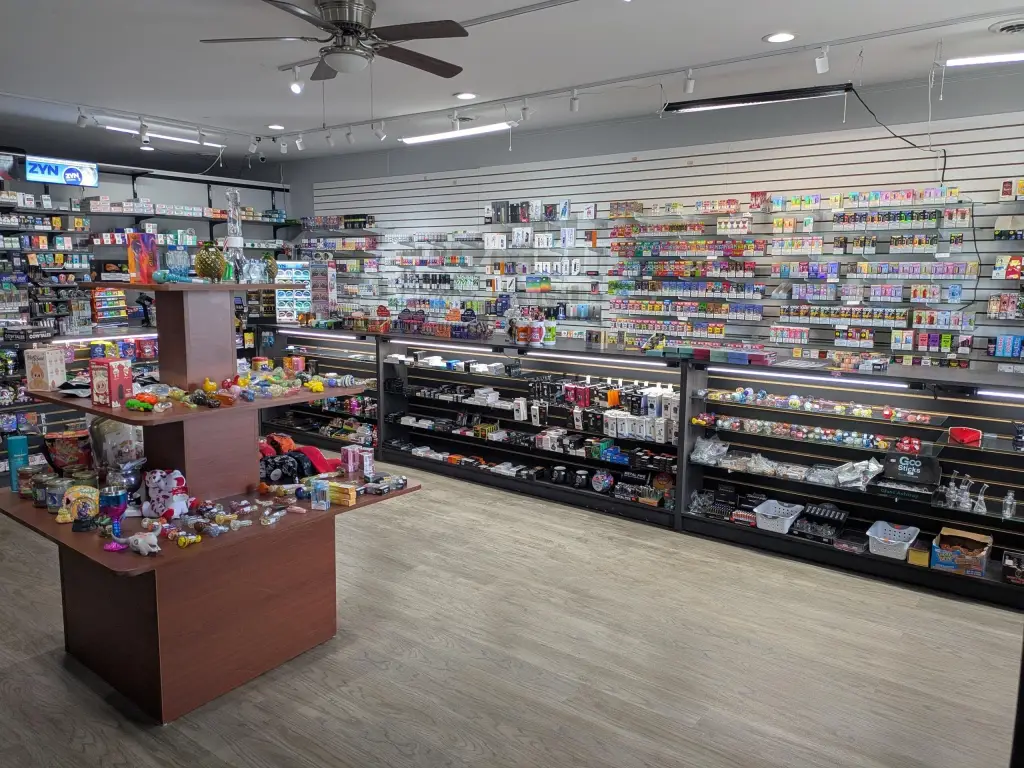
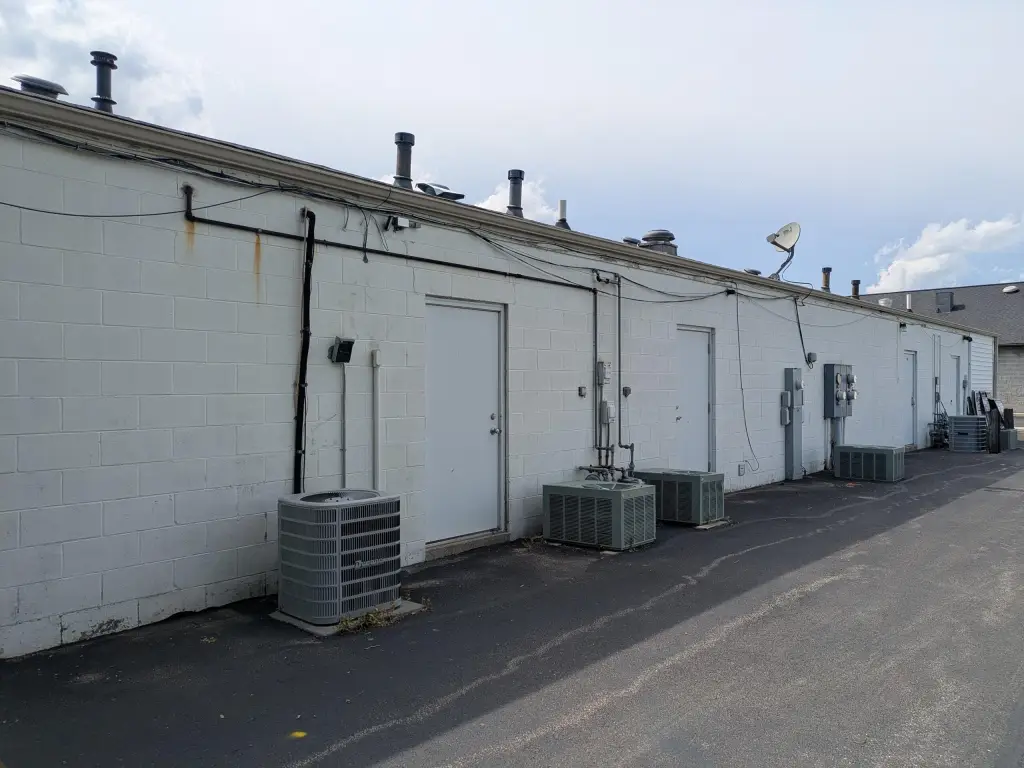
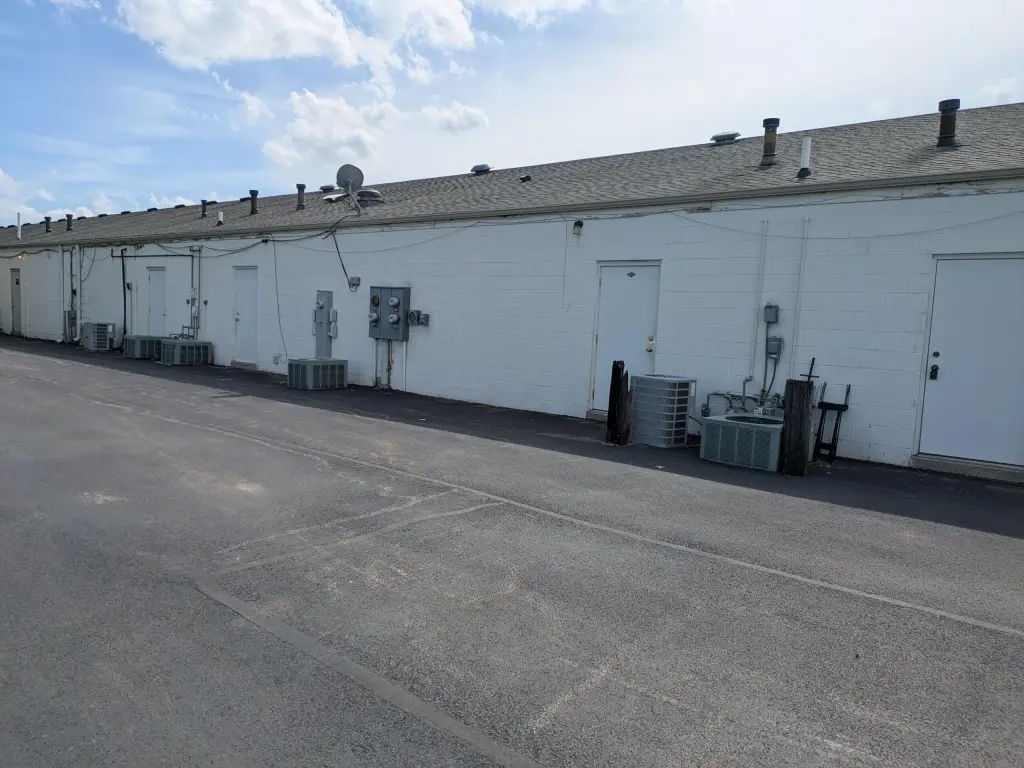
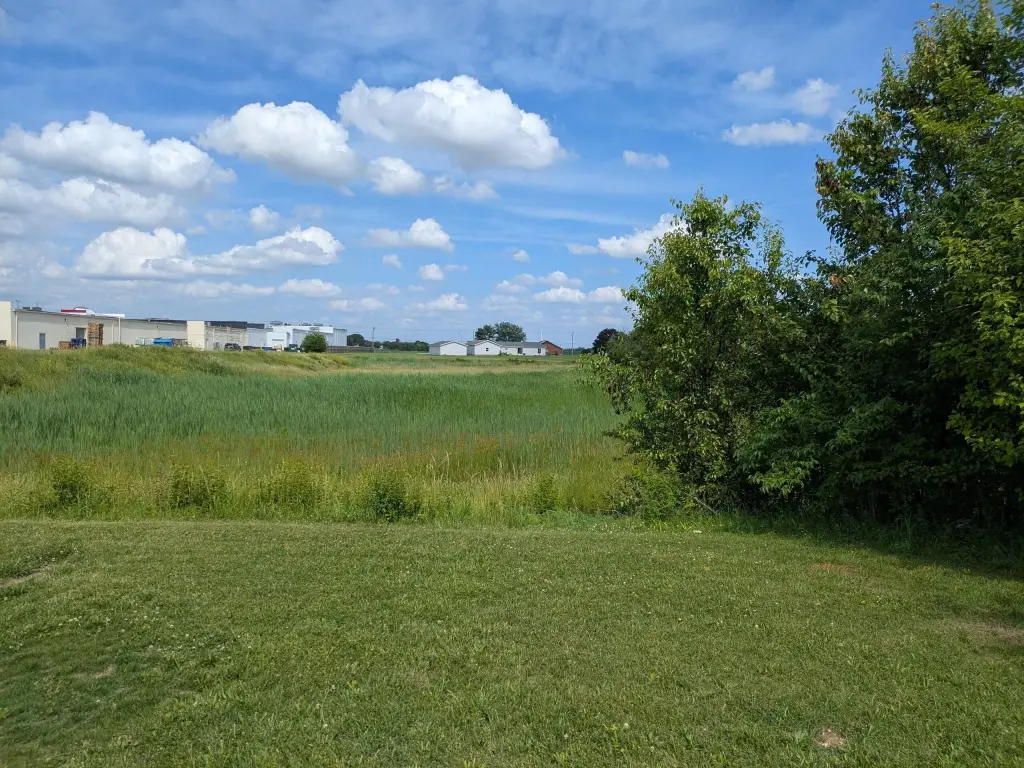
For Sale
$249,975
SINGLE_FAMILY - Lowell, IN
Property Size1,023 SF
Lot Size0.07 Acres
Price / SF$244.35
Days on Market49
Property Features for 176 Deanna Drive
General Information
Property type
Residential
Property subtype
Retail
Parking
24
Parking features
Off Street
Interior features
Ceiling Fan(s), Vaulted Ceiling(s), Open Floorplan
Exterior features
Lighting, Rain Gutters
Standard status
Active
APN
451925227018000008
Size
1,023 SF
Lot size
0.07 Acres
Taxes and HOA fees
Tax Year
2025
Tax Description
HOFFMAN MANOR S.20.66FT OF LOT 6
Tax Annual Amount
1283
Utilities
Utilities
Cable Available
Sewer type
Public Sewer
Heating system
Forced Air
Water source
Public
Building Details
Year built
1978
Listing Agency:
SCHUPP Real Estate
(219) 696-3596
Listed By:
John Schupp · License #RB14033846
(219) 775-2373
Added: Jun 10
Changed: Jul 20
Last Checked: Jul 28 at 1:06PM
MLS# 840444
Copyright © 2026 Greater Northwest Indiana Association of REALTORS. All rights reserved. All information provided by the listing agent/broker is deemed reliable but is not guaranteed and should be independently verified.
Investment Insights
Based on property information with market context.
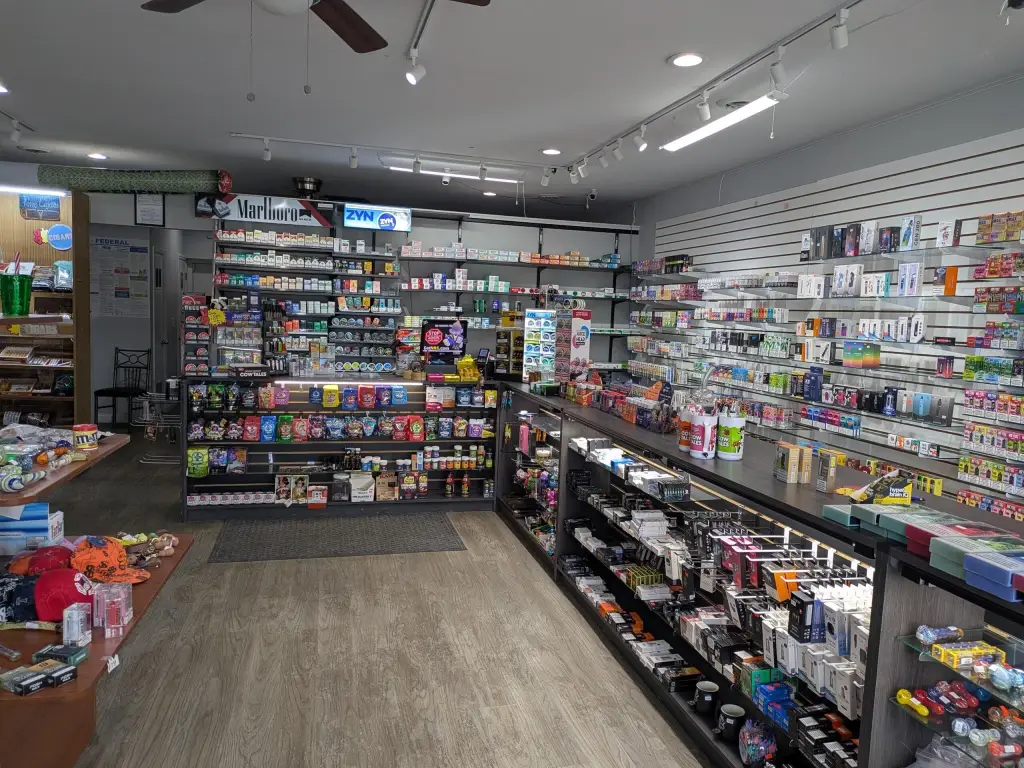
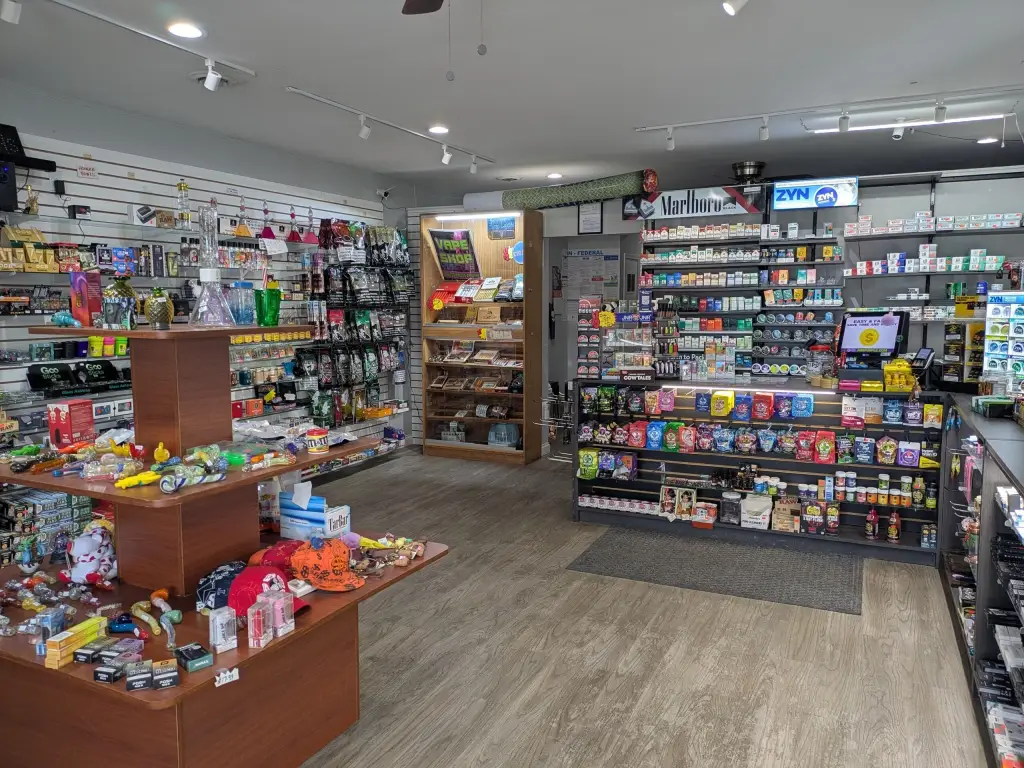
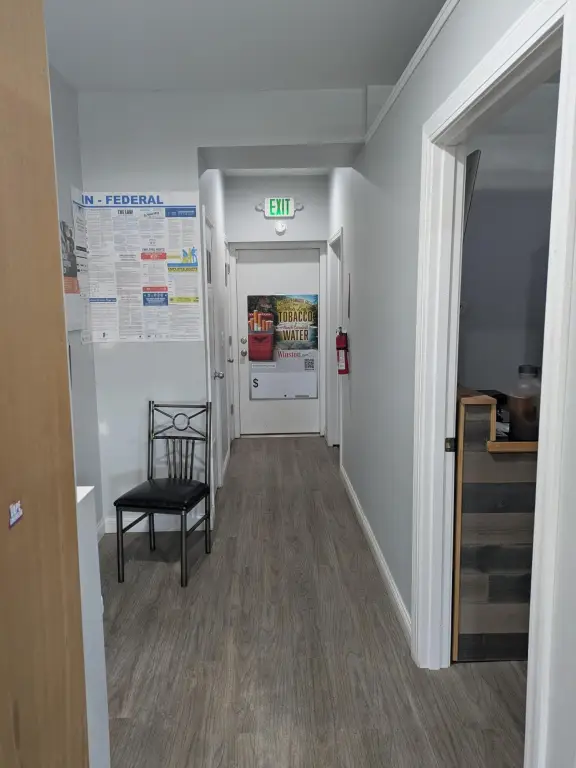
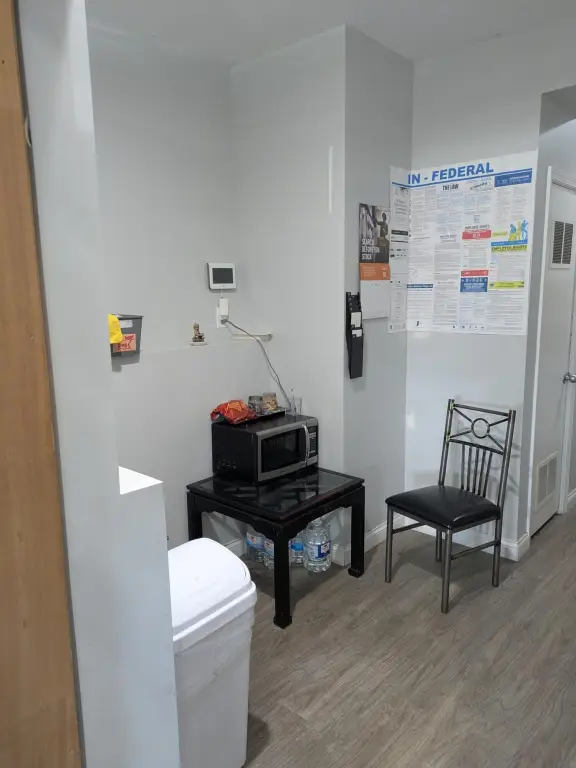
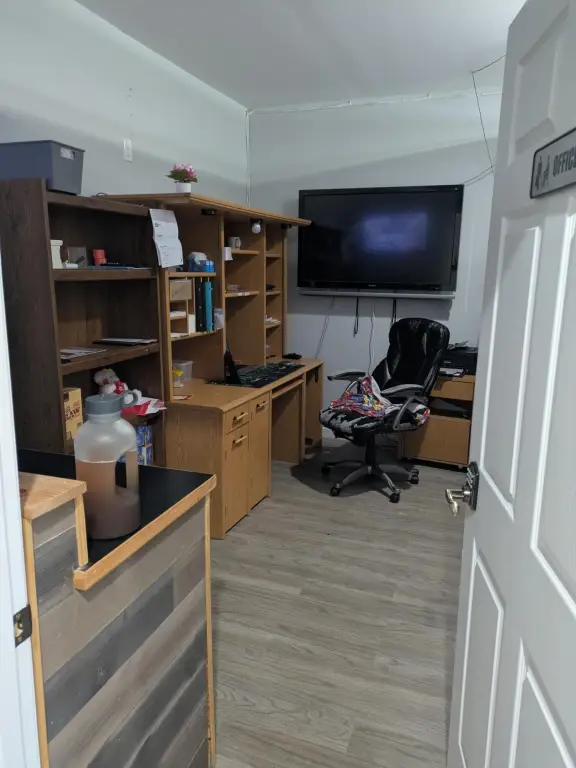
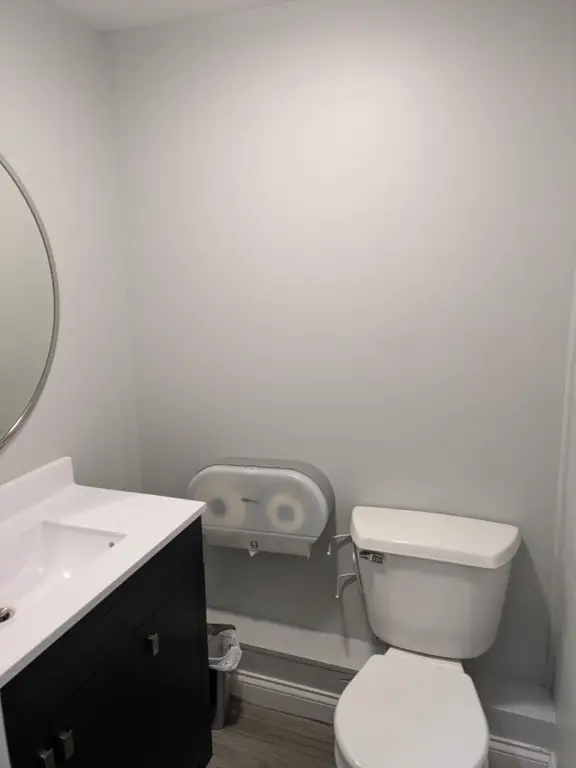
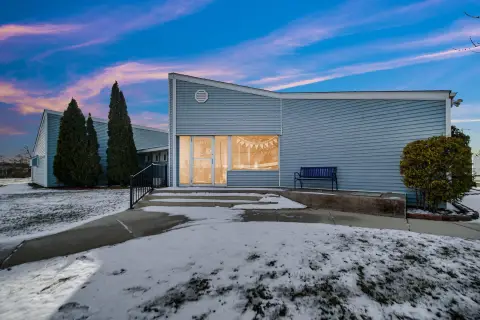
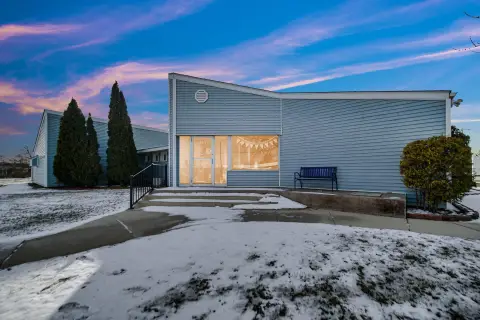
This fully remodeled 1,023 sq ft turnkey retail storefront or professional office is designed around an open-concept layout. The 2022 improvements include plug-and-play modular track lighting, interior LED recessed lighting, and built-in slat walls. Rear shelving is included, and select display items such as display cases, a refrigerated cooler, and track downlight kits are available for lease or purchase. The unit also offers private rear storage, a restroom, laundry facilities, and independent rear access.
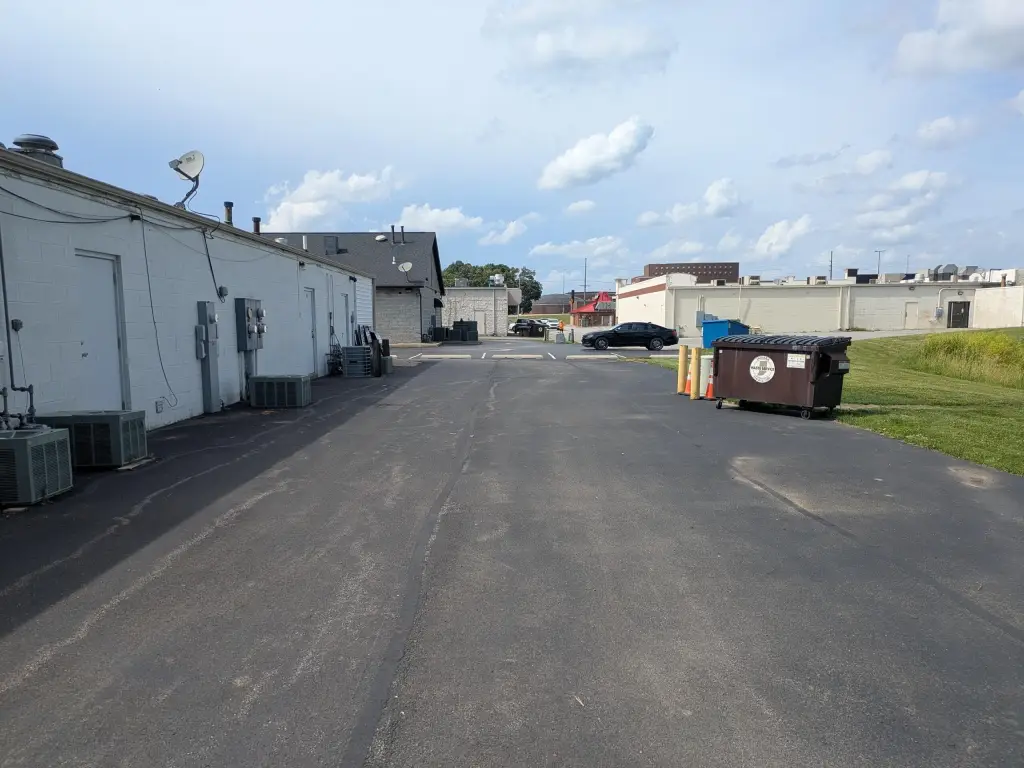
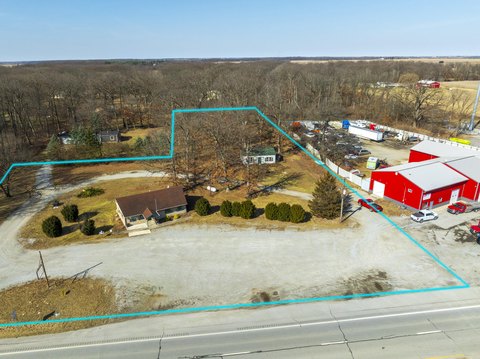
Located on East Commercial Avenue in Lowell, Indiana, the property sits between the high school and Lowell Plaza shopping hub along a high-growth commercial corridor. Vehicular traffic is described as averaging 15,000 to 18,702 vehicles per day, and the shared common-lot right-of-way provides deeded access across units 170-176, with ample paved parking.
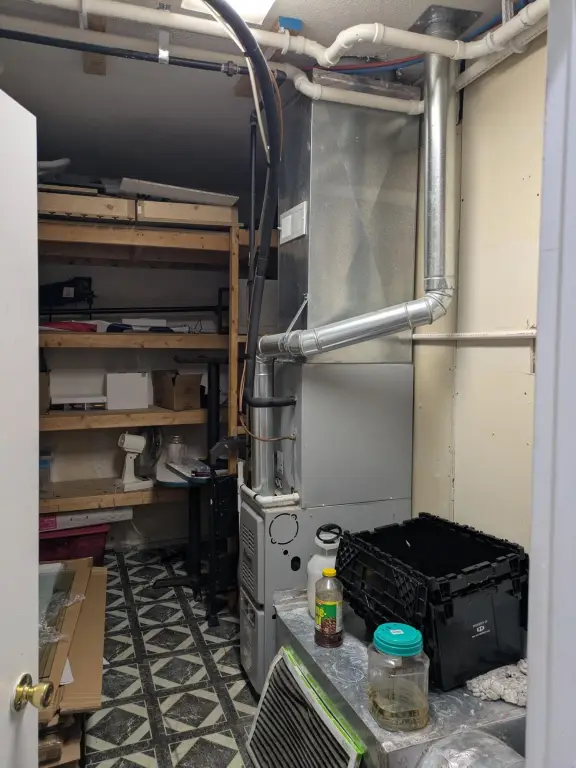
The exterior has been refreshed with maintenance-free siding and soffits, and the property is reported to include a brand new furnace, central A/C, and roof. Tenants have independent utility meters. NIPSCO gas/electric averages $185 per month, with base water of $36 and base sewer of $67, plus a quarter-share dumpster fee of $23 and seasonal snow removal. A survey is available.
Located on East Commercial Avenue in Lowell, Indiana, the property sits between the high school and Lowell Plaza shopping hub along a high-growth commercial corridor. Vehicular traffic is described as averaging 15,000 to 18,702 vehicles per day, and the shared common-lot right-of-way provides deeded access across units 170-176, with ample paved parking.
The exterior has been refreshed with maintenance-free siding and soffits, and the property is reported to include a brand new furnace, central A/C, and roof. Tenants have independent utility meters. NIPSCO gas/electric averages $185 per month, with base water of $36 and base sewer of $67, plus a quarter-share dumpster fee of $23 and seasonal snow removal. A survey is available.
Key Highlights
- Fully remodeled 1,023 SF retail storefront or professional office on East Commercial Avenue
- Open floorplan with vaulted ceilings and ceiling fans; forced‑air heating with cable available
- 2022 interior lighting upgrades include modular track lighting and LED recessed lighting; built‑in slat walls included
Financial Insights For Office B
Simulate Cap Rate and NOI
NOI Build-Up
- Vacancy
- income lost from leasable area expected to sit empty during the year — subtracted from gross rent.
- EGI (Effective Gross Income)
- gross rent minus vacancy losses — the realistic income before paying operating costs.
- OpEx (Operating Expenses)
- recurring costs to operate the property (property tax, insurance, utilities, maintenance, management) — excludes financing and capital improvements.
- NOI (Net Operating Income)
- income a property generates after operating costs but before financing and taxes.
| Component | $ | $/SF |
|---|---|---|
| Gross rent | $22.1k | $21.60 |
| − Vacancy | −$4.8k | −$4.69 |
| EGI | $17.3k | $16.91 |
| − OpEx | −$4.3k | −$4.23 |
| NOI | $13.0k | $12.68 |
1,023 SF · lease $21.60/SF/yr · vacancy 21.70% · expense 25.00%
Alternative Uses
Best Use
Office B
$185.4K
$162.2K – $216.3K
NOI $12,976 @ 7.0% cap · market cap 5.19%
Second Best
Retail
$140.8K
$123.2K – $164.3K
NOI $9,858 @ 7.0% cap · market cap 3.94%
Theoretical Best
Specialty Retail
$285.6K
$249.9K – $333.2K
NOI $19,991 @ 7.0% cap · market cap 8.00%
Zoning and permitted uses should be independently verified with authorities.
Property Analytics
Property Profile
Location Intelligence
Current Use





Frequently Asked Questions
What type of property is this?
Storefront property - Move-in-ready 1,023 sq ft storefront with open-concept interior, restroom, laundry, and private rear storage plus independent access.
Where is this storefront property located?
The property is located at 176 Deanna Drive Lowell, IN.
What is the asking price?
The asking price for this property is $249,975.
What are key features of this property?
This property features: Fully remodeled 1,023 SF retail storefront or professional office on East Commercial Avenue; Open floorplan with vaulted ceilings and ceiling fans; forced‑air heating with cable available; 2022 interior lighting upgrades include modular track lighting and LED recessed lighting; built‑in slat walls included