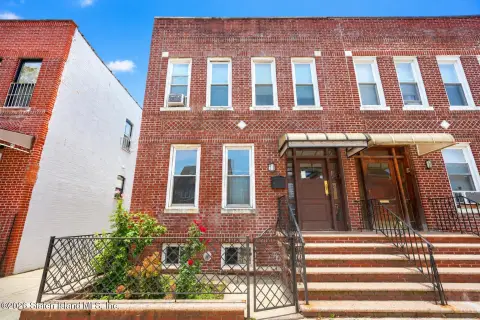
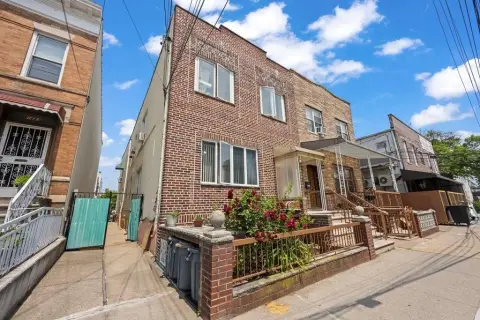
Bensonhurst Four-Family Brick
For Sale
$1,990,000
Pending
1737 71st St, Brooklyn, NY 11204
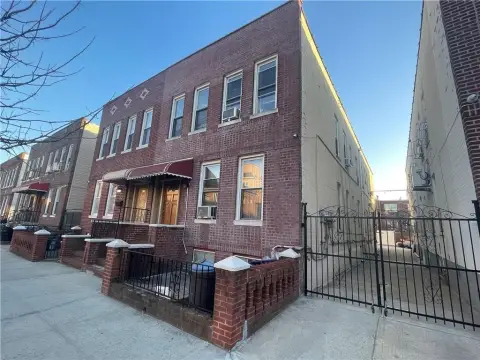
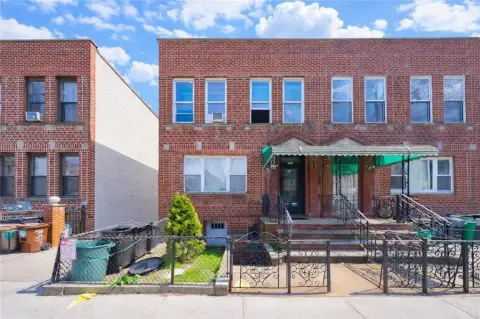
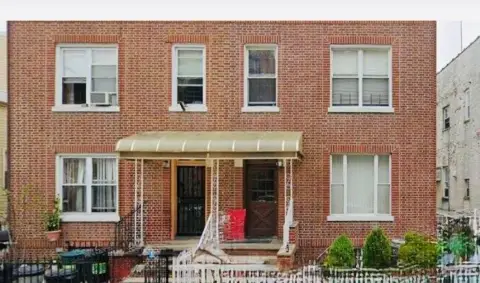
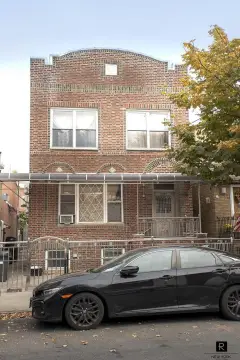
Four-family brick home in prime Bensonhurst, delivered vacant.
Property Size3,000 SF
Lot Size0.06 Acres
Days on Market209
Property Features for 1737 71st St
General Information
Standard status
Pending
Size
3,000 SF
Lot size
0.06 Acres
Property subtype
Multi Family
Taxes and HOA fees
Annual Taxes
$17,064
Building Details
Building Size
3,000 SF
Year Built
1924
Stories
2
Listing Agency:
Venezia Realty Group LLC
Listed By:
Lisa Babli
(347) 541-7253
Source:
Elliman
Added: Mar 26
Changed: Oct 12
Last Checked: Oct 19 at 8:06AM
Displayed information is deemed reliable but is not guaranteed and should be independently verified. All listing content including descriptions, pricing, images are the copyrighted material of Venezia Realty Group LLC

Ask AI about this property
Review the available facts, identify missing information and prepare questions for the agent.
Investment Insights
Based on property information with market context.
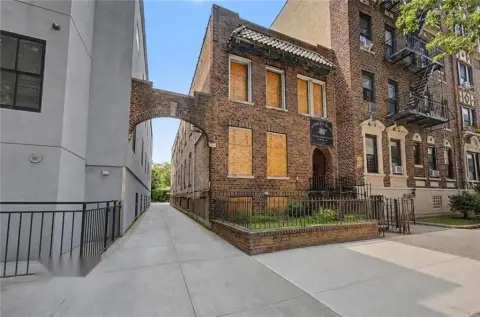
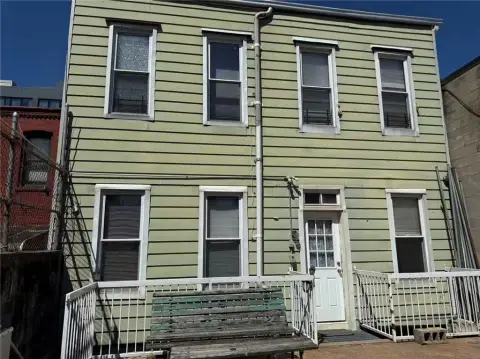
Located in Bensonhurst, this is a four-family all-brick home. The building has a size of 20 x 75 feet, offering over 3000 square feet of living space, situated on a 25 x 100 foot lot. The first floor features a large 7-room apartment, created by combining two units, with all-tile floors and custom renovations. The second floor contains two 4-room, 2-bedroom units, front and back. The property includes a full finished basement with a separate front entrance, covering the entire footprint of the home. Delivered vacant, this property presents a significant upside potential for investors or for use as a family home.
Key Highlights
- Delivered Vacant: Ready for immediate occupancy or rental.
- Large Building Size: 20 x 75 building with over 3000 sq ft of living space.
- Four‑Family All Brick Home: Offers multiple income streams or multi‑generational living.
Financial Insights
Estimated NOI and Cap Rate
NOI / Yr
$105,065
Cap Rate
5.28%
Suggested Prices Based on Cap Rates
Cap Rate 5%
$2,101,300
$2.1M
Cap Rate 7%
$1,500,929
$1.5M
Cap Rate 9%
$1,167,389
$1.2M
Market Conditions
NOI Build-Up for 3,000 SF
Gross rent
$153.0K $51.00/SF
− Vacancy
−$2.9K −$0.97/SF
EGI
$150.1K $50.03/SF
− OpEx
−$45.0K −$15.01/SF
NOI
$105.1K $35.02/SF
Area
Brooklyn, NY
Vacancy
1.90%
Lease Rate
$51.00 /SF/Yr
Expense Ratio
30.00%
Simulate Cap Rate and NOI
Suggested Prices Based on Cap Rates
Cap Rate 5%
$2,101,300
Cap Rate 7%
$1,500,929
Cap Rate 9%
$1,167,389
Alternative Uses
Best Use
Multifamily LT 5
$1.50M
$1.31M – $1.75M
NOI $105,065 @ 7.0% cap · market cap 5.28%
Second Best
Apartment 5plus
$1.31M
$1.14M – $1.53M
NOI $91,587 @ 7.0% cap · market cap 4.60%
Theoretical Best
Specialty Retail
$2.48M
$2.17M – $2.90M
NOI $173,880 @ 7.0% cap · market cap 8.74%
Zoning and permitted uses should be independently verified with authorities.
How Realmo checks its estimates
Property Analytics
Unlock full access to Insights
Subscribe to Realmo Intelligence
Open Analytics
Location Intelligence
Trade Area within ½ mile
1,239
Businesses Nearby
Explore this area
Business Placement
Demographics for 11204, NY
85,885
Population
27,498
Households
3.1
Avg Household Size
34
Median Age
30%
College-Educated
74%
High-School Grad
1.6 sq mi
ZIP Area
53,678
Density / Sq Mi
$67,588
Median Household Income
$33,461
Median Earnings
$1,751
Median Rent
$1,097,200
Median Home Value
Check the figures for this property
Cap Rate, Value Estimation, Potential NOI and more
View Realmo Analytics
Market
Vacancy Rate% for Multifamily in Northeast region

Frequently Asked Questions
What type of property is this?
Quadplex - Four-family brick home in prime Bensonhurst, delivered vacant.
Where is this quadplex located?
The property is located at 1737 71st St Brooklyn, NY.
What is the asking price?
The asking price for this property is $1,990,000.
What are key features of this property?
This property features: Delivered Vacant: Ready for immediate occupancy or rental.; Large Building Size: 20 x 75 building with over 3000 sq ft of living space.; Four‑Family All Brick Home: Offers multiple income streams or multi‑generational living.


