Mixed-Use Building with Flexible
For Sale
Contact for pricing
1736 NW 15th St, Oklahoma City, OK 73106
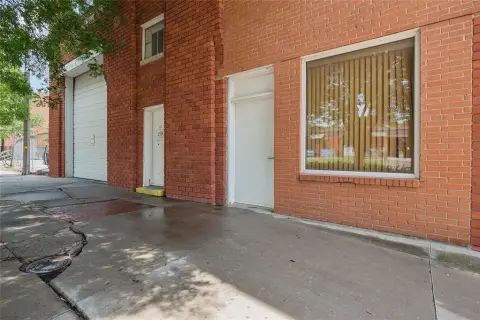
Flexible zoning supports restaurant, retail, office, creative space, and penthouse residence concepts.
Property Size7,520 SF
Price / SF$238.70
Days on Market220
Property Features for 1736 NW 15th St
General Information
Standard status
Active
Size
7,520 SF
Property subtype
OFFICE
Listing Agency:
Creek Price Edwards and Company - Oklahoma City
(405) 843-7474
Listed By:
Aden Struble · License #209339
(405) 210-3910
Source:
Moodyscre
Added: Mar 19
Changed: Oct 23
Last Checked: Oct 23 at 10:23AM
Displayed information is deemed reliable but is not guaranteed and should be independently verified. All listing content including descriptions, pricing, images are the copyrighted material of Creek Price Edwards and Company - Oklahoma City

Ask AI about this property
Review the available facts, identify missing information and prepare questions for the agent.
Investment Insights
Based on property information with market context.
This mixed-use building offers flexible zoning intended to support multiple concepts, including restaurant, retail, office, creative space, or a luxury penthouse residence. With approximately 7,520 square feet, the property is set up for a tenant or owner to align the space with a variety of allowable uses.
Located at 1736 NW 15th St in Oklahoma City, the property is described as being just steps from one of OKC’s vibrant cultural and commercial hubs within the Plaza District area. That proximity may help support both street-facing retail/restaurant activity and professional or creative office-oriented uses, depending on the final configuration.
Located at 1736 NW 15th St in Oklahoma City, the property is described as being just steps from one of OKC’s vibrant cultural and commercial hubs within the Plaza District area. That proximity may help support both street-facing retail/restaurant activity and professional or creative office-oriented uses, depending on the final configuration.
Key Highlights
- Flexible mixed‑use zoning supports restaurant, retail, office, creative space, or a luxury penthouse residence concept.
- Located just steps from one of OKC’s most vibrant cultural and commercial hubs.
Financial Insights
Estimated NOI and Cap Rate
NOI / Yr
$148,445
Cap Rate
8.27%
Suggested Prices Based on Cap Rates
Cap Rate 5%
$2,968,900
$3.0M
Cap Rate 7%
$2,120,643
$2.1M
Cap Rate 9%
$1,649,389
$1.6M
Market Conditions
NOI Build-Up for 7,520 SF
Gross rent
$225.6K $30.00/SF
− Vacancy
−$13.5K −$1.80/SF
EGI
$212.1K $28.20/SF
− OpEx
−$63.6K −$8.46/SF
NOI
$148.4K $19.74/SF
Area
Oklahoma City, OK
Vacancy
6.00%
Lease Rate
$30.00 /SF/Yr
Expense Ratio
30.00%
Simulate Cap Rate and NOI
Suggested Prices Based on Cap Rates
Cap Rate 5%
$2,968,900
Cap Rate 7%
$2,120,643
Cap Rate 9%
$1,649,389
Alternative Uses
Best Use
Retail
$2.12M
$1.86M – $2.47M
NOI $148,445 @ 7.0% cap · market cap 8.27%
Second Best
Office B
$1.53M
$1.34M – $1.78M
NOI $106,989 @ 7.0% cap · market cap 5.96%
Theoretical Best
Specialty Retail
$2.57M
$2.25M – $3.00M
NOI $180,029 @ 7.0% cap · market cap 10.03%
Zoning and permitted uses should be independently verified with authorities.
How Realmo checks its estimates
Property Analytics
Contact the owner directly
Get the owner's phone numbers and email
Open Analytics
Current Use
Location Intelligence
Trade Area within ½ mile
695
Businesses Nearby
Explore this area
Business Placement
Demographics for 73106, OK
12,956
Population
6,069
Households
2.1
Avg Household Size
32
Median Age
40%
College-Educated
85%
High-School Grad
3.0 sq mi
ZIP Area
4,319
Density / Sq Mi
$51,934
Median Household Income
$32,145
Median Earnings
$1,050
Median Rent
$262,500
Median Home Value
Check the figures for this property
Cap Rate, Value Estimation, Potential NOI and more
View Realmo Analytics
Market
Vacancy Rate% for Office in Oklahoma City, OK




Frequently Asked Questions
What type of property is this?
Office building - Flexible zoning supports restaurant, retail, office, creative space, and penthouse residence concepts.
Where is this office building located?
The property is located at 1736 NW 15th St Oklahoma City, OK.
What is the asking price?
The asking price for this property is $1,795,000.
What are key features of this property?
This property features: Flexible mixed‑use zoning supports restaurant, retail, office, creative space, or a luxury penthouse residence concept.; Located just steps from one of OKC’s most vibrant cultural and commercial hubs.


