Corner Flex Space with
For Sale
$34,000,000
17355 NW 59th Ave, Hialeah, FL 33015
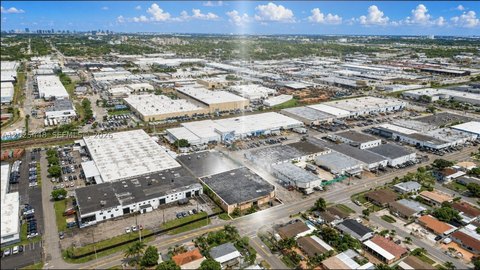
The property combines fully air-conditioned space with renovated offices and storage for flexible commercial use.
Property Size98,357 SF
Lot Size7.45 Acres
Price / SF$346.94
Days on Market700
Property Features for 17355 NW 59th Ave
General Information
Standard status
Active
Size
98,357 SF
Total Parking Spaces
410
Lot size
7.45 Acres
Property subtype
Retail
Site & Location
Corner Location
Yes
Road Access
Yes
Warehouse & Industrial
Clear Height
32 ft
Conditioned Warehouse
Yes
Taxes and HOA fees
Annual Taxes
$158,836
Amenities
elevator
grease trap
Building Details
Building Size
98,357 SF
Year Built
2000
Listing Agency:
Primetime Realty Group, Inc.
Listed By:
Juan Huice · License #3088139
(305) 512-0532
Source:
Vanessafrankmiami
Added: Nov 20, 2024
Changed: Oct 19
Last Checked: Oct 21 at 6:12AM
Displayed information is deemed reliable but is not guaranteed and should be independently verified. All listing content including descriptions, pricing, images are the copyrighted material of Primetime Realty Group, Inc.

Ask AI about this property
Review the available facts, identify missing information and prepare questions for the agent.
Investment Insights
Based on property information with market context.
This flex property is positioned on a 7.45-acre corner site and includes fully air-conditioned interior space, 32-foot ceilings, LED lighting, modern electrical systems, an elevator, and more than 12,000 square feet of renovated offices and storage. Additional improvements include a grease trap and high-volume water allocation, supporting the property’s stated retail, industrial, showroom, warehouse, and specialty-use capabilities.
The address is next to Walmart, Lowe’s, and BJ’s Wholesale Club in the Miami Lakes/Hialeah area. The site includes more than 410 parking spaces and is situated within a growing retail corridor described as high traffic. Built in 2000, the property combines substantial commercial improvements with a prominent corner-site configuration.
The address is next to Walmart, Lowe’s, and BJ’s Wholesale Club in the Miami Lakes/Hialeah area. The site includes more than 410 parking spaces and is situated within a growing retail corridor described as high traffic. Built in 2000, the property combines substantial commercial improvements with a prominent corner-site configuration.
Key Highlights
- 7.45‑acre corner site in Hialeah, FL
- 32‑foot ceilings with fully air‑conditioned space
- More than 410 parking spaces
Financial Insights
Estimated NOI and Cap Rate
NOI / Yr
$1,704,024
Cap Rate
5.01%
Suggested Prices Based on Cap Rates
Cap Rate 5%
$34,080,480
$34.1M
Cap Rate 7%
$24,343,200
$24.3M
Cap Rate 9%
$18,933,600
$18.9M
Market Conditions
NOI Build-Up for 98,000 SF
Gross rent
$2.65M $27.00/SF
− Vacancy
−$211.7K −$2.16/SF
EGI
$2.43M $24.84/SF
− OpEx
−$730.3K −$7.45/SF
NOI
$1.70M $17.39/SF
Area
Hialeah, FL
Vacancy
8.00%
Lease Rate
$27.00 /SF/Yr
Expense Ratio
30.00%
Simulate Cap Rate and NOI
Suggested Prices Based on Cap Rates
Cap Rate 5%
$34,080,480
Cap Rate 7%
$24,343,200
Cap Rate 9%
$18,933,600
Alternative Uses
Best Use
Retail
$24.34M
$21.30M – $28.40M
NOI $1,704,024 @ 7.0% cap · market cap 5.01%
Second Best
Flex RnD
$21.10M
$18.46M – $24.61M
NOI $1,476,821 @ 7.0% cap · market cap 4.34%
Theoretical Best
Office A
$38.57M
$33.75M – $45.00M
NOI $2,700,096 @ 7.0% cap · market cap 7.94%
Zoning and permitted uses should be independently verified with authorities.
How Realmo checks its estimates
Property Analytics
Who owns this building?
See the owner, sales and loan history
Open Analytics
Current Use
Lease Details
32 ft
Clear height
Yes
Paved road access
Location Intelligence
Trade Area within ½ mile
1,600
Businesses Nearby
Under-served
Demand for This Use
Explore this area
Business Placement
Demographics for 33015, FL
65,645
Population
23,963
Households
2.7
Avg Household Size
39
Median Age
31%
College-Educated
88%
High-School Grad
5.9 sq mi
ZIP Area
11,126
Density / Sq Mi
$73,609
Median Household Income
$37,274
Median Earnings
$1,841
Median Rent
$384,000
Median Home Value
Check the figures for this property
Cap Rate, Value Estimation, Potential NOI and more
View Realmo Analytics
Market
Vacancy Rate% for Industrial in South region




Similar Off Market Nearby
- CJs Catering — 5190 NW 167th St, Miami Gardens, FL 33014
- Melians Enterprises — 6157 NW 167th St STE F27, Hialeah, FL 33015
- Mary & Mo Catering — 6643 NW 174th Ln, Hialeah, FL 33015
- Crazy 4 Meat — 6970 NW 177th St, Hialeah, FL 33015
- Simple Southern Catering — 18538 NW 67th Ave, Miami Gardens, FL 33015
Frequently Asked Questions
What type of property is this?
Flex space - The property combines fully air-conditioned space with renovated offices and storage for flexible commercial use.
Where is this flex space located?
The property is located at 17355 NW 59th Ave Hialeah, FL.
What is the asking price?
The asking price for this property is $34,000,000.
What are key features of this property?
This property features: 7.45‑acre corner site in Hialeah, FL; 32‑foot ceilings with fully air‑conditioned space; More than 410 parking spaces


