Lincoln Park Commercial Office
For Sale
Contact for pricing
1725 N Burling St, Chicago, IL 60614
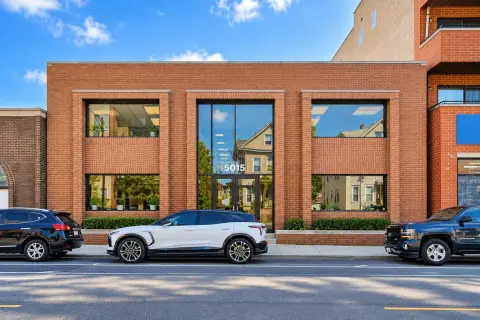
Two-story office building in the heart of Lincoln Park.
Property Size1,809 SF
Price / SF$304.04
Days on Market230
Property Features for 1725 N Burling St
General Information
Standard status
Active
Size
1,809 SF
Class
B
Property subtype
Office
Zoning
B1-3
Lease Type
Modified Gross
Investment Type
Value Add
Building Details
Year Built
2007
Buildings
1
Stories
2
Units
1
Listing Agency:
KW Commercial Chicago - Lincoln Park
Listed By:
Tony Hardy · License #IL 475.139834
(312) 863-8990
Source:
Crexi
Added: Feb 17
Changed: Aug 8
Last Checked: Aug 8 at 2:51PM
Displayed information is deemed reliable but is not guaranteed and should be independently verified. All listing content including descriptions, pricing, images are the copyrighted material of KW Commercial Chicago - Lincoln Park
Investment Insights
Based on property information with market context.
This two-story commercial office building is located in the Lincoln Park neighborhood. The property is well-equipped and highly functional, presenting an opportunity for investors or owner-users seeking a modern, infrastructure-rich office. The building features a large conference room, shared workspace, and personal desks on the second and basement levels. Common space includes 2 bathrooms, a kitchen, and ample storage closets. A shared elevator with the adjacent condo building provides ADA-compliant wheelchair entry from the main lobby, as well as integrated keypad security and a fire annunciator system connected to the neighboring building. The interior offers a professional environment with radiant floor heating beneath hardwood on the first floor, modern LED recessed and track lighting, and individual HVAC controls on the first and second floor, plus a split HVAC system for the lower level. Utility infrastructure includes a main water shut-off, individual gas and electric meters, and both ejector and sump pumps. Technology is supported by Cat6 network cabling throughout all levels, a central server setup in the lower level, and a dedicated Comcast cable line. Shared elements include garbage service and building systems tied into the adjacent property, including elevator access to a shared rooftop. The property size is 1809 square feet.
Key Highlights
- Modern, infrastructure‑rich commercial office building in the heart of Lincoln Park.
- ADA‑compliant wheelchair access via shared elevator with integrated keypad security and fire annunciator system.
- Cat6 network cabling throughout, central server setup, and dedicated Comcast cable line.
Financial Insights
Estimated NOI and Cap Rate
NOI / Yr
$38,814
Cap Rate
7.06%
Suggested Prices Based on Cap Rates
Cap Rate 5%
$776,280
$776.3K
Cap Rate 7%
$554,486
$554.5K
Cap Rate 9%
$431,267
$431.3K
Market Conditions
NOI Build-Up for 1,809 SF
Gross rent
$69.5K $38.40/SF
− Vacancy
−$17.7K −$9.79/SF
EGI
$51.8K $28.61/SF
− OpEx
−$12.9K −$7.15/SF
NOI
$38.8K $21.46/SF
Area
Chicago, IL
Vacancy
25.50%
Lease Rate
$38.40 /SF/Yr
Expense Ratio
25.00%
Simulate Cap Rate and NOI
Suggested Prices Based on Cap Rates
Cap Rate 5%
$776,280
Cap Rate 7%
$554,486
Cap Rate 9%
$431,267
Alternative Uses
Best Use
Office B
$554.5K
$485.2K – $646.9K
NOI $38,814 @ 7.0% cap · market cap 7.06%
Second Best
—
—
no second resolved use
Theoretical Best
Office A
$852.9K
$746.3K – $995.1K
NOI $59,706 @ 7.0% cap · market cap 10.86%
Zoning and permitted uses should be independently verified with authorities.
Property Analytics
Unlock full access to Insights
Subscribe to Realmo Intelligence
Open Analytics
Current Use
Location Intelligence
Trade Area within ½ mile
4,754
Businesses Nearby
Explore this area
Business Placement
Demographics for 60614, IL
73,173
Population
38,089
Households
1.9
Avg Household Size
31
Median Age
86%
College-Educated
98%
High-School Grad
3.2 sq mi
ZIP Area
22,867
Density / Sq Mi
$139,561
Median Household Income
$86,386
Median Earnings
$2,019
Median Rent
$730,700
Median Home Value
Check the figures for this property
Cap Rate, Value Estimation, Potential NOI and more
View Realmo Analytics
Market
Vacancy Rate% for Office in Chicago, IL

Questions? Ask Rey
Realmo’s AI knows this listing — price, zoning, demand, history. Ask anything.





Frequently Asked Questions
What type of property is this?
Office building - Two-story office building in the heart of Lincoln Park.
Where is this office building located?
The property is located at 1725 N Burling St Chicago, IL.
What is the asking price?
The asking price for this property is $550,000.
What are key features of this property?
This property features: Modern, infrastructure‑rich commercial office building in the heart of Lincoln Park.; ADA‑compliant wheelchair access via shared elevator with integrated keypad security and fire annunciator system.; Cat6 network cabling throughout, central server setup, and dedicated Comcast cable line.



