Renovated Duplex with Three-Car


For Sale
$349,999
Pending
17144 Greenlawn Street, Detroit, MI 48221
Multifamily, 2 Story, Detroit, MI
Property Size2,431 SF
Lot Size0.10 Acres
Days on Market50
Property Features for 17144 Greenlawn Street
General Information
Property type
Residential Multi Family
Property subtype
Other
Zoning
Multi-Family
Bedrooms
7
Bathrooms
4
Full bathrooms
3
Half bathrooms
3
Rooms
Basement, Bedroom 6, Bathroom 2, Bedroom 4, Bedroom 7, Bathroom 3, Bedroom 5, Bedroom 3, Bedroom 1, Bedroom 2, Bathroom 1
Pets allowed
Call
Interior features
Laundry Facility
Exterior features
Fenced
Fencing
Fenced
Subdivision
Aurora Park Sub
Elementary school district
Detroit
Middle school district
Detroit
High school district
Detroit
Directions
Near Marygrove college
Standard status
Pending
APN
W16I029460S
Size
2,431 SF
Lot size
0.10 Acres
Taxes and HOA fees
Tax Description
E GREENLAWN 303 AURORA PARK SUB L44 P56 PLATS, W C R 16/281 35 X 128.66A
Tax Annual Amount
1977
Legal Description
E GREENLAWN 303 AURORA PARK SUB L44 P56 PLATS, W C R 16/281 35 X 128.66A
Utilities
Heating system
Forced Air
Water source
Public
Amenities
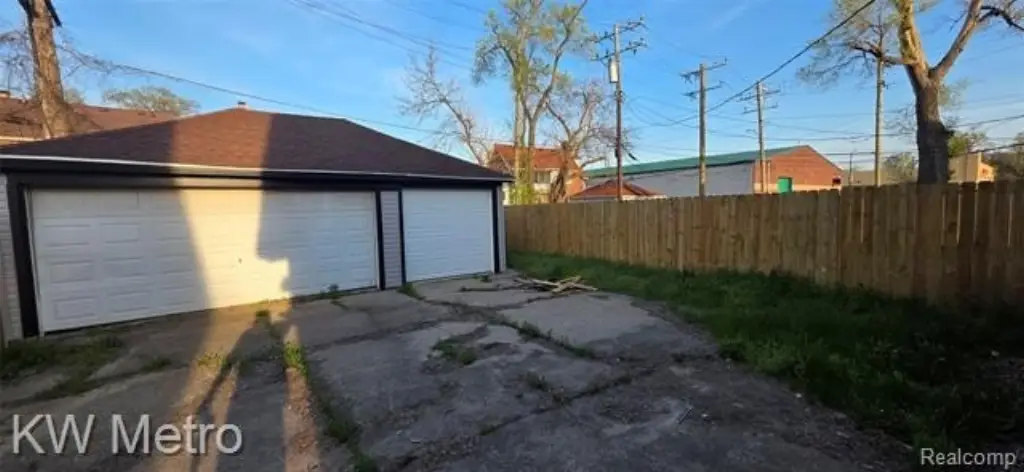
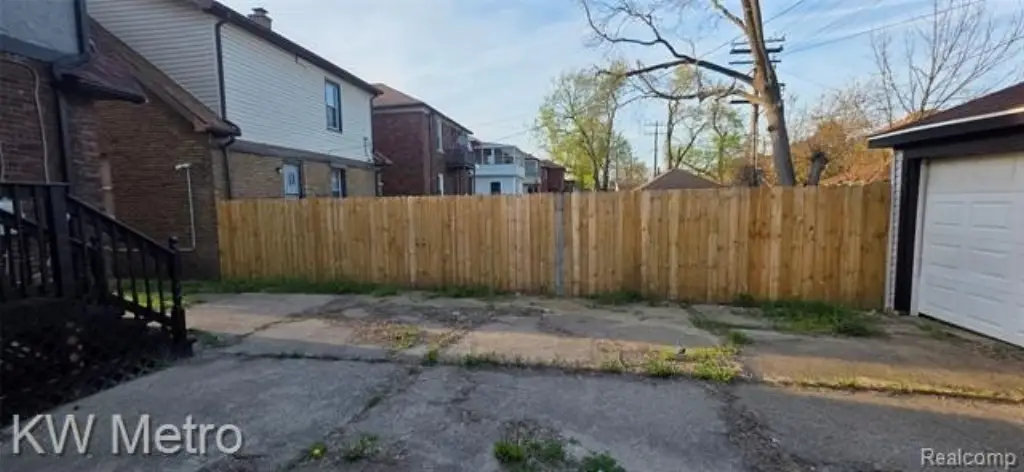
fully fenced shared yard
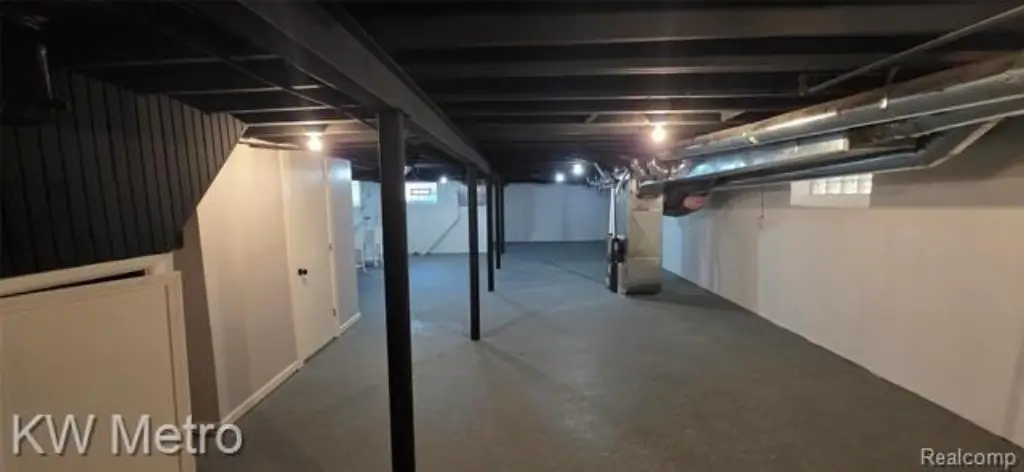
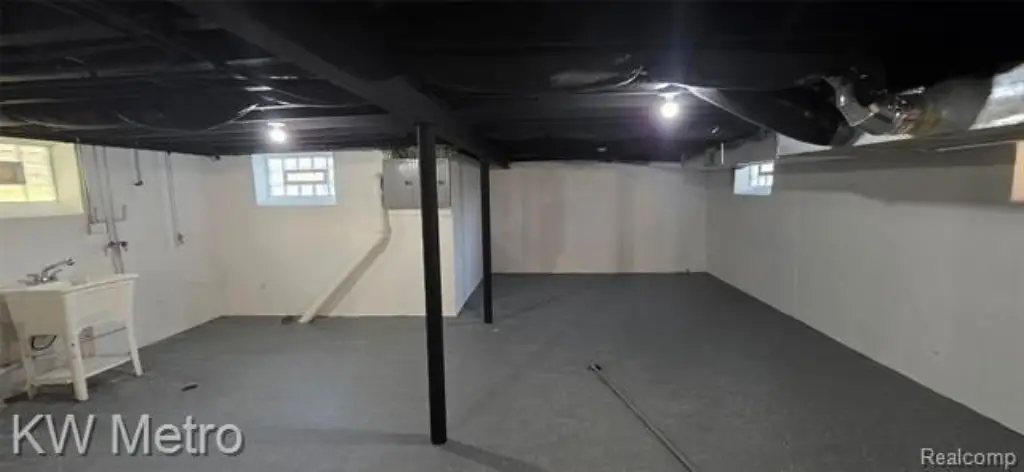
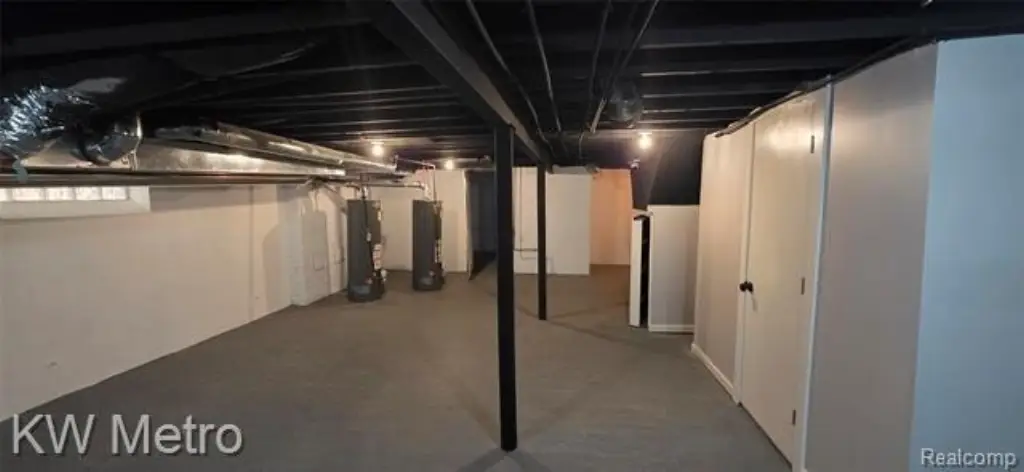
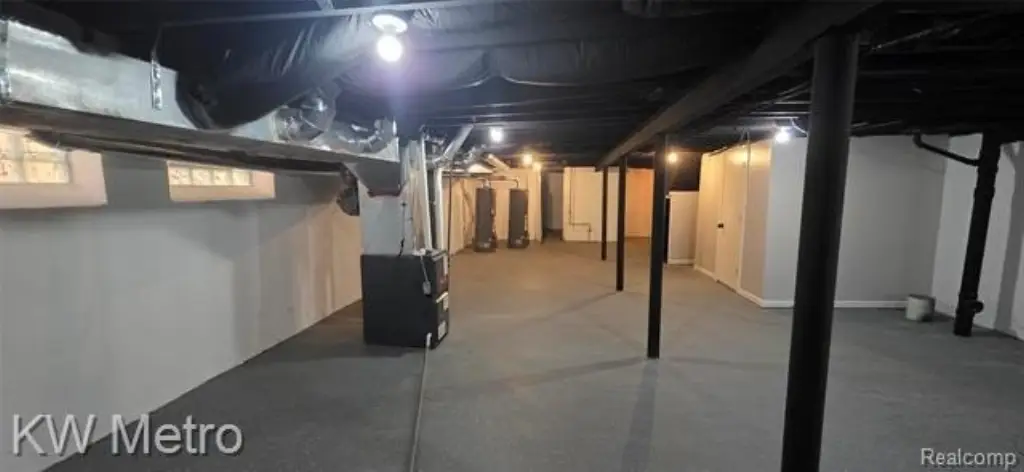
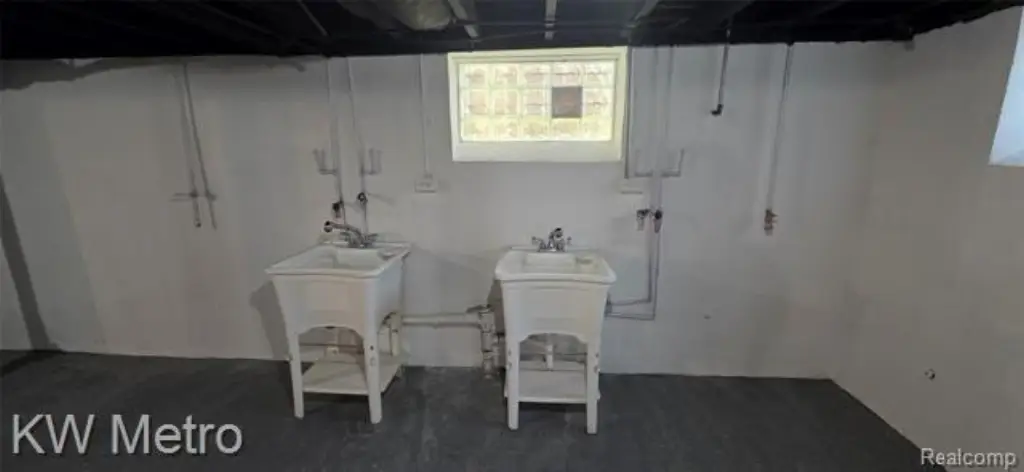
basement with dedicated storage and washer/dryer hookups
24-hour monitored surveillance system
wood-burning fireplace
Building Details
Year built
1928
Floors in Building
2
Number of units
2
Building materials
Brick
Architectural style
Other
Listing Agency:
KW Metro · Keller Williams Realty
Listed By:
Lorenzo Sparks · License #6501412951
(248) 288-3500
Added: Aug 19
Changed: Sep 16
Last Checked: Oct 7 at 1:06AM
MLS# 20261063052
Copyright © 2026 Realcomp Limited II. All rights reserved. All information provided by the listing agent/broker is deemed reliable but is not guaranteed and should be independently verified.
Investment Insights
Based on property information with market context.
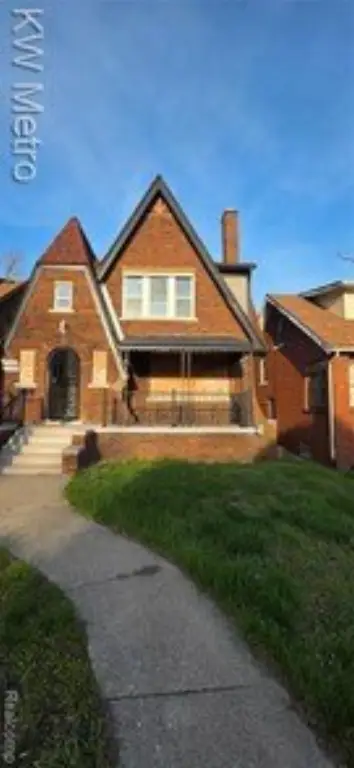
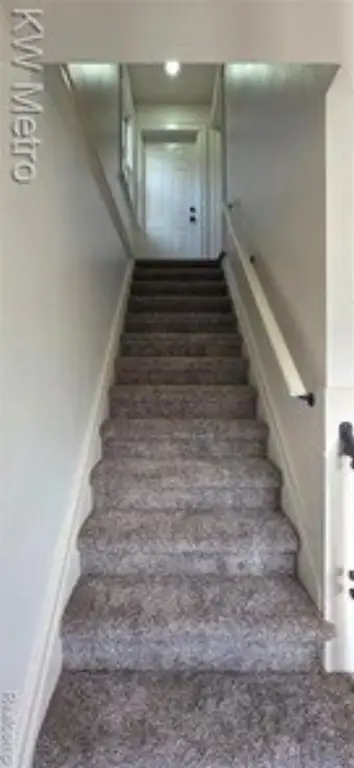
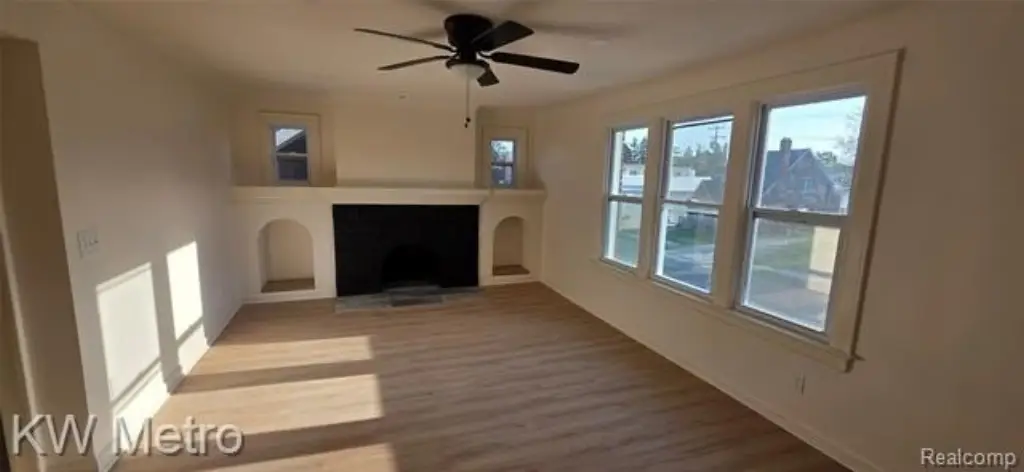
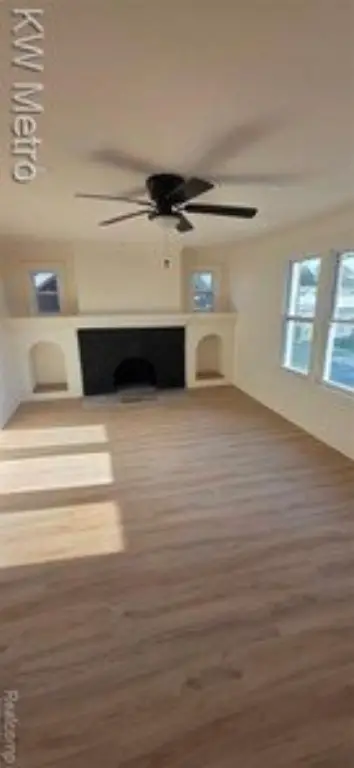
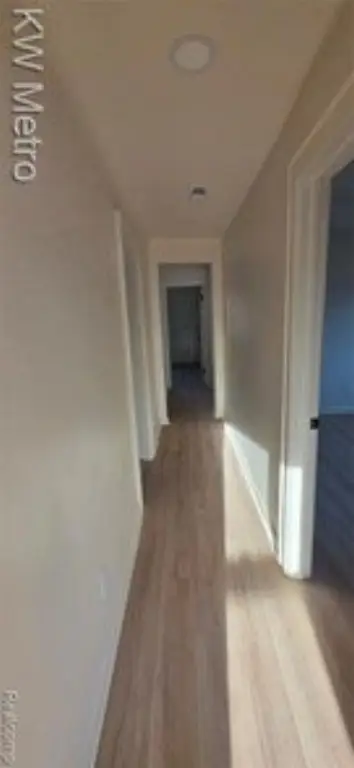
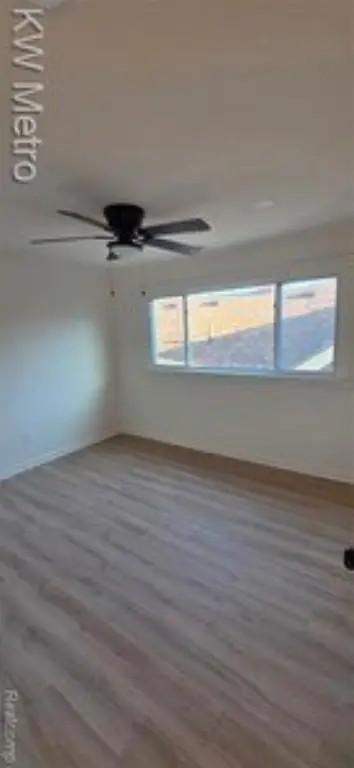
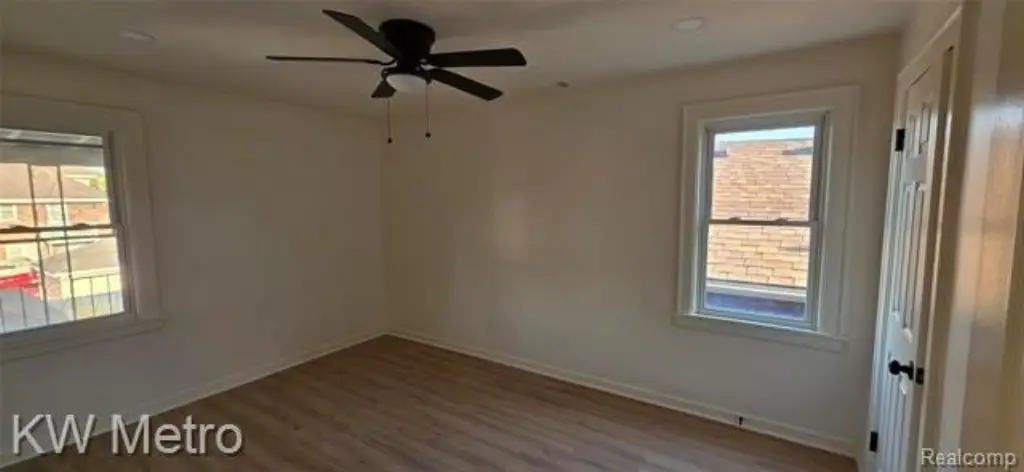
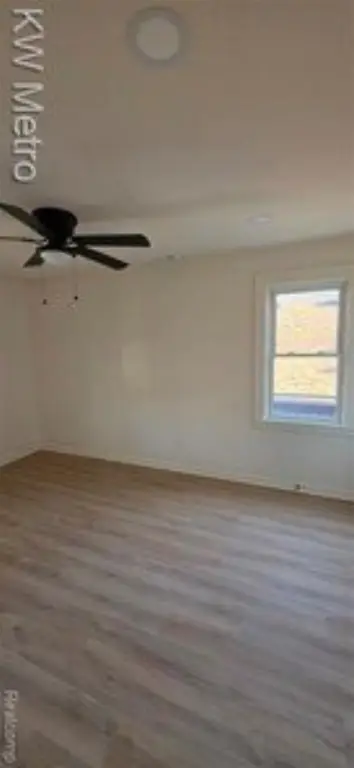
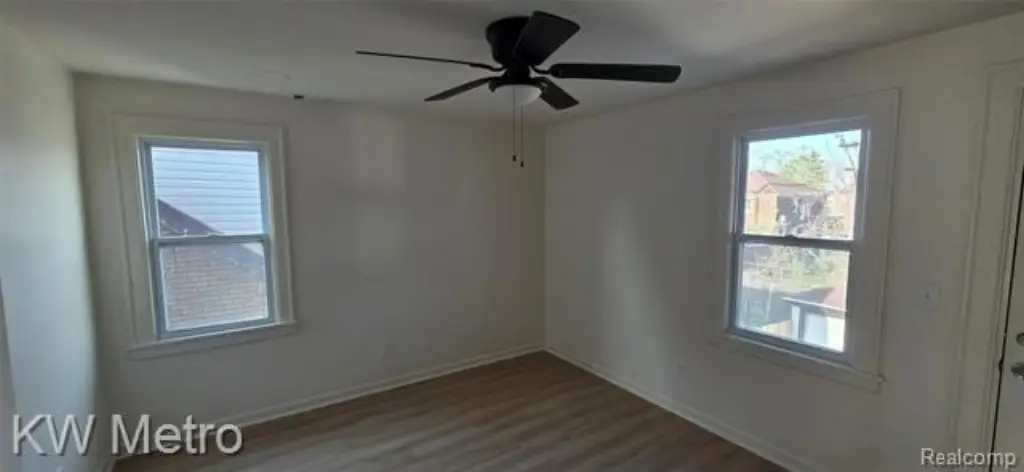
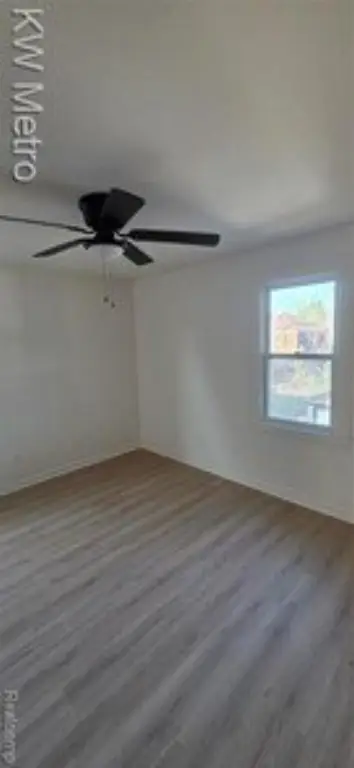
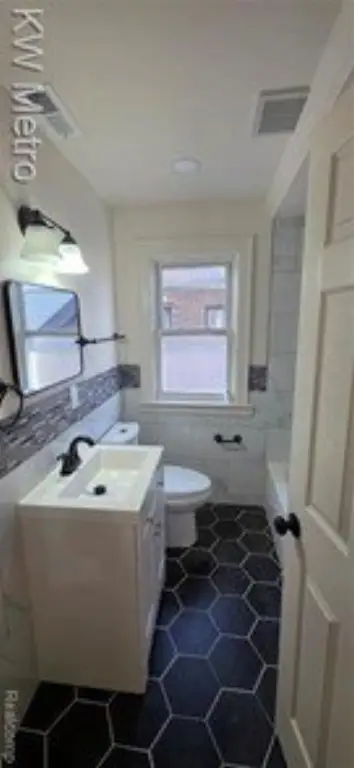
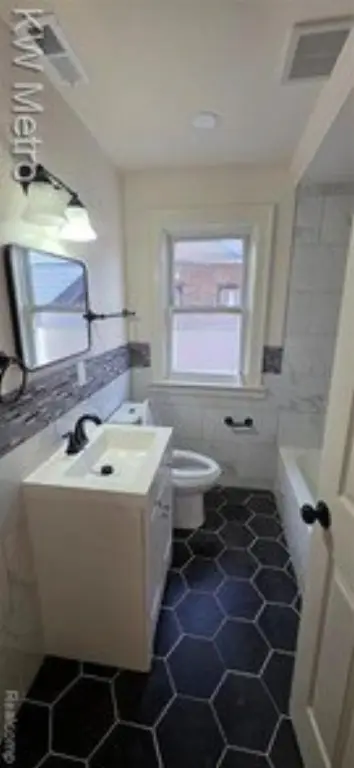
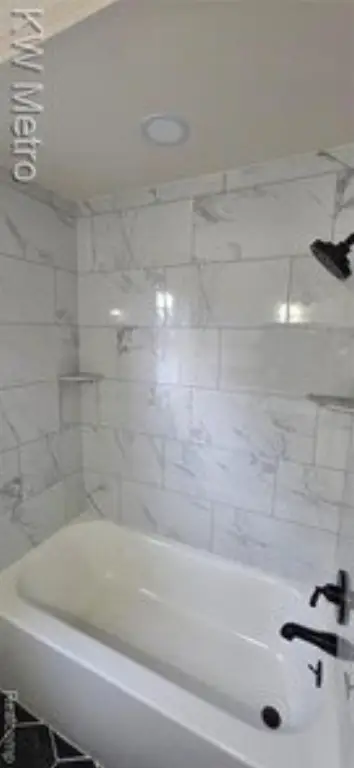
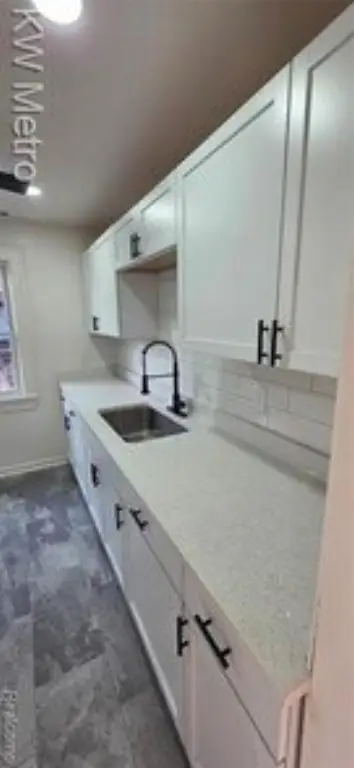
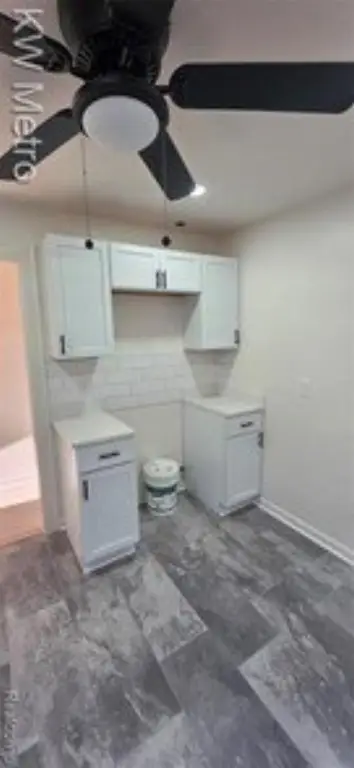
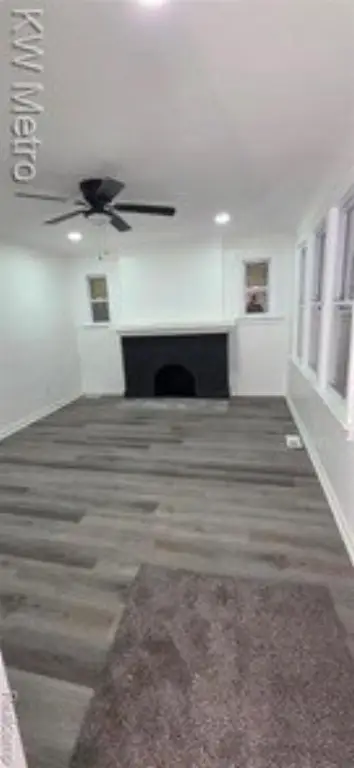
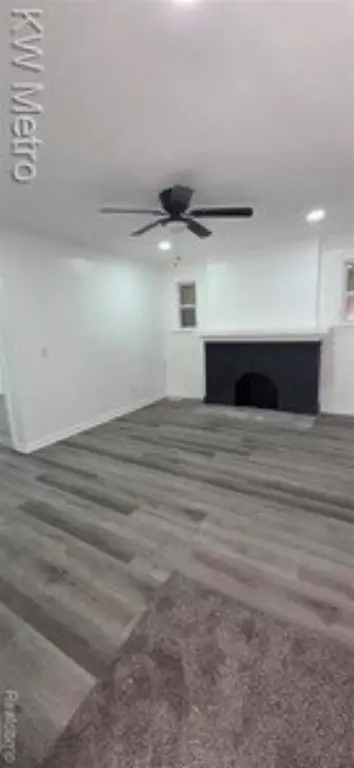
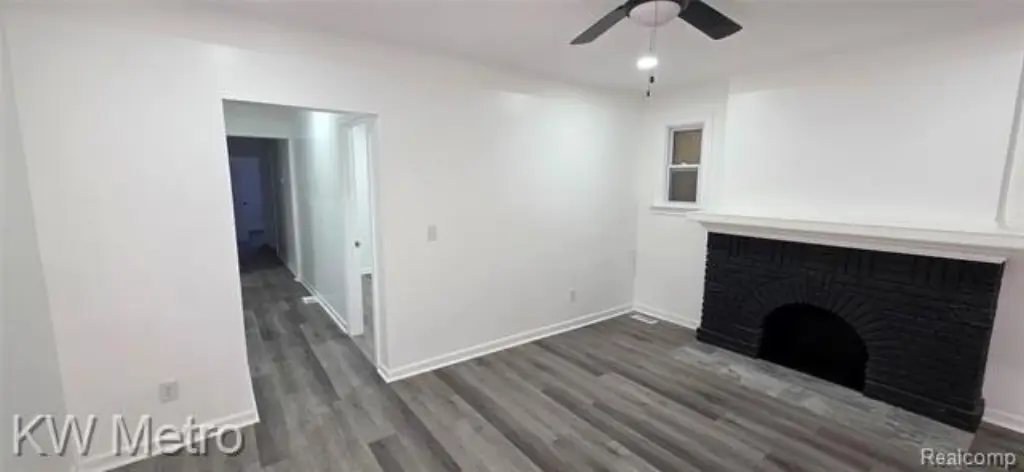
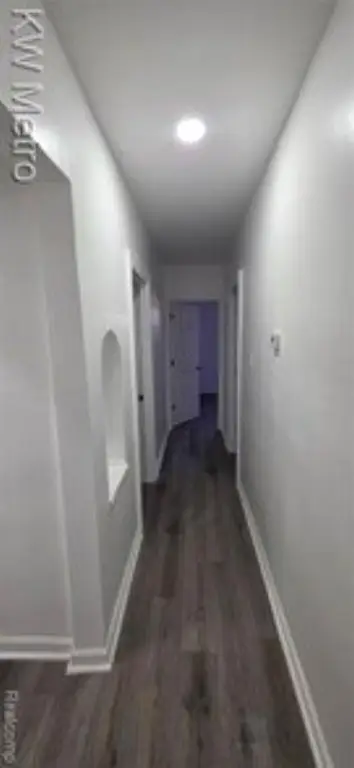
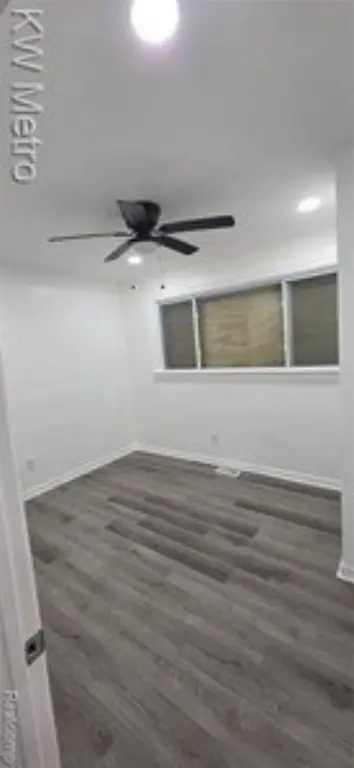
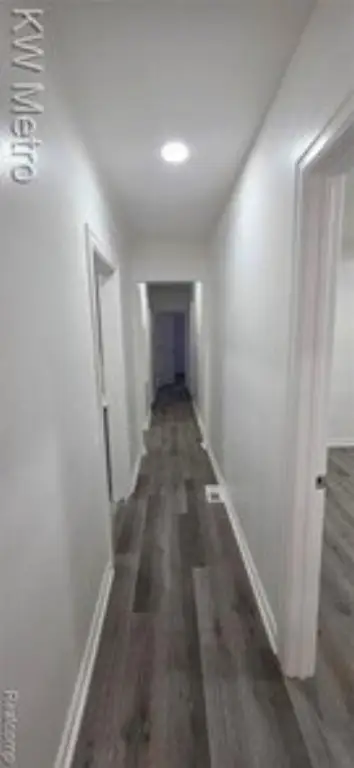
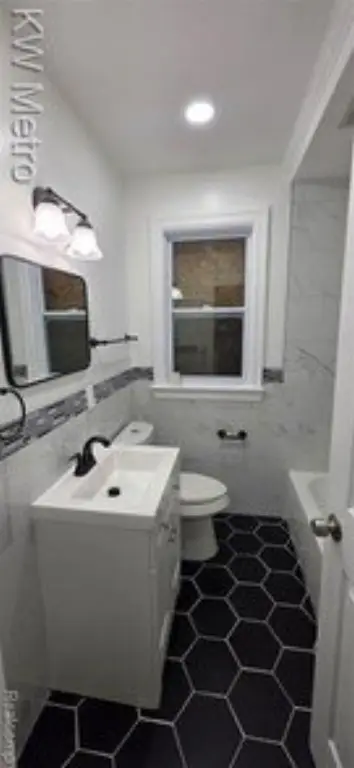
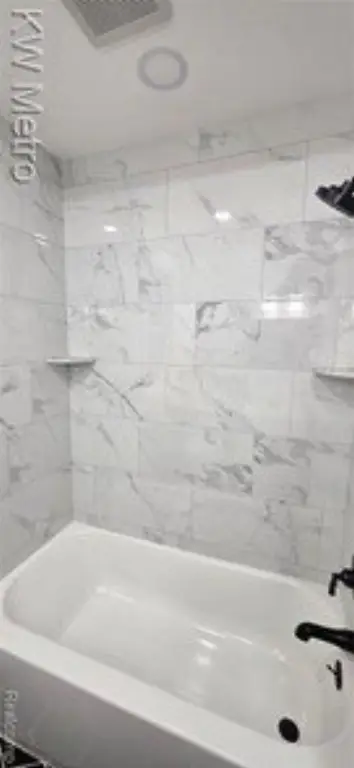
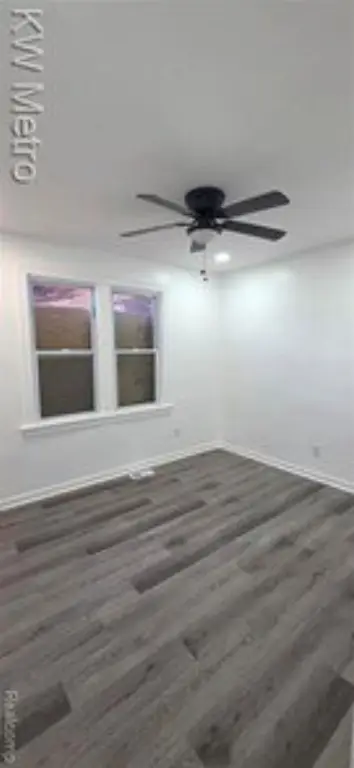
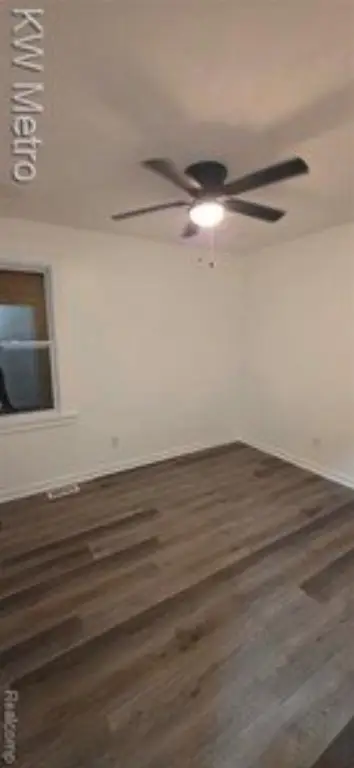
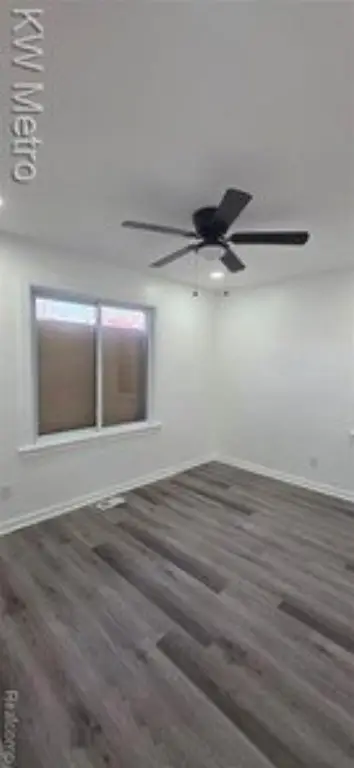
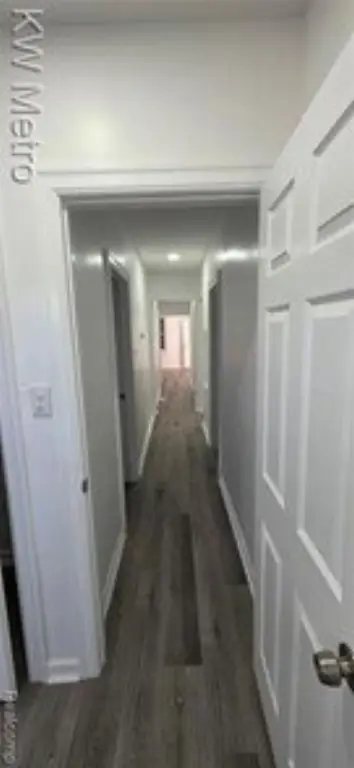
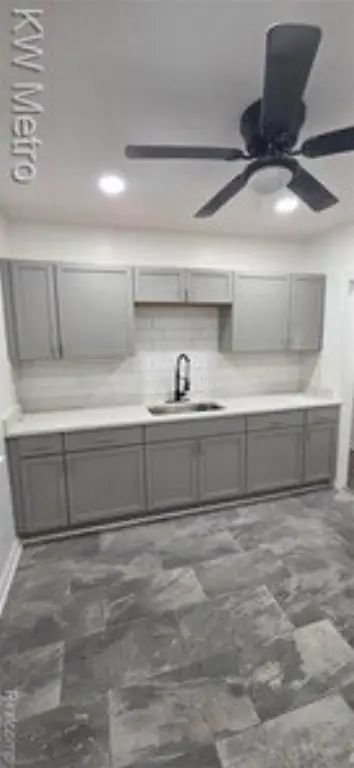
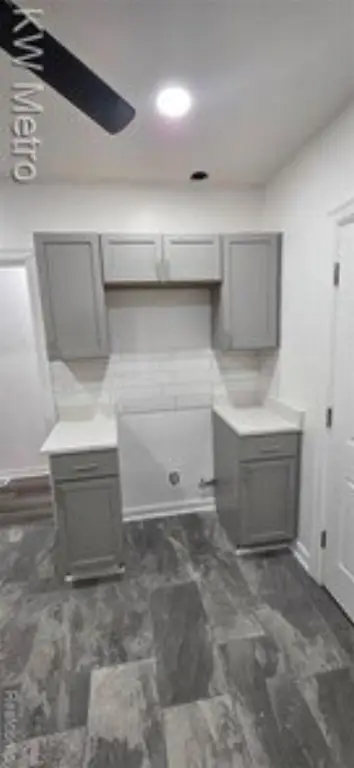
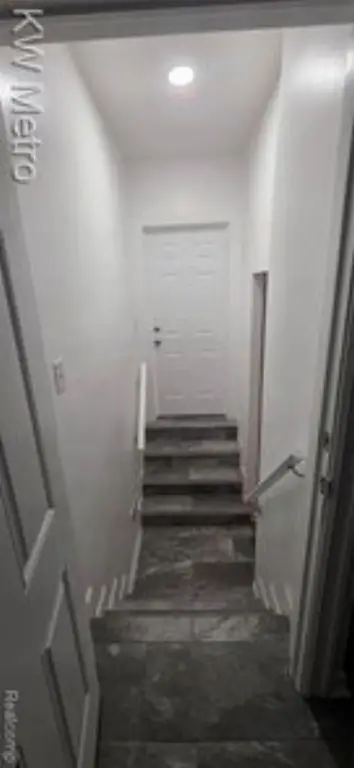
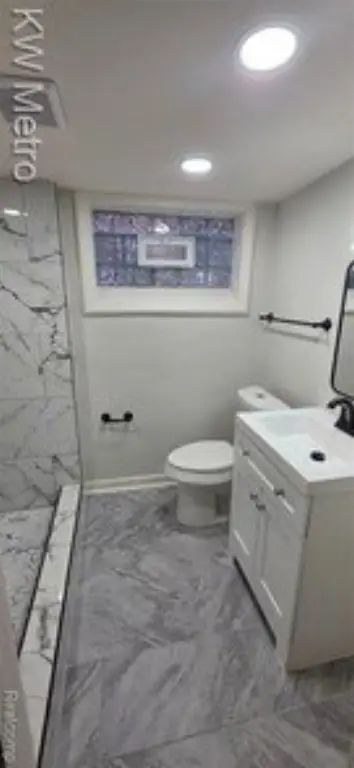
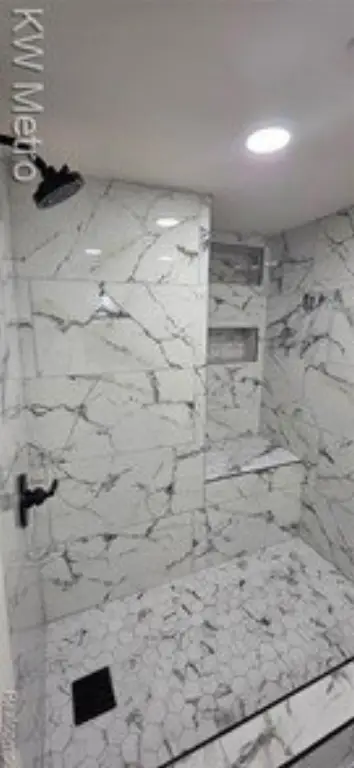
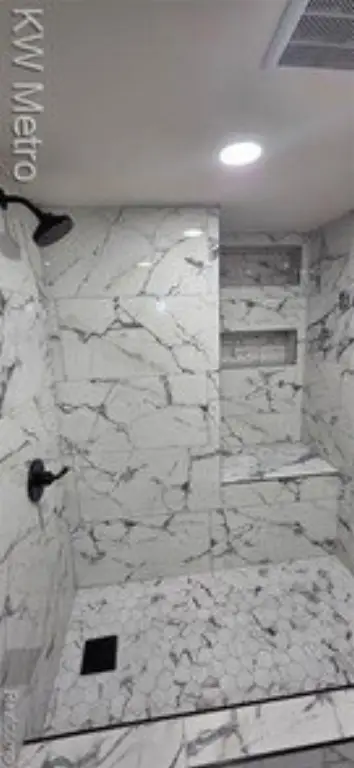
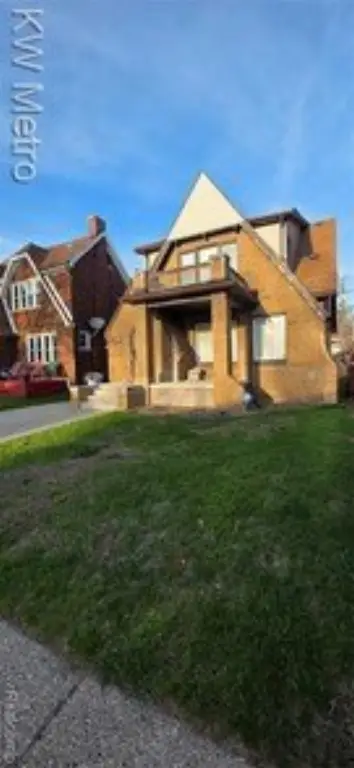
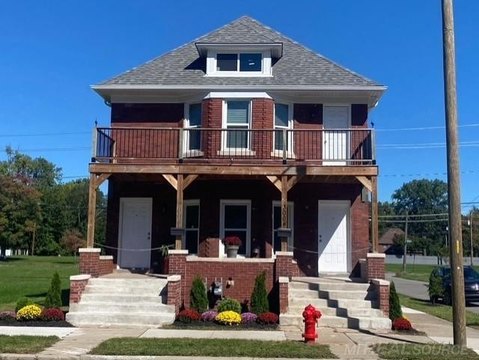
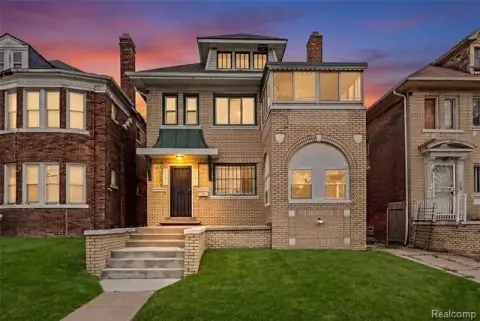
This renovated duplex at 17144 Greenlawn Street contains 2,431 square feet across two residential units. The lower unit has 4 bedrooms and 2 full baths, while the upper unit includes 3 bedrooms and 1 full bath. Interior improvements include tall ceilings, recessed lighting, luxury vinyl plank flooring, updated bathrooms, and a wood-burning fireplace. Both kitchens feature new cabinetry, quartz countertops, and appliance hookups. Mechanical work includes new plumbing, electrical, HVAC systems, roof, and siding; the furnace and hot water heater are scheduled for installation at closing.
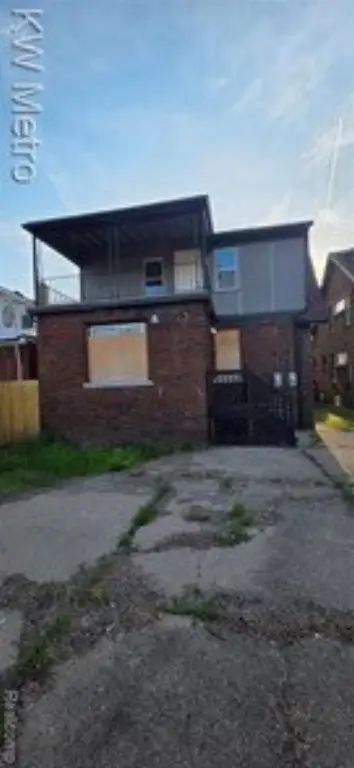
The property sits on a 0.1-acre lot in Detroit's Bagley District and is zoned Multi-Family. A basement provides storage and washer/dryer hookups, while the exterior includes a fenced shared yard and a 3-car garage. The 1928 brick building also has a 24-hour monitored surveillance system and access to public water.
The property sits on a 0.1-acre lot in Detroit's Bagley District and is zoned Multi-Family. A basement provides storage and washer/dryer hookups, while the exterior includes a fenced shared yard and a 3-car garage. The 1928 brick building also has a 24-hour monitored surveillance system and access to public water.
Key Highlights
- 2,431 square feet on a 0.1‑acre lot
- Two units: lower level with 4 bedrooms and 2 full baths; upper level with 3 bedrooms and 1 full bath
- Fully renovated kitchens with new cabinetry, quartz countertops, and appliance hookups
Financial Insights
Estimated NOI and Cap Rate
NOI / Yr
$27,783
Cap Rate
7.94%
Suggested Prices Based on Cap Rates
Cap Rate 5%
$555,660
$555.7K
Cap Rate 7%
$396,900
$396.9K
Cap Rate 9%
$308,700
$308.7K
Market Conditions
NOI Build-Up for 2,431 SF
Gross rent
$42.3K $17.40/SF
− Vacancy
−$2.6K −$1.07/SF
EGI
$39.7K $16.33/SF
− OpEx
−$11.9K −$4.90/SF
NOI
$27.8K $11.43/SF
Area
Detroit, MI
Vacancy
6.17%
Lease Rate
$17.40 /SF/Yr
Expense Ratio
30.00%
Simulate Cap Rate and NOI
Suggested Prices Based on Cap Rates
Cap Rate 5%
$555,660
Cap Rate 7%
$396,900
Cap Rate 9%
$308,700
Alternative Uses
Best Use
Multifamily LT 5
$396.9K
$347.3K – $463.1K
NOI $27,783 @ 7.0% cap · market cap 7.94%
Second Best
Apartment 5plus
$364.3K
$318.8K – $425.1K
NOI $25,503 @ 7.0% cap · market cap 7.29%
Theoretical Best
Office A
$536.3K
$469.3K – $625.7K
NOI $37,540 @ 7.0% cap · market cap 10.73%
Zoning and permitted uses should be independently verified with authorities.
Property Analytics
Unlock full access to Insights
Subscribe to Realmo Intelligence
Open Analytics
Current Use
Lease Details
2
Residential units
Location Intelligence
Trade Area within ½ mile
658
Businesses Nearby
Explore this area
Business Placement
Demographics for 48221, MI
38,204
Population
17,452
Households
2.2
Avg Household Size
38
Median Age
29%
College-Educated
90%
High-School Grad
5.2 sq mi
ZIP Area
7,347
Density / Sq Mi
$55,583
Median Household Income
$37,019
Median Earnings
$1,174
Median Rent
$138,700
Median Home Value
Check the figures for this property
Cap Rate, Value Estimation, Potential NOI and more
View Realmo Analytics
Market
Vacancy Rate% for Multifamily in Midwest region

Questions? Ask Rey
Realmo’s AI knows this listing — price, zoning, demand, history. Ask anything.




Frequently Asked Questions
What type of property is this?
Duplex - Two updated units offer flexible layouts, modern kitchens and baths, basement laundry hookups, and a fenced shared yard.
Where is this duplex located?
The property is located at 17144 Greenlawn Street Detroit, MI.
What is the asking price?
The asking price for this property is $349,999.
What are key features of this property?
This property features: 2,431 square feet on a 0.1‑acre lot; Two units: lower level with 4 bedrooms and 2 full baths; upper level with 3 bedrooms and 1 full bath; Fully renovated kitchens with new cabinetry, quartz countertops, and appliance hookups


