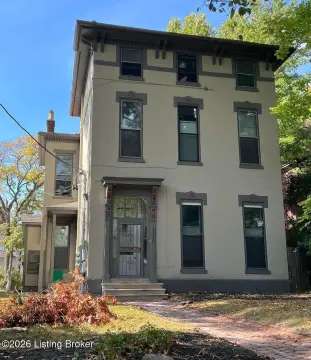
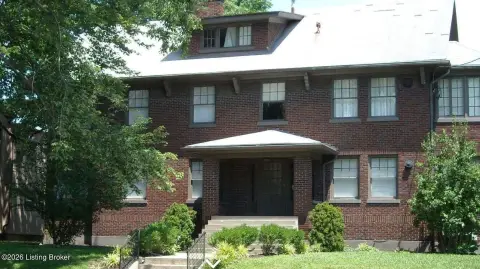
Four-Plex Residential Income
1700 ROSEWOOD AVE Louisville, KY 40204
For Sale
Contact for pricing
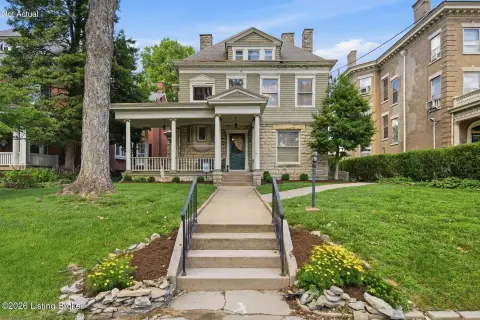
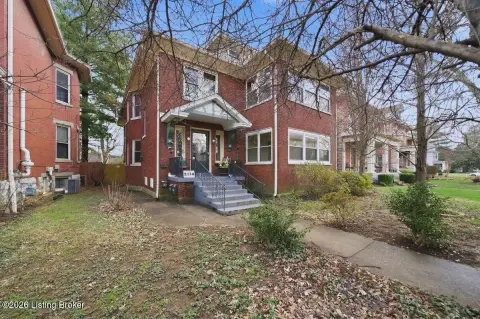
Four-unit residential income property with separate electric meters for each tenant.
Property Size2,993 SF
Price / SF$141
Days on Market58
Property Features for 1700 ROSEWOOD AVE
General Information
Standard status
Active
Size
2,993 SF
Property subtype
Multifamily
Building Details
Year Built
1900
Listing Agency:
Weichert Commercial Brokerage Inc Louisville
(502) 609-4778
Listed By:
William Friel · License #KY 57228
Source:
Crexi
Added: Jun 1
Changed: Jul 10
Last Checked: Jul 27 at 6:57PM
Displayed information is deemed reliable but is not guaranteed and should be independently verified. All listing content including descriptions, pricing, images are the copyrighted material of Weichert Commercial Brokerage Inc Louisville
Investment Insights
Based on property information with market context.
This versatile four-plex provides a simple four-unit residential setup, offering separate electric metering for every tenant and one common gas meter. The configuration supports a variety of ownership approaches, including an owner-occupant living in one unit while renting the remaining three.
Located in the heart of Louisville’s Highlands neighborhood, the property is described as minutes to the Bardstown Road corridor, known for dining, retail, and local nightlife. The central location is positioned to serve tenants who want convenient access to the area’s established commercial activity.
For investors, this asset combines multi-unit flexibility with an efficient utility arrangement that can help streamline tenant billing through dedicated electric meters. For owner-occupants, the layout supports living on-site while collecting rental income from the other units. The property is presented as having a solid rental history, with value focused on optimizing rents through ownership. Prospective buyers and brokers should review the current unit mix and lease terms to confirm income and operating details.
Located in the heart of Louisville’s Highlands neighborhood, the property is described as minutes to the Bardstown Road corridor, known for dining, retail, and local nightlife. The central location is positioned to serve tenants who want convenient access to the area’s established commercial activity.
For investors, this asset combines multi-unit flexibility with an efficient utility arrangement that can help streamline tenant billing through dedicated electric meters. For owner-occupants, the layout supports living on-site while collecting rental income from the other units. The property is presented as having a solid rental history, with value focused on optimizing rents through ownership. Prospective buyers and brokers should review the current unit mix and lease terms to confirm income and operating details.
Key Highlights
- Four‑unit residential income property (4‑plex) built in 1900
- Separate electric meters for every tenant
- Single common gas meter for the property
Financial Insights For Multifamily LT 5
Simulate Cap Rate and NOI
NOI Build-Up
- Vacancy
- income lost from leasable area expected to sit empty during the year — subtracted from gross rent.
- EGI (Effective Gross Income)
- gross rent minus vacancy losses — the realistic income before paying operating costs.
- OpEx (Operating Expenses)
- recurring costs to operate the property (property tax, insurance, utilities, maintenance, management) — excludes financing and capital improvements.
- NOI (Net Operating Income)
- income a property generates after operating costs but before financing and taxes.
| Component | $ | $/SF |
|---|---|---|
| Gross rent | $38.1k | $12.72 |
| − Vacancy | −$2.1k | −$0.70 |
| EGI | $36.0k | $12.02 |
| − OpEx | −$10.8k | −$3.61 |
| NOI | $25.2k | $8.41 |
2,993 SF · lease $12.72/SF/yr · vacancy 5.50% · expense 30.00%
Alternative Uses
Best Use
Multifamily LT 5
$359.8K
$314.8K – $419.7K
NOI $25,184 @ 7.0% cap · market cap 5.93%
Second Best
Apartment 5plus
$291.0K
$254.6K – $339.5K
NOI $20,369 @ 7.0% cap · market cap 4.79%
Theoretical Best
Office A
$775.8K
$678.8K – $905.1K
NOI $54,305 @ 7.0% cap · market cap 12.78%
Zoning and permitted uses should be independently verified with authorities.
Property Analytics
Property Profile
Location Intelligence
Current Use


Frequently Asked Questions
What type of property is this?
Quadplex - Four-unit residential income property with separate electric meters for each tenant.
Where is this quadplex located?
The property is located at 1700 ROSEWOOD AVE Louisville, KY.
What is the asking price?
The asking price for this property is $425,000.
What are key features of this property?
This property features: Four‑unit residential income property (4‑plex) built in 1900; Separate electric meters for every tenant; Single common gas meter for the property