Venice Mixed-Use Investment
For Sale
Contact for pricing
1700 Lincoln Blvd, Los Angeles, CA 90291
Mixed-use property in Venice with retail and residential units.
Property Size8,192 SF
Price / SF$714.11
Days on Market694
Property Features for 1700 Lincoln Blvd
General Information
Standard status
Active
Size
8,192 SF
Total Parking Spaces
14
Property subtype
Mixed Use, Retail
Zoning
LAC2
Occupancy
60%
Net Operating Income
$227,255
Building Details
Year Built
1925
Buildings
1
Stories
2
Units
7
Tenancy
Multi
Listing Agency:
WESTMAC
Listed By:
T.C. Macker · License #CA 01232033
Source:
Crexi
Added: Nov 12, 2024
Changed: Oct 7
Last Checked: Oct 7 at 12:05PM
Displayed information is deemed reliable but is not guaranteed and should be independently verified. All listing content including descriptions, pricing, images are the copyrighted material of WESTMAC
Investment Insights
Based on property information with market context.
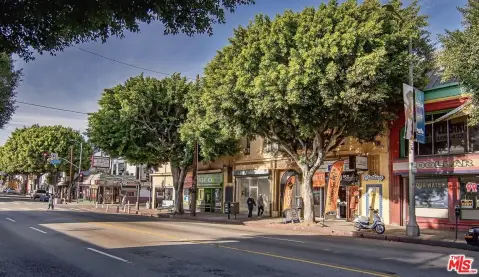
Located on Lincoln Boulevard, at the corner of Nowita Place, the mixed-use property at 1700-1702 Lincoln Boulevard features three ground-floor retail units and four apartments on the second floor. The property is currently 60% occupied. One of the retail spaces is occupied by Companion, a cafe serving coffee, pastries, pizza, and wine. The other retail spaces are currently vacant. All four apartment units are occupied; there are two two-bedroom apartments and two one-bedroom apartments. Three of the units have outdoor space. The property includes 14 parking spaces in the rear of the building. Situated in Venice, the property is located on Lincoln Boulevard, north of Venice Boulevard, an area known for cafes, boutiques, and restaurants. The surrounding area has a high average household income of over $150,000 within a one-mile radius. The property is less than 30 minutes from LAX, and Venice’s Abbot Kinney Boulevard is less than a mile away. The building size is 8,192 square feet.
Key Highlights
- Prime Venice location on Lincoln Boulevard, near Venice Boulevard, with high foot traffic and desirable amenities.
- Mixed‑use building with ground floor retail and four apartments, offering diverse income streams.
- High‑income demographic area with an average household income exceeding $150,000 within a one‑mile radius.
Financial Insights
Estimated NOI and Cap Rate
NOI / Yr
$165,888
Cap Rate
2.84%
Suggested Prices Based on Cap Rates
Cap Rate 5%
$3,317,760
$3.3M
Cap Rate 7%
$2,369,829
$2.4M
Cap Rate 9%
$1,843,200
$1.8M
Market Conditions
NOI Build-Up for 8,192 SF
Gross rent
$294.9K $36.00/SF
− Vacancy
−$29.5K −$3.60/SF
EGI
$265.4K $32.40/SF
− OpEx
−$99.5K −$12.15/SF
NOI
$165.9K $20.25/SF
Area
Los Angeles, CA
Vacancy
10.00%
Lease Rate
$36.00 /SF/Yr
Expense Ratio
37.50%
Simulate Cap Rate and NOI
Suggested Prices Based on Cap Rates
Cap Rate 5%
$3,317,760
Cap Rate 7%
$2,369,829
Cap Rate 9%
$1,843,200
Alternative Uses
Best Use
Mixed Use
$2.37M
$2.07M – $2.76M
NOI $165,888 @ 7.0% cap · market cap 2.84%
Second Best
—
—
no second resolved use
Theoretical Best
Multifamily LT 5
$165.96M
$145.22M – $193.63M
NOI $11,617,550 @ 7.0% cap · market cap 198.59%
Zoning and permitted uses should be independently verified with authorities.
Property Analytics
Unlock full access to Insights
Subscribe to Realmo Intelligence
Open Analytics
Current Use
Location Intelligence
Trade Area within ½ mile
2,226
Businesses Nearby
Explore this area
Business Placement
Demographics for 90291, CA
28,442
Population
16,709
Households
1.7
Avg Household Size
39
Median Age
72%
College-Educated
96%
High-School Grad
2.5 sq mi
ZIP Area
11,377
Density / Sq Mi
$119,043
Median Household Income
$83,008
Median Earnings
$2,630
Median Rent
$2,000,001
Median Home Value
Check the figures for this property
Cap Rate, Value Estimation, Potential NOI and more
View Realmo Analytics

Questions? Ask Rey
Realmo’s AI knows this listing — price, zoning, demand, history. Ask anything.




Frequently Asked Questions
What type of property is this?
Mixed-use property - Mixed-use property in Venice with retail and residential units.
Where is this mixed-use property located?
The property is located at 1700 Lincoln Blvd Los Angeles, CA.
What is the asking price?
The asking price for this property is $5,850,000.
What are key features of this property?
This property features: Prime Venice location on Lincoln Boulevard, near Venice Boulevard, with high foot traffic and desirable amenities.; Mixed‑use building with ground floor retail and four apartments, offering diverse income streams.; High‑income demographic area with an average household income exceeding $150,000 within a one‑mile radius.



