Occupied Duplex with
For Sale
$350,000
170-172 Heritage Dr, Nicholasville, KY 40356
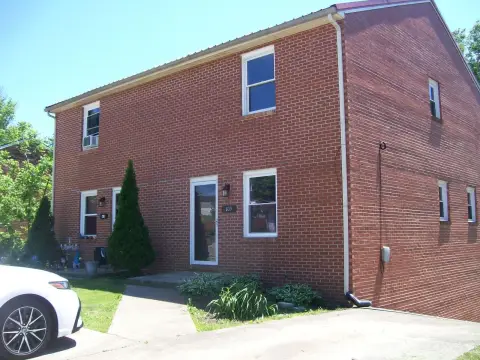
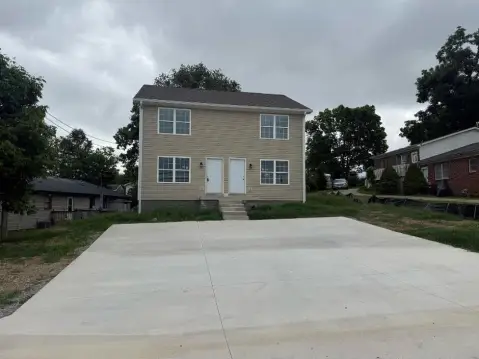
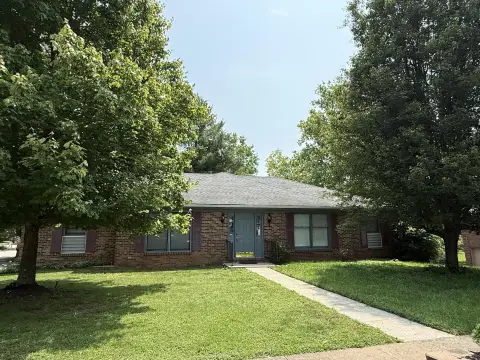
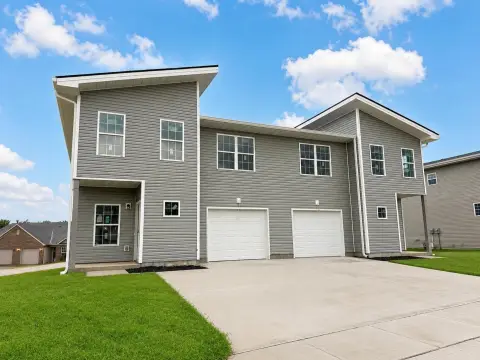
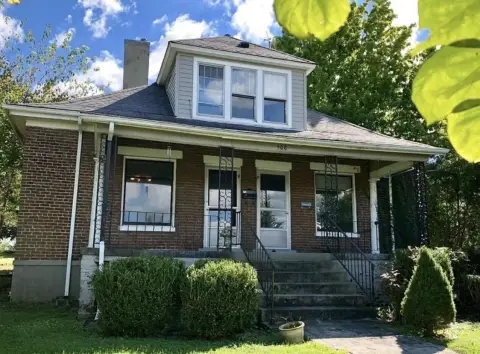
Two attached residences offer separate garages, basement storage, and recent exterior improvements near a neighborhood park.
Property Size2,670 SF
Price / SF$131.09
Days on Market102
Property Features for 170-172 Heritage Dr
General Information
Standard status
Active
Size
2,670 SF
Total Parking Spaces
2
Property subtype
Multi-Family
Occupancy
100%
Units
Unit Mix
2 x 2BR/1.5BA
Multifamily Units
2
Parking per Unit
1
Building Details
Year Built
1988
Listing Agency:
RE/MAX Elite Realty
Listed By:
Terra Jeffries · License #223352
(859) 312-0058
Source:
Centralkentuckyhouses
Added: Jul 5
Changed: Oct 1
Last Checked: Oct 12 at 8:01PM
Displayed information is deemed reliable but is not guaranteed and should be independently verified. All listing content including descriptions, pricing, images are the copyrighted material of RE/MAX Elite Realty
Investment Insights
Based on property information with market context.
This 2,670-square-foot duplex contains two occupied townhome-style residences, each with 2 bedrooms, 1.5 bathrooms, a one-car garage, and an unfinished basement. Built in 1988, the property has received a new roof, siding, gutters, and windows. Tenants pay all utilities, providing a straightforward operating arrangement.
The property sits on the north side of recently upgraded Lake Mingo Park and is walkable to jobs, shopping, additional parks, and Main Street. The two-unit layout supports continued rental use or an owner-occupancy arrangement with a separate residence on site.
The property sits on the north side of recently upgraded Lake Mingo Park and is walkable to jobs, shopping, additional parks, and Main Street. The two-unit layout supports continued rental use or an owner-occupancy arrangement with a separate residence on site.
Key Highlights
- 2,670‑square‑foot duplex with two occupied townhomes
- Each unit includes 2 bedrooms and 1.5 bathrooms
- One‑car garage and unfinished basement for each residence
Financial Insights
Estimated NOI and Cap Rate
NOI / Yr
$22,780
Cap Rate
6.51%
Suggested Prices Based on Cap Rates
Cap Rate 5%
$455,600
$455.6K
Cap Rate 7%
$325,429
$325.4K
Cap Rate 9%
$253,111
$253.1K
Market Conditions
NOI Build-Up for 2,670 SF
Gross rent
$34.0K $12.72/SF
− Vacancy
−$1.4K −$0.53/SF
EGI
$32.5K $12.19/SF
− OpEx
−$9.8K −$3.66/SF
NOI
$22.8K $8.53/SF
Area
Jessamine County, KY
Vacancy
4.18%
Lease Rate
$12.72 /SF/Yr
Expense Ratio
30.00%
Simulate Cap Rate and NOI
Suggested Prices Based on Cap Rates
Cap Rate 5%
$455,600
Cap Rate 7%
$325,429
Cap Rate 9%
$253,111
Alternative Uses
Best Use
Multifamily LT 5
$325.4K
$284.8K – $379.7K
NOI $22,780 @ 7.0% cap · market cap 6.51%
Second Best
Apartment 5plus
$291.2K
$254.8K – $339.7K
NOI $20,384 @ 7.0% cap · market cap 5.82%
Theoretical Best
Office A
$676.7K
$592.1K – $789.5K
NOI $47,368 @ 7.0% cap · market cap 13.53%
Zoning and permitted uses should be independently verified with authorities.
How Realmo checks its estimates
Property Analytics
Current Use
Lease Details
2
Residential units
100%
Occupancy
Location Intelligence
Trade Area within ½ mile
439
Businesses Nearby
Explore this area
Business Placement
Demographics for 40356, KY
44,381
Population
17,934
Households
2.5
Avg Household Size
39
Median Age
31%
College-Educated
90%
High-School Grad
139.5 sq mi
ZIP Area
318
Density / Sq Mi
$75,264
Median Household Income
$41,427
Median Earnings
$1,020
Median Rent
$246,300
Median Home Value
Market
Vacancy Rate% for Multifamily in South region

Questions? Ask Rey
Realmo’s AI knows this listing — price, zoning, demand, history. Ask anything.




Frequently Asked Questions
What type of property is this?
Duplex - Two attached residences offer separate garages, basement storage, and recent exterior improvements near a neighborhood park.
Where is this duplex located?
The property is located at 170-172 Heritage Dr Nicholasville, KY.
What is the asking price?
The asking price for this property is $350,000.
What are key features of this property?
This property features: 2,670‑square‑foot duplex with two occupied townhomes; Each unit includes 2 bedrooms and 1.5 bathrooms; One‑car garage and unfinished basement for each residence


