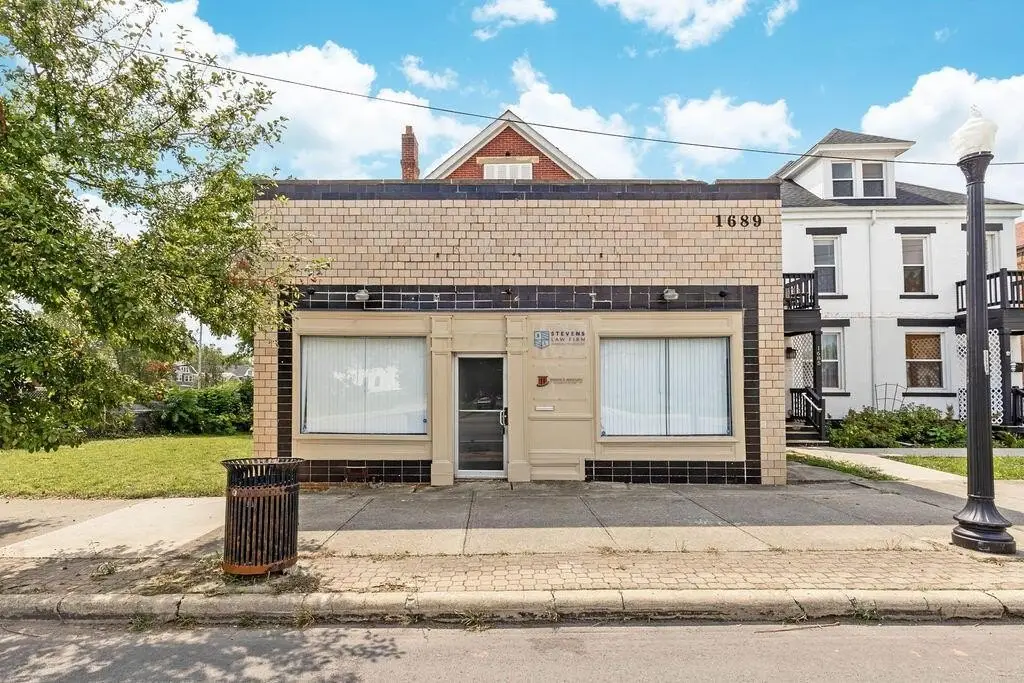
Two-Story Office Building with Separate
1689 E Main Street Columbus, OH 43205
For Sale
$399,000
SINGLE_FAMILY - Columbus, OH
Property Size2,144 SF
Lot Size0.08 Acres
Price / SF$186.10
Days on Market49
Property Features for 1689 E Main Street
General Information
- Property type
- Residential
- Property subtype
- Office
- Rooms
- Basement
- Standard status
- Active
- APN
- 010-040166-00
- Size
- 2,144 SF
- Lot size
- 0.08 Acres
Taxes and HOA fees
- Tax Year
- 2024
- Tax Annual Amount
- 2546
Building Details
- Year built
- 1915
- Floors in Building
- 2
Listing Agency:
Keller Williams Greater Cols
(614) 944-5900
Listed By:
Nathan Yolles · License #2019002346
(614) 537-2550
Added: Jun 9
Changed: Jul 27
Last Checked: Jul 27 at 1:06AM
MLS# 226020904
Copyright © 2026 Columbus and Central Ohio Multiple Listing Service. All rights reserved. All information provided by the listing agent/broker is deemed reliable but is not guaranteed and should be independently verified.
Investment Insights
Based on property information with market context.
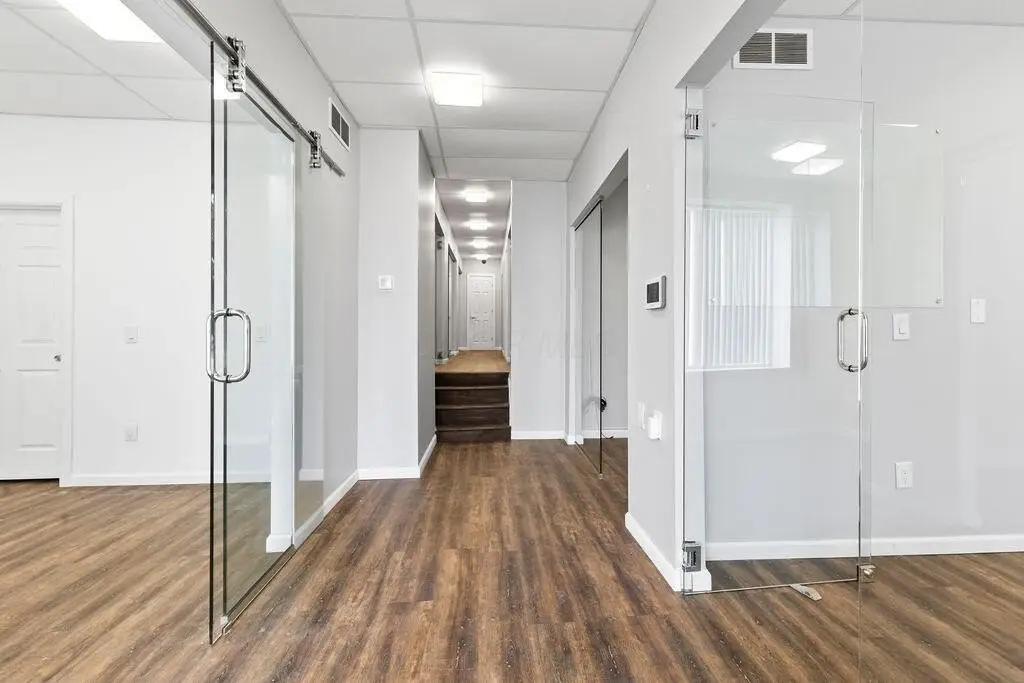
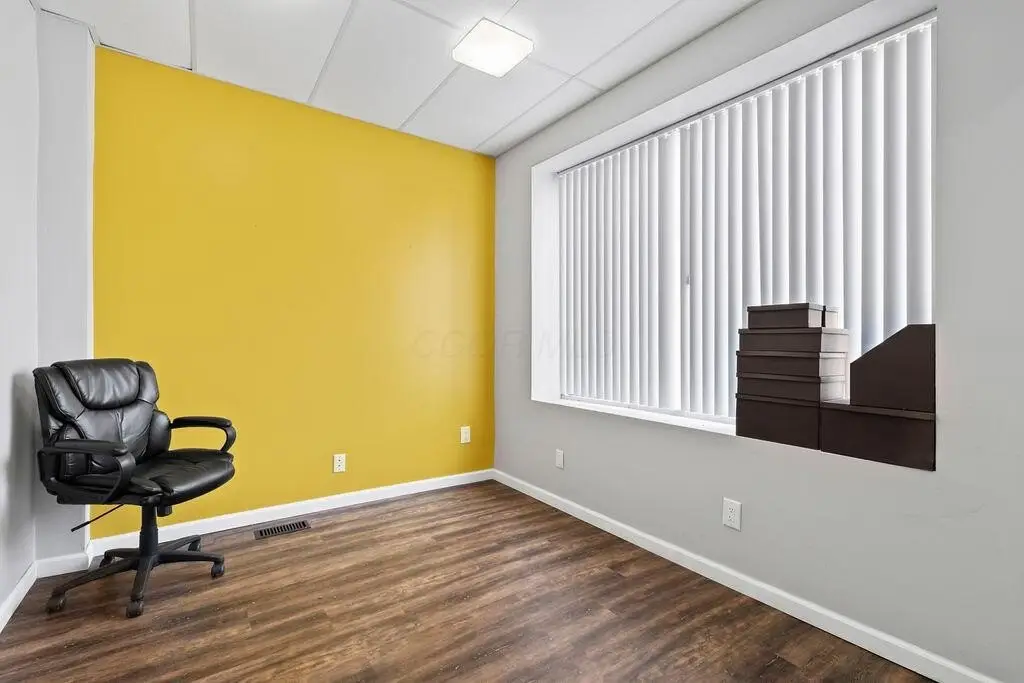
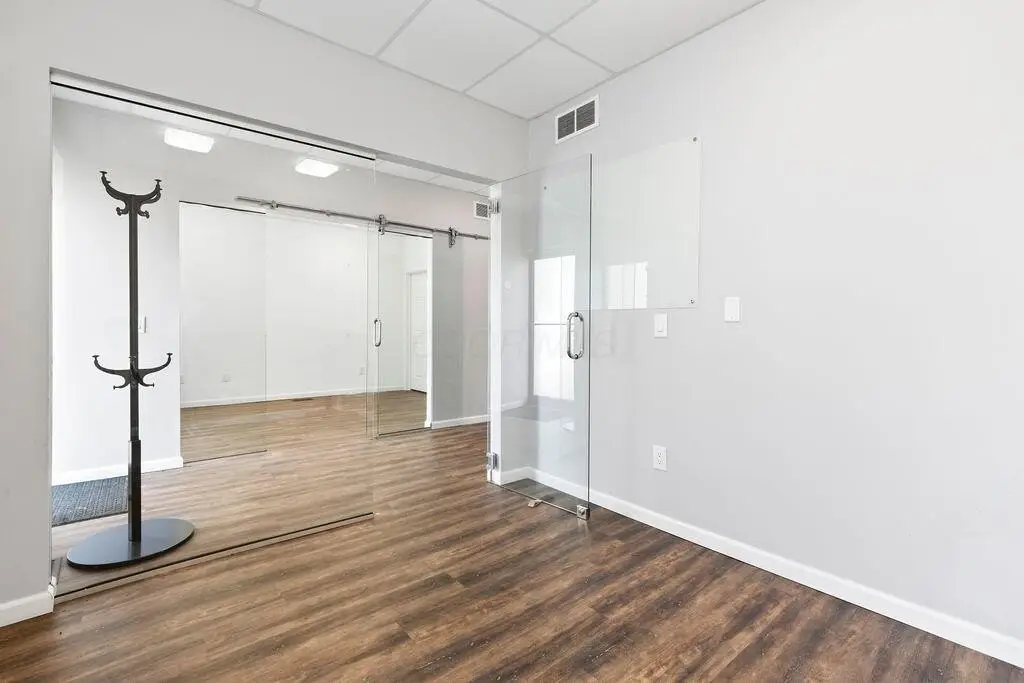
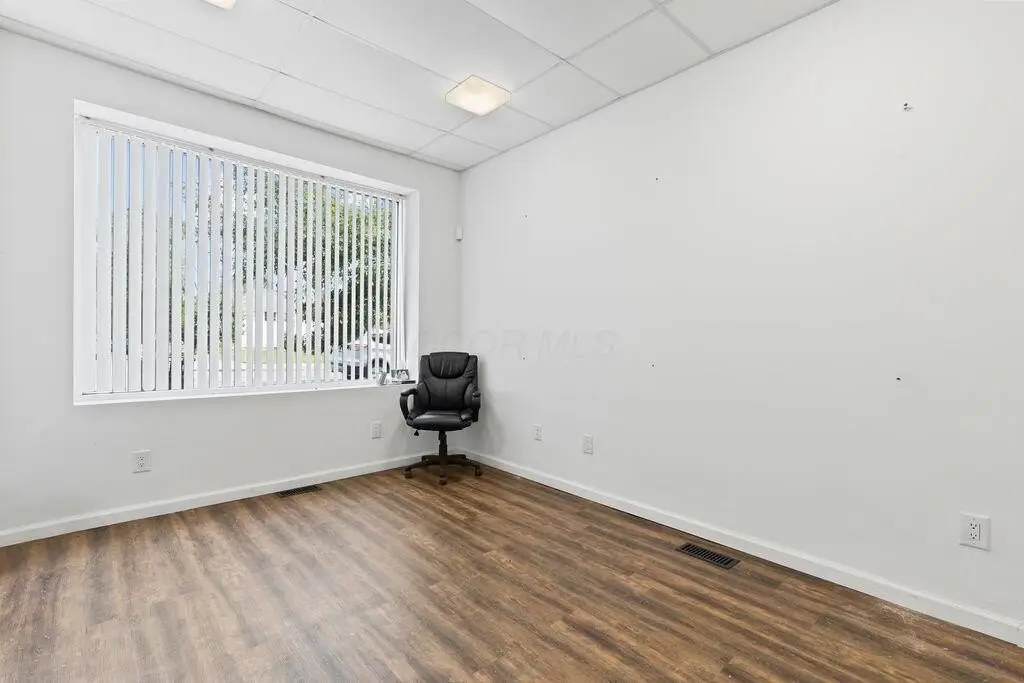
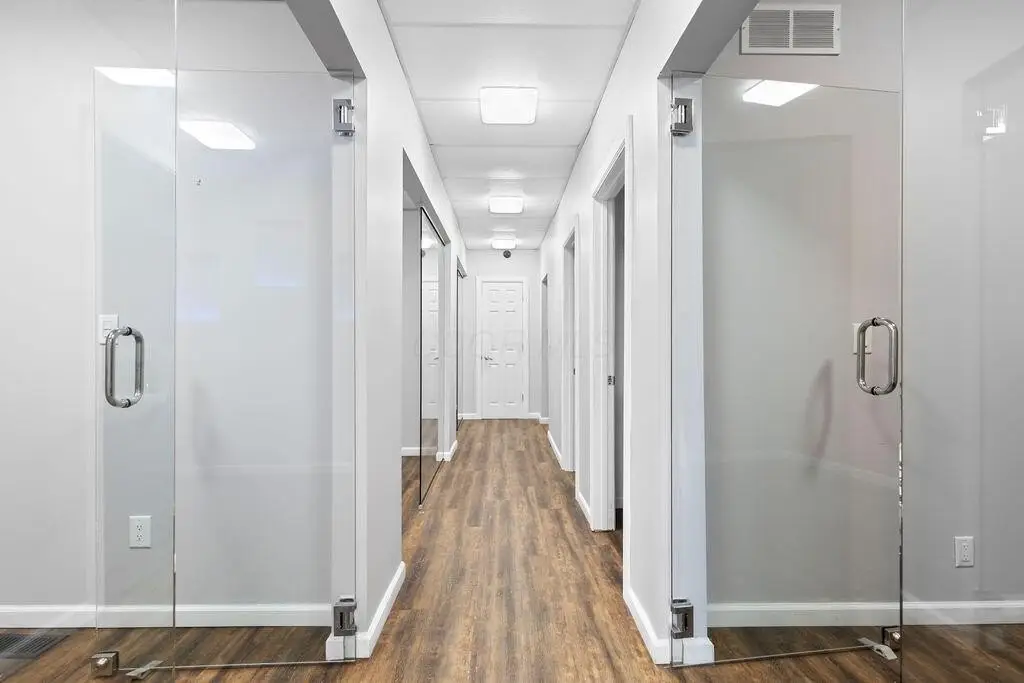
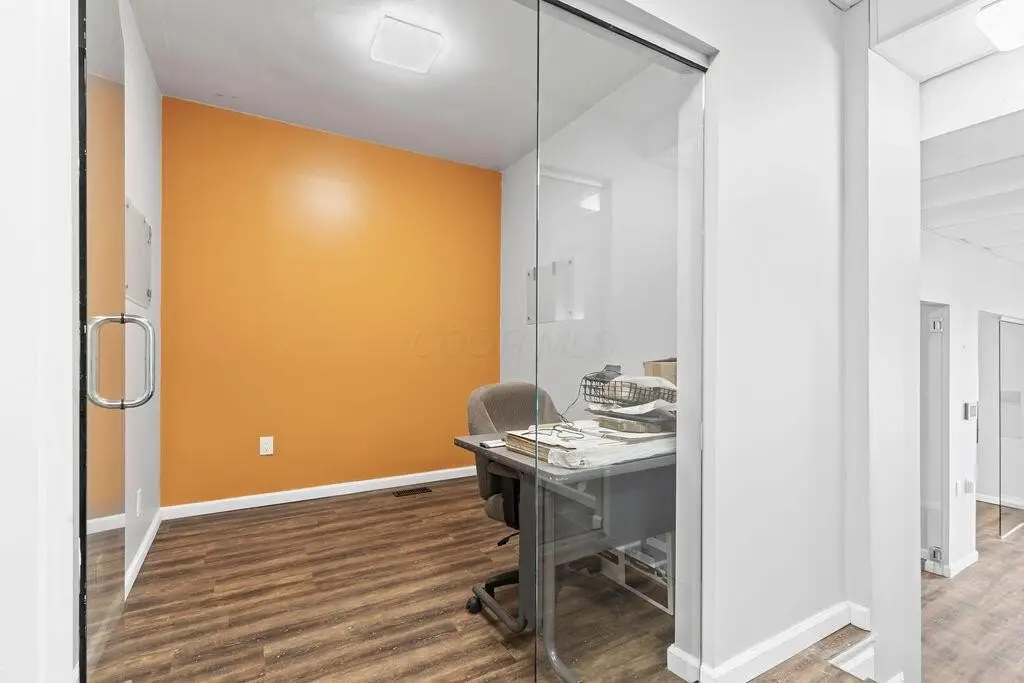
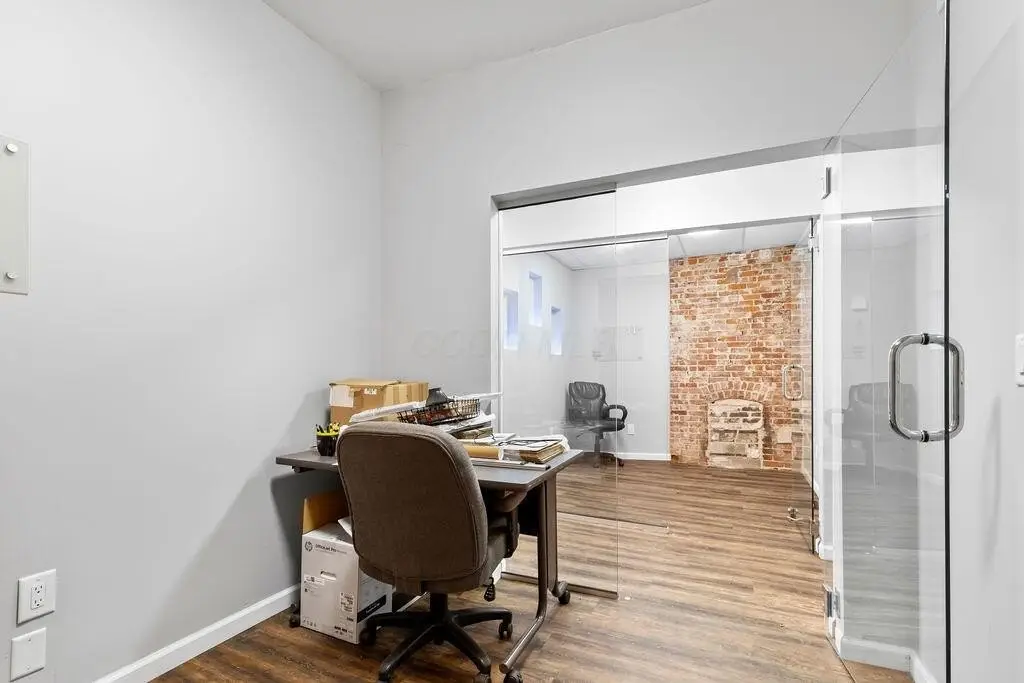
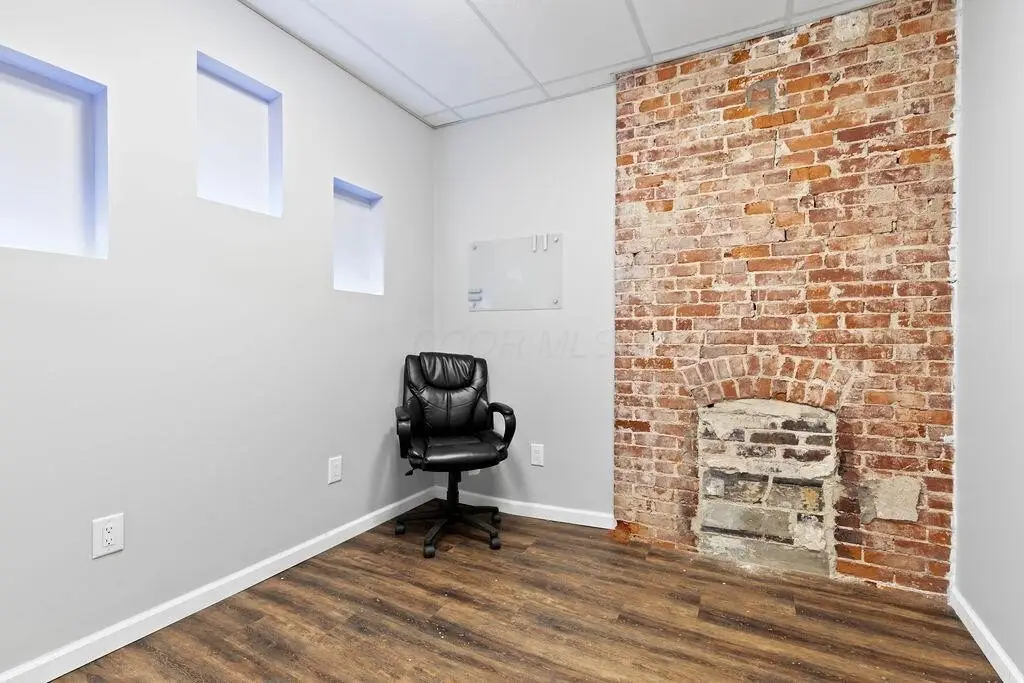
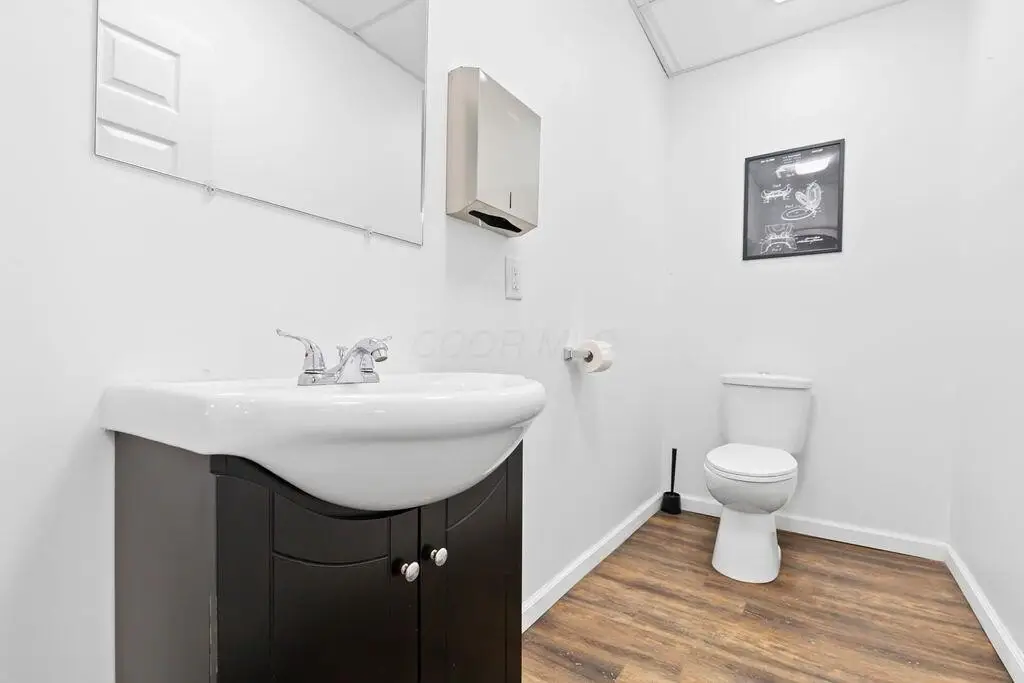
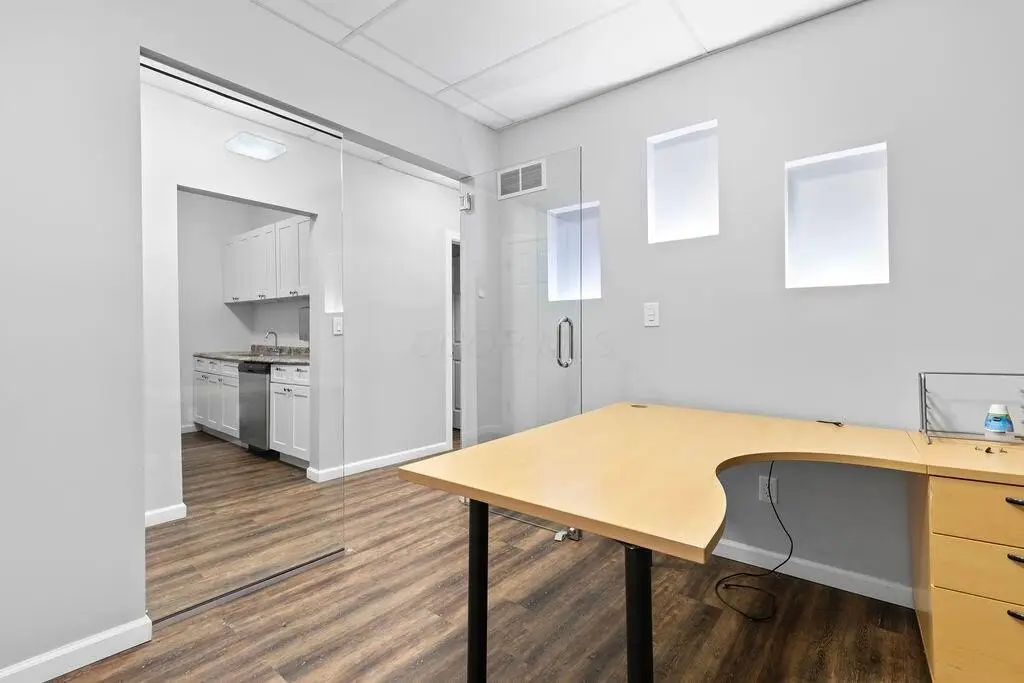
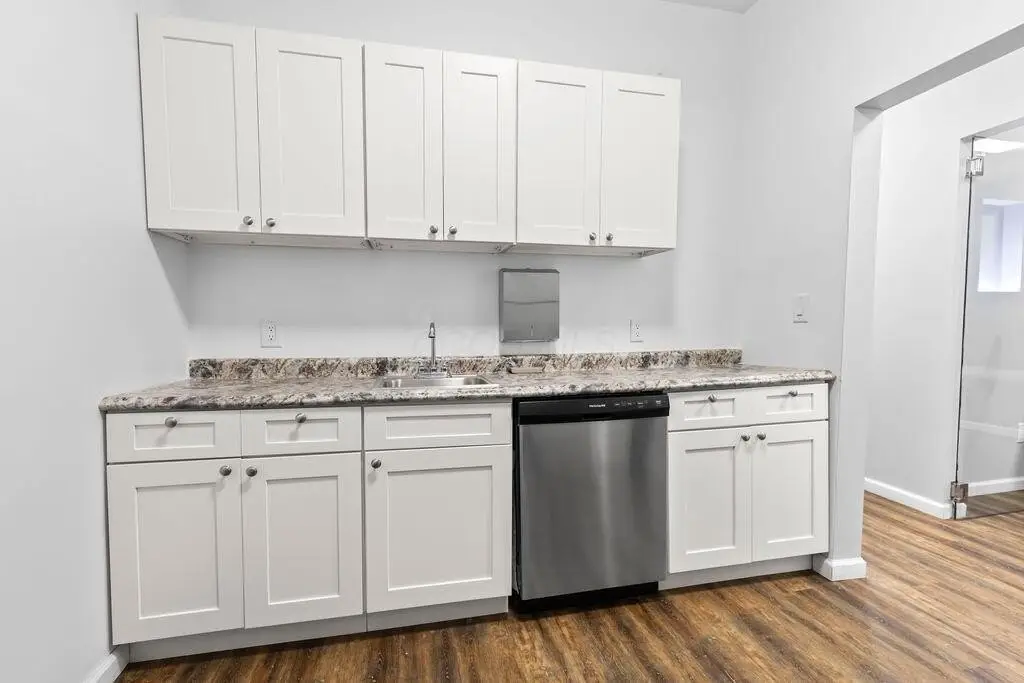
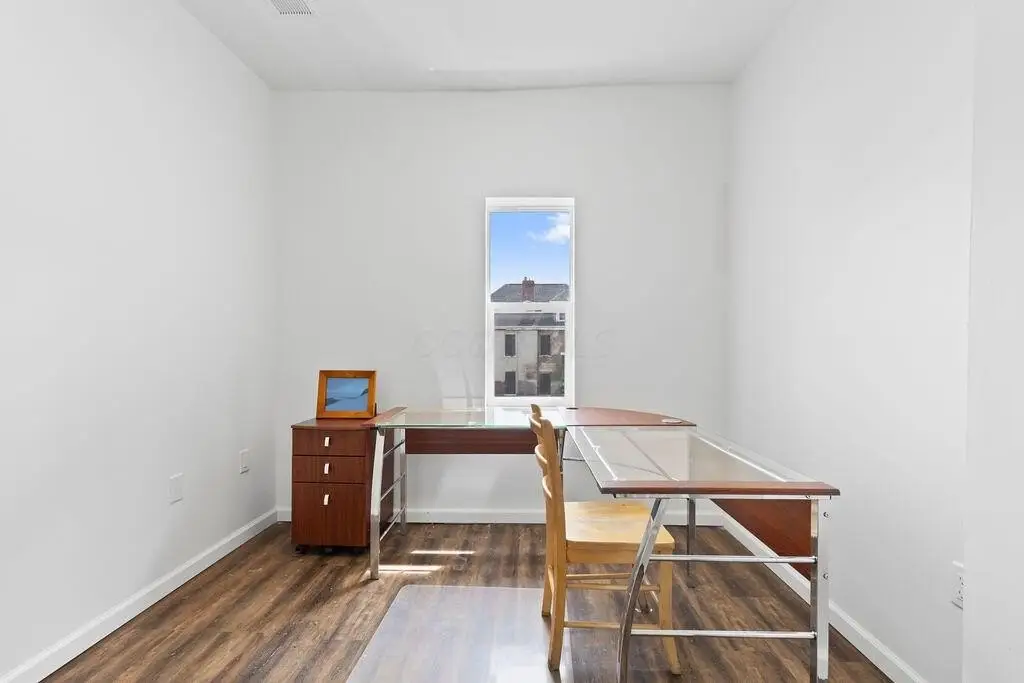
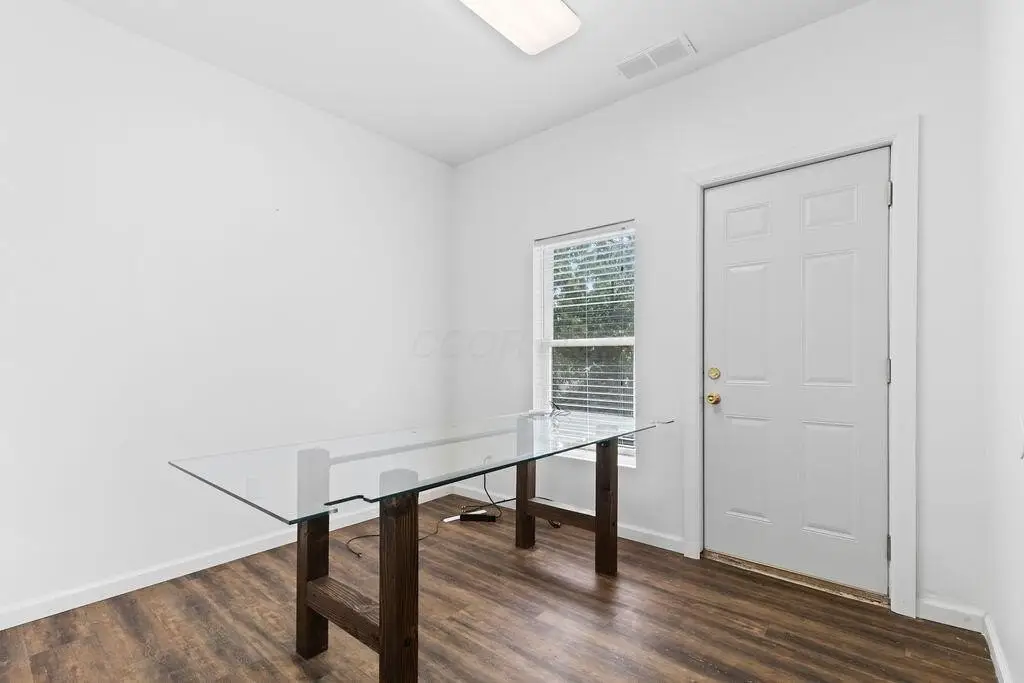
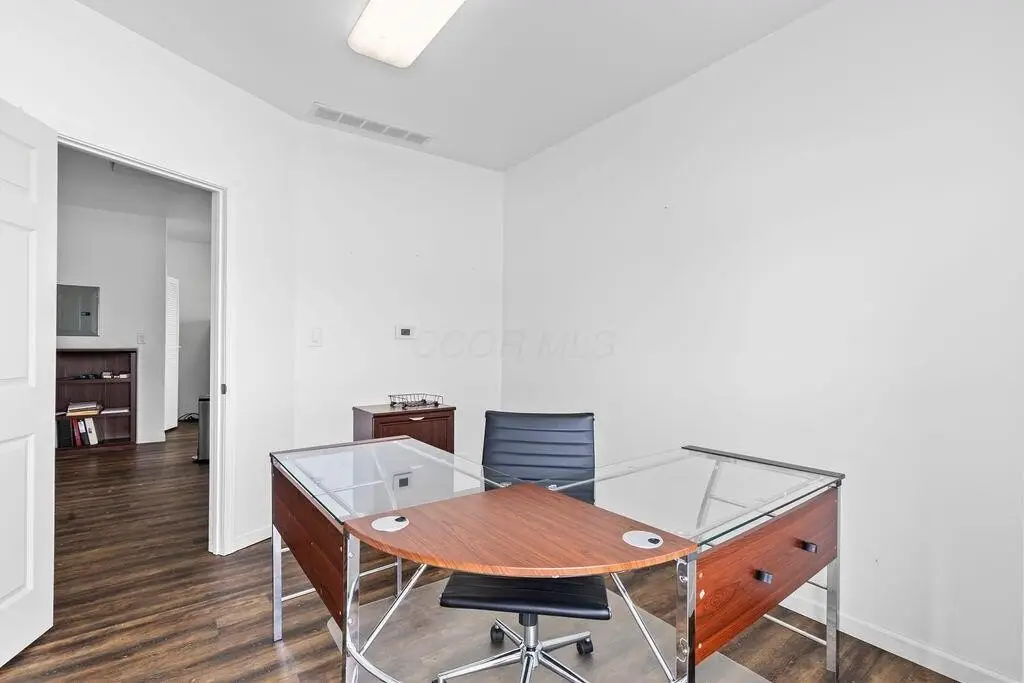
This two-story office building includes two separate suites—one on the first floor and one on the second floor—with separate entrances for each space. The office areas have been tastefully remodeled. The second-floor suite may be converted to residential use, subject to applicable approvals.
Located at 1689 E Main Street near downtown Columbus, the property also conveys with an adjacent 0.08-acre lot to the east. That adjoining lot can be used for private parking, providing additional convenience for occupants and visitors.
The building is offered for sale with both suites and the adjacent lot included in the transaction.
Located at 1689 E Main Street near downtown Columbus, the property also conveys with an adjacent 0.08-acre lot to the east. That adjoining lot can be used for private parking, providing additional convenience for occupants and visitors.
The building is offered for sale with both suites and the adjacent lot included in the transaction.
Key Highlights
- 2‑story office building built in 1915 near downtown Columbus
- Two separate office suites: first‑floor and second‑floor space, each with a separate entrance
- All office space is tastefully remodeled
Financial Insights For Office B
Simulate Cap Rate and NOI
NOI Build-Up
- Vacancy
- income lost from leasable area expected to sit empty during the year — subtracted from gross rent.
- EGI (Effective Gross Income)
- gross rent minus vacancy losses — the realistic income before paying operating costs.
- OpEx (Operating Expenses)
- recurring costs to operate the property (property tax, insurance, utilities, maintenance, management) — excludes financing and capital improvements.
- NOI (Net Operating Income)
- income a property generates after operating costs but before financing and taxes.
| Component | $ | $/SF |
|---|---|---|
| Gross rent | $42.5k | $19.80 |
| − Vacancy | −$9.4k | −$4.40 |
| EGI | $33.0k | $15.40 |
| − OpEx | −$8.3k | −$3.85 |
| NOI | $24.8k | $11.55 |
2,144 SF · lease $19.80/SF/yr · vacancy 22.20% · expense 25.00%
Alternative Uses
Best Use
Office B
$353.9K
$309.6K – $412.8K
NOI $24,770 @ 7.0% cap · market cap 6.21%
Second Best
—
—
no second resolved use
Theoretical Best
Office A
$446.8K
$391.0K – $521.3K
NOI $31,277 @ 7.0% cap · market cap 7.84%
Zoning and permitted uses should be independently verified with local authorities.
Property Analytics
Property Profile
Location Intelligence
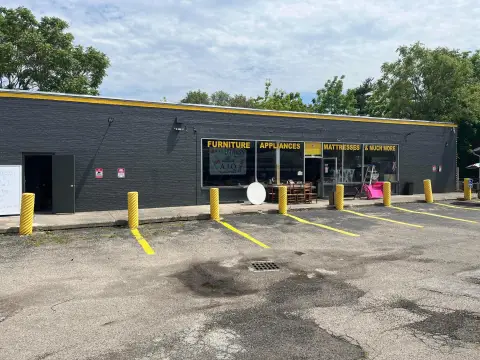
Current Use by Public Records
Stevens Law Firm
Law Firm




FAQs
What type of property is this?
Office building - Two remodeled office suites on separate floors with independent entrances, plus an adjacent lot that can be used for private parking.
Where is this office building located?
The property is located at 1689 E Main Street Columbus, OH.
What is the asking price?
The asking price for this property is $399,000.
What are key features of this property?
This property features: 2‑story office building built in 1915 near downtown Columbus; Two separate office suites: first‑floor and second‑floor space, each with a separate entrance; All office space is tastefully remodeled