Mixed-Use Retail and Office
1659 Route 9 Clifton Park, NY 12065
New
For Sale
$995,000
COMMERCIAL - Other - Clifton Park, NY
Property Size4,584 SF
Lot Size0.66 Acres
Price / SF$217.06
Days on Market1
Property Features for 1659 Route 9
General Information
Property type
Commercial Sale
Property subtype
Retail
Zoning
Commercial
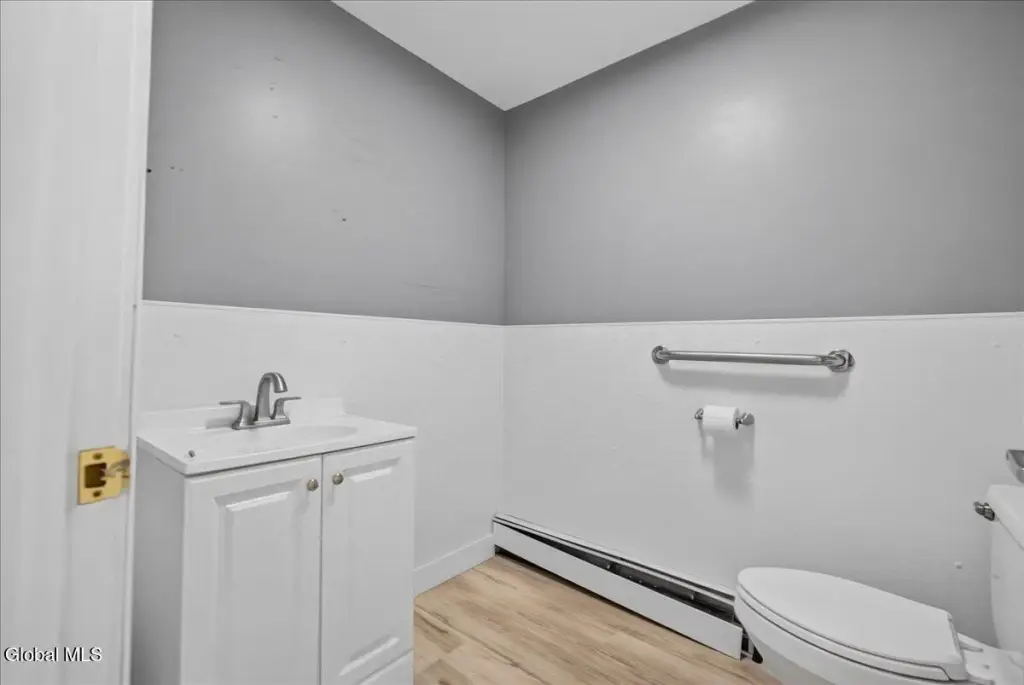
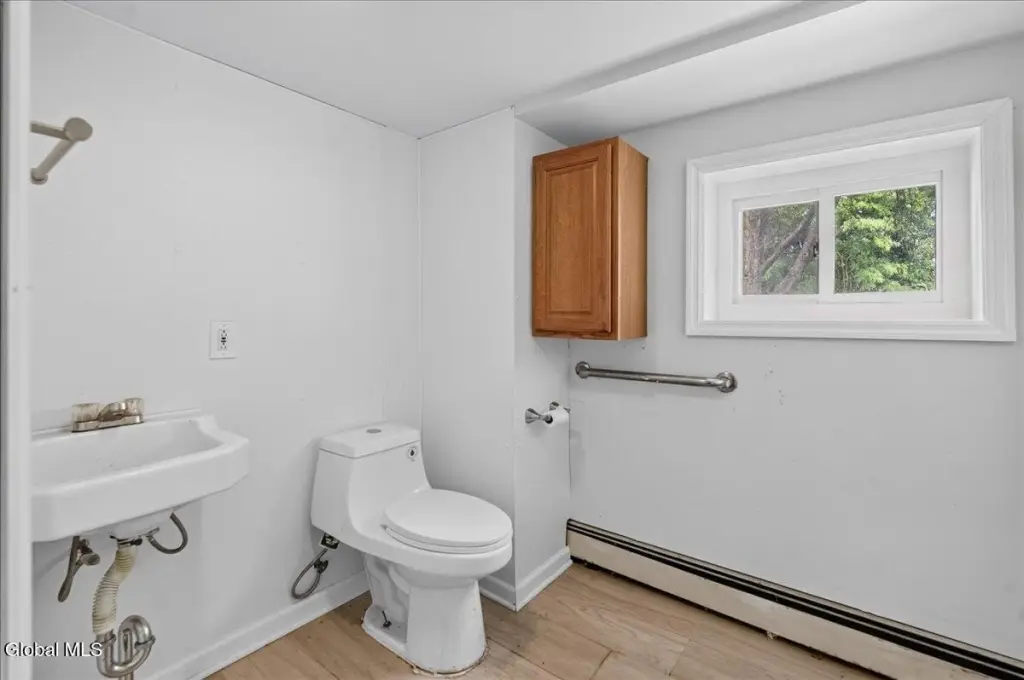
Bathrooms
2
Rooms
Bathroom 2, Bathroom 1
Parking
25
Parking features
Off Street
Interior features
Built-in Features
Basement
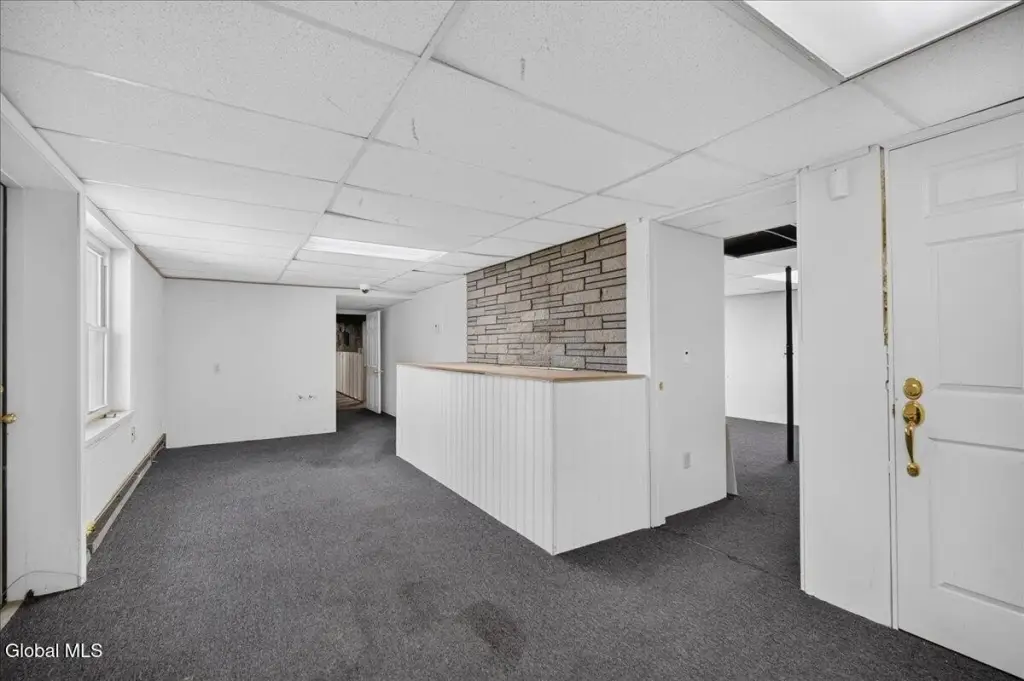
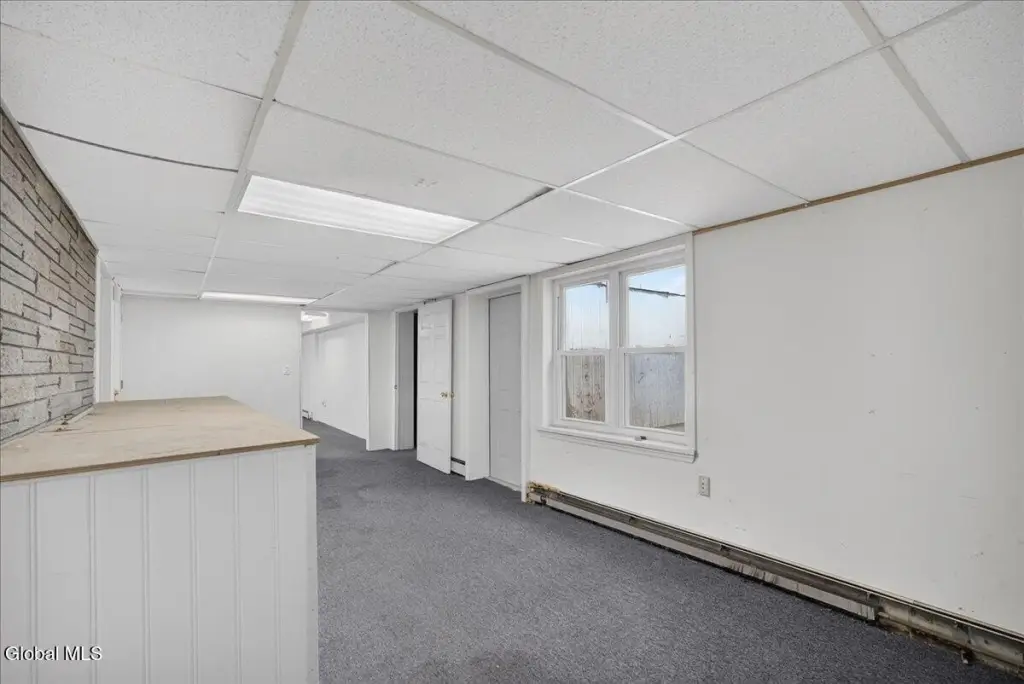
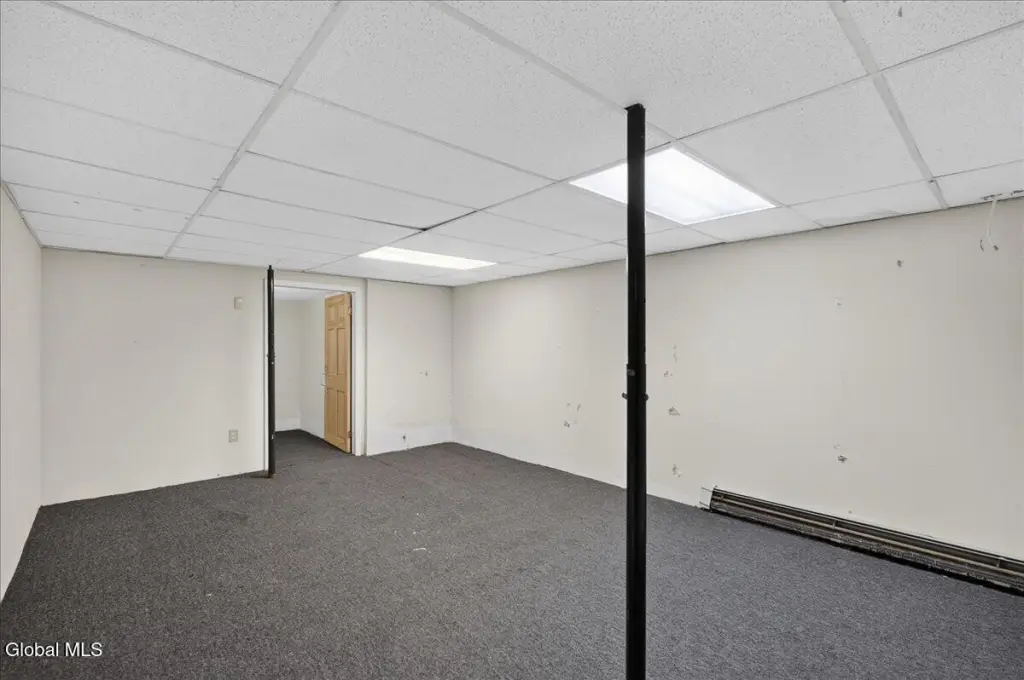
Exterior Entry, Full, Walk-Out Access, Finished, Interior Entry
Standard status
Active
APN
413800 272.-2-20
Size
4,584 SF
Lot size
0.66 Acres
Taxes and HOA fees
Tax Annual Amount
7291
Utilities
Sewer type
Septic Tank
Heating system
Baseboard, Zoned, Natural Gas, Hot Water(Heating)
Cooling system
Central Air
Water source
Public
Building Details
Year built
1965
Floors in Building
2
Flooring type
Tile, Carpet
Building materials
Tex 11 Siding, Wood Siding
Roof type
Shingle, Asphalt
Architectural style
Other
Listing Agency:
REMAX Solutions
(518) 318-3800
Listed By:
Ferdinando Bruno · License #10491208177
(518) 225-3538
Added: Jul 27
Last Checked: Jul 27 at 5:06PM
MLS# 202622685
Copyright © 2026 Global MLS, Inc. All rights reserved. All information provided by the listing agent/broker is deemed reliable but is not guaranteed and should be independently verified.
Investment Insights
Based on property information with market context.
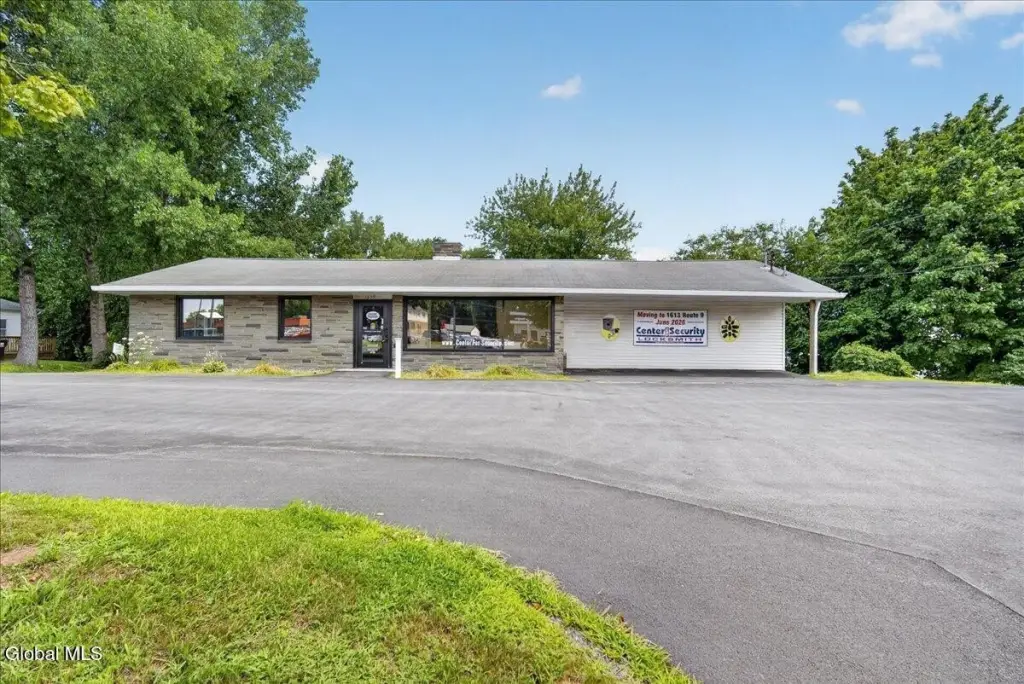
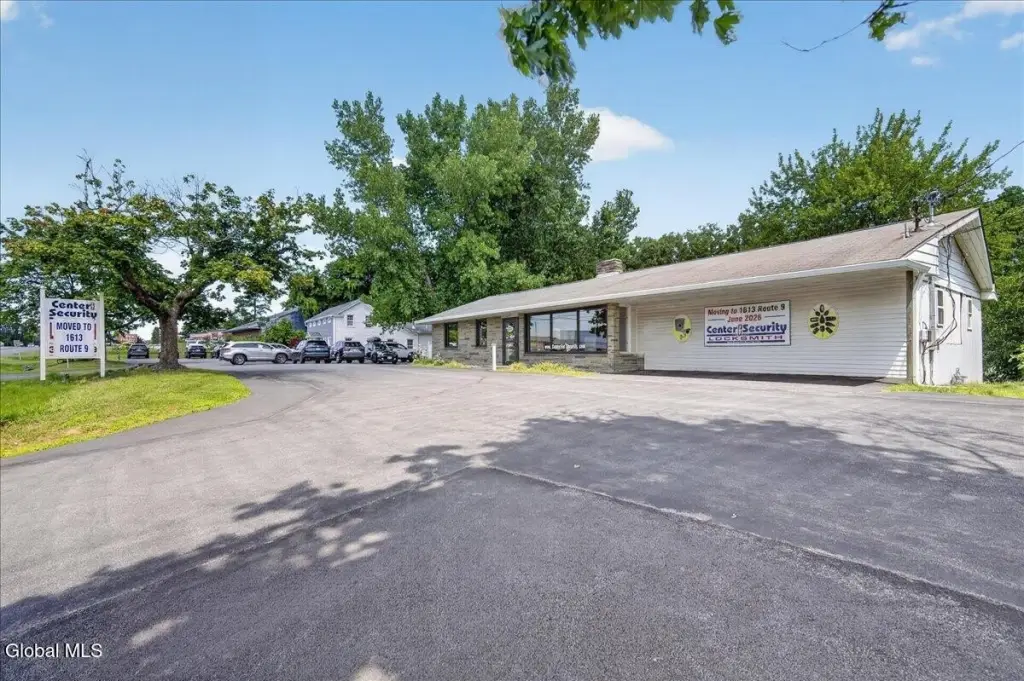
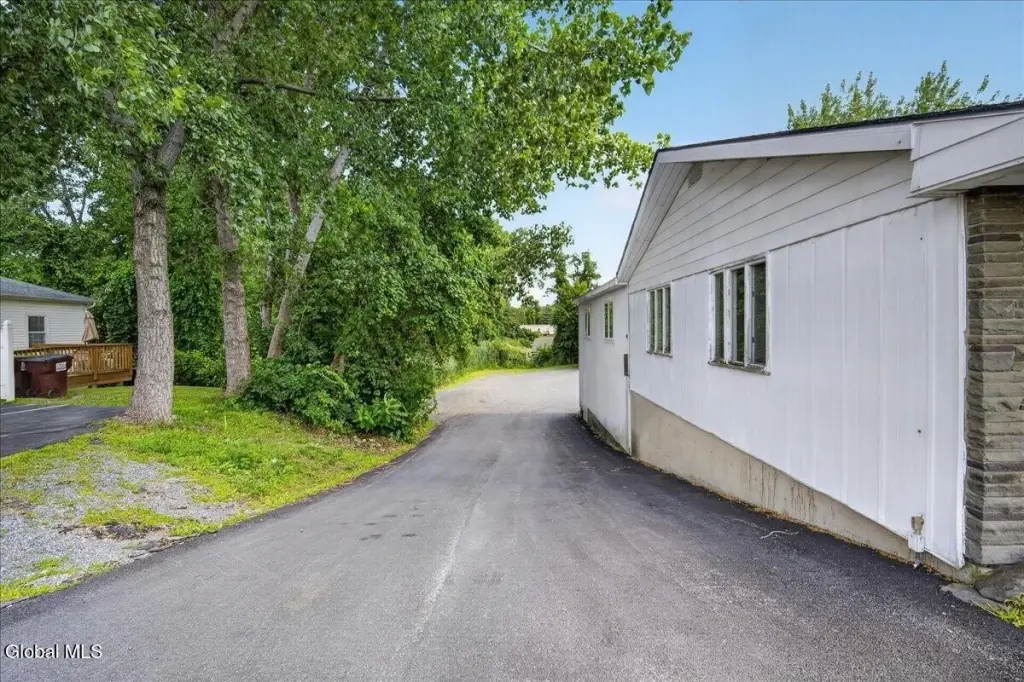
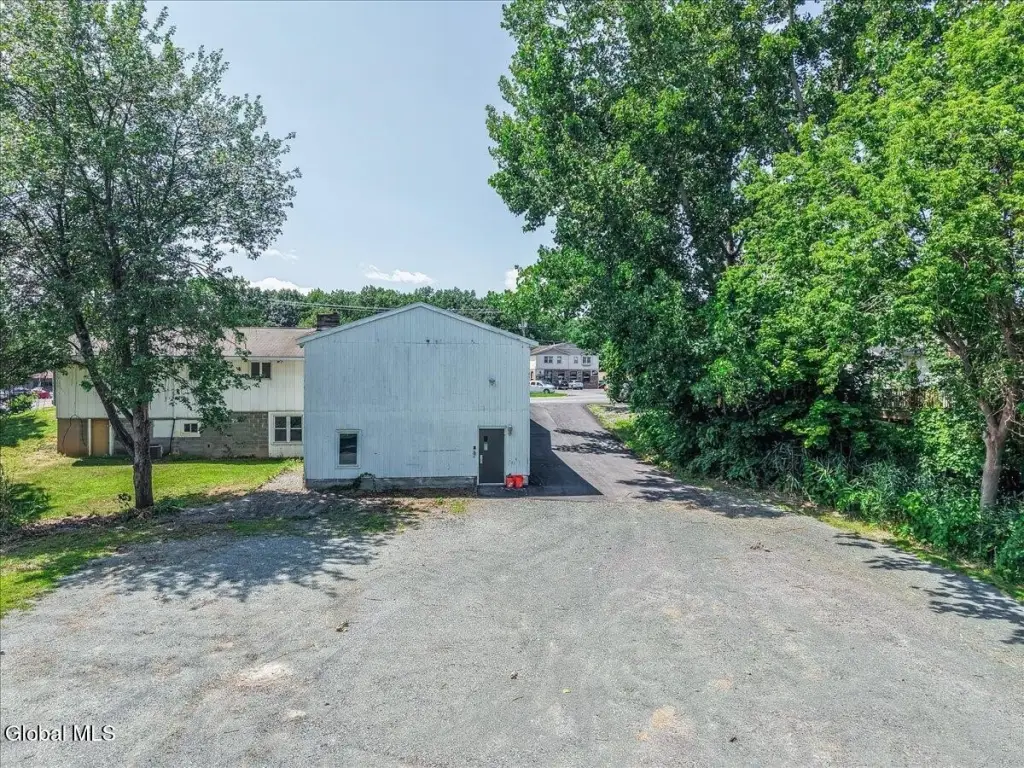
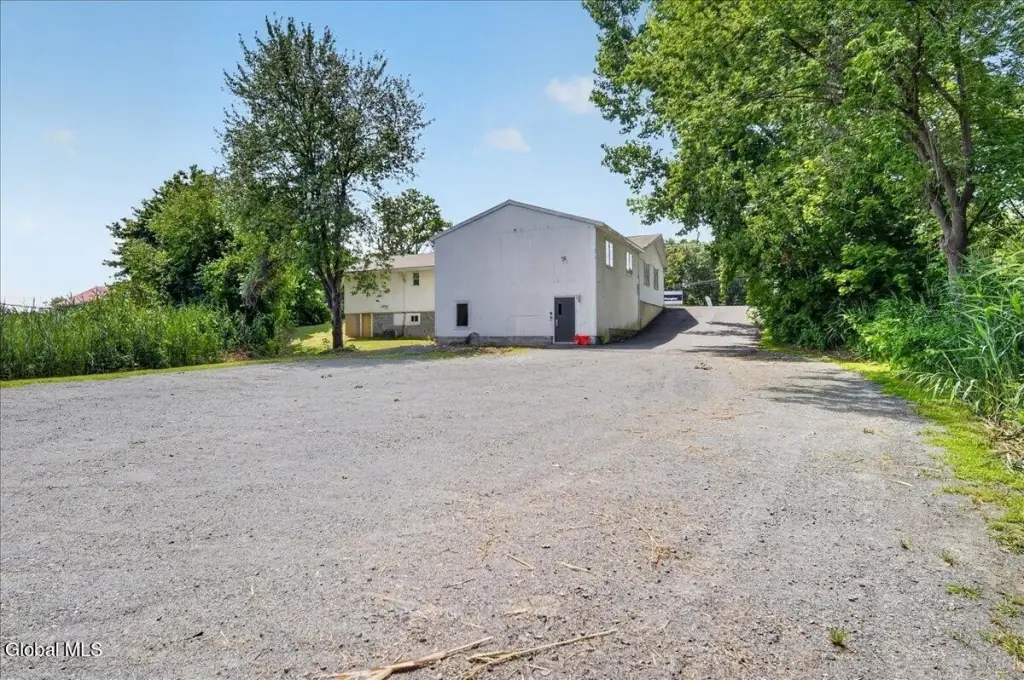
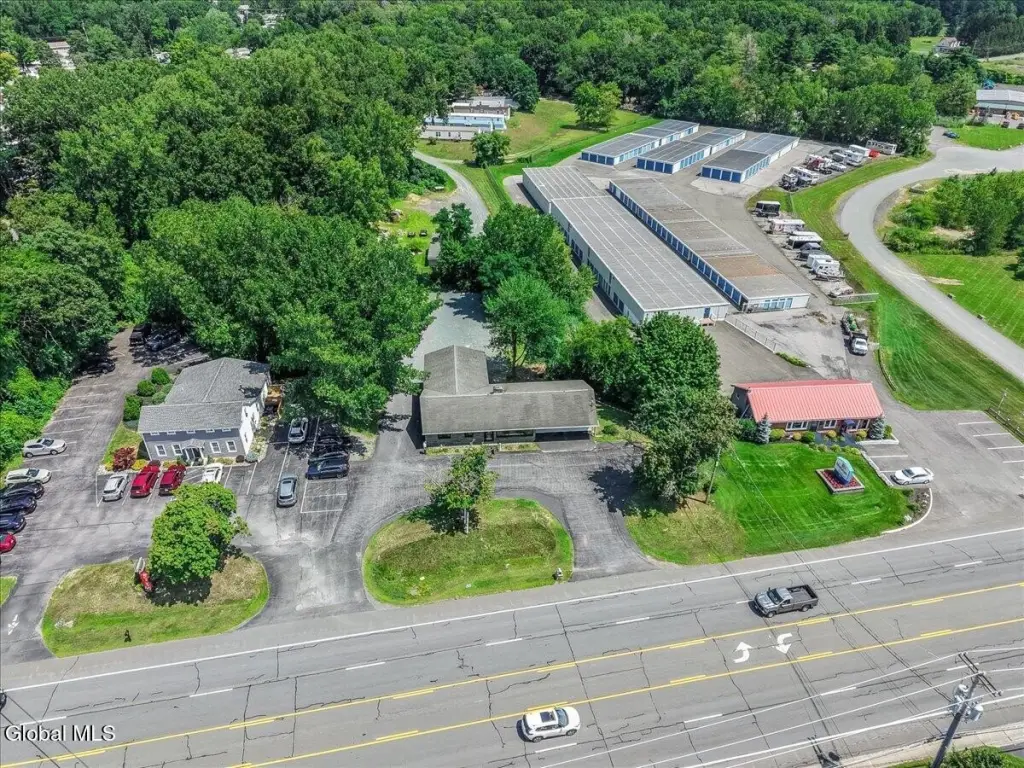
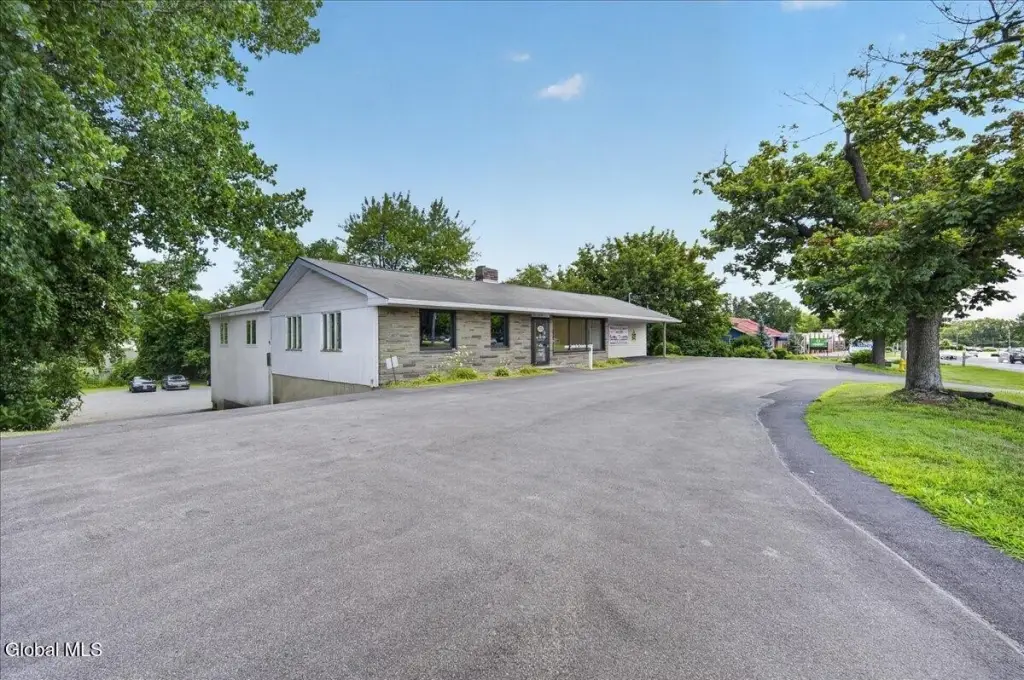
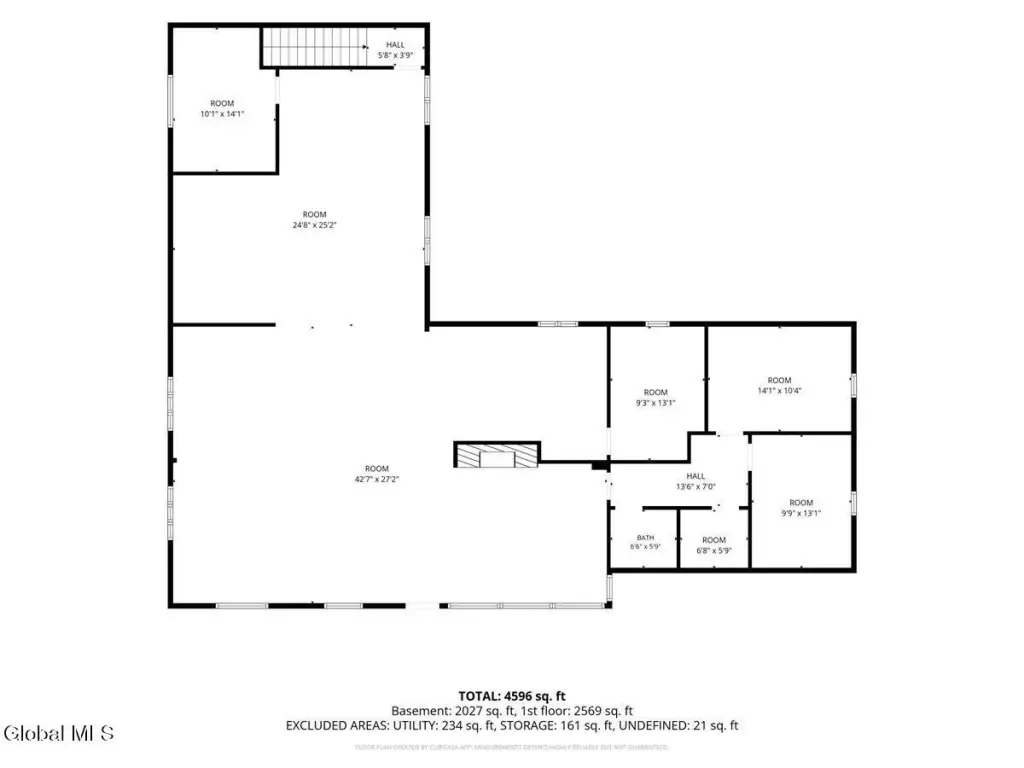
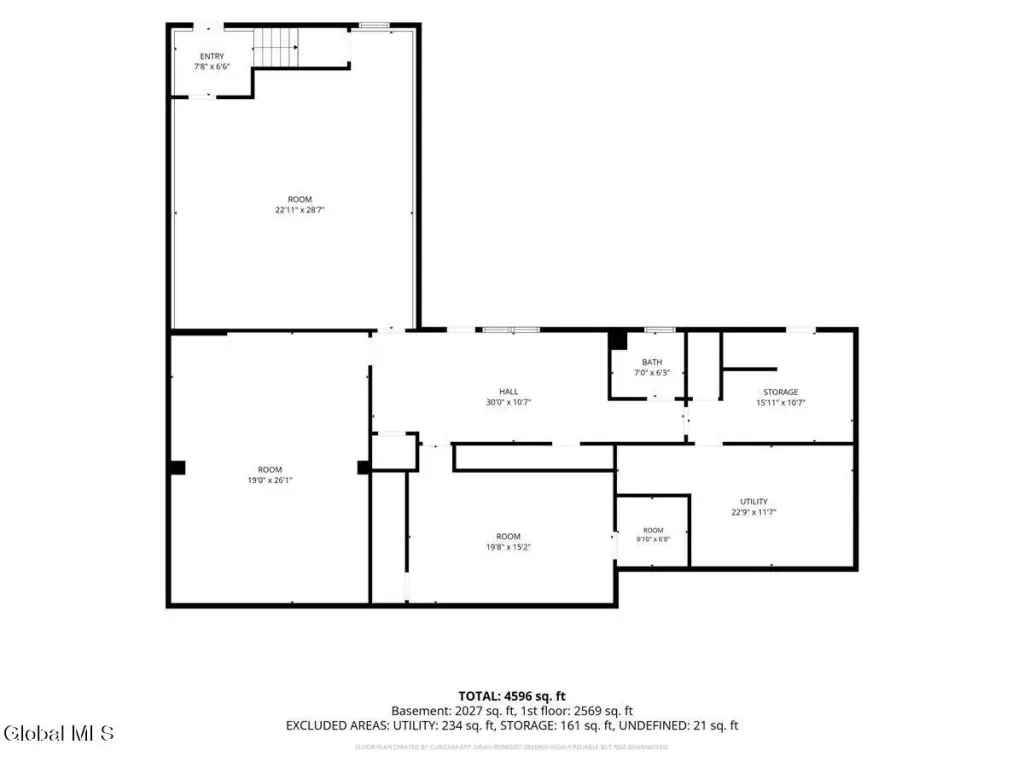
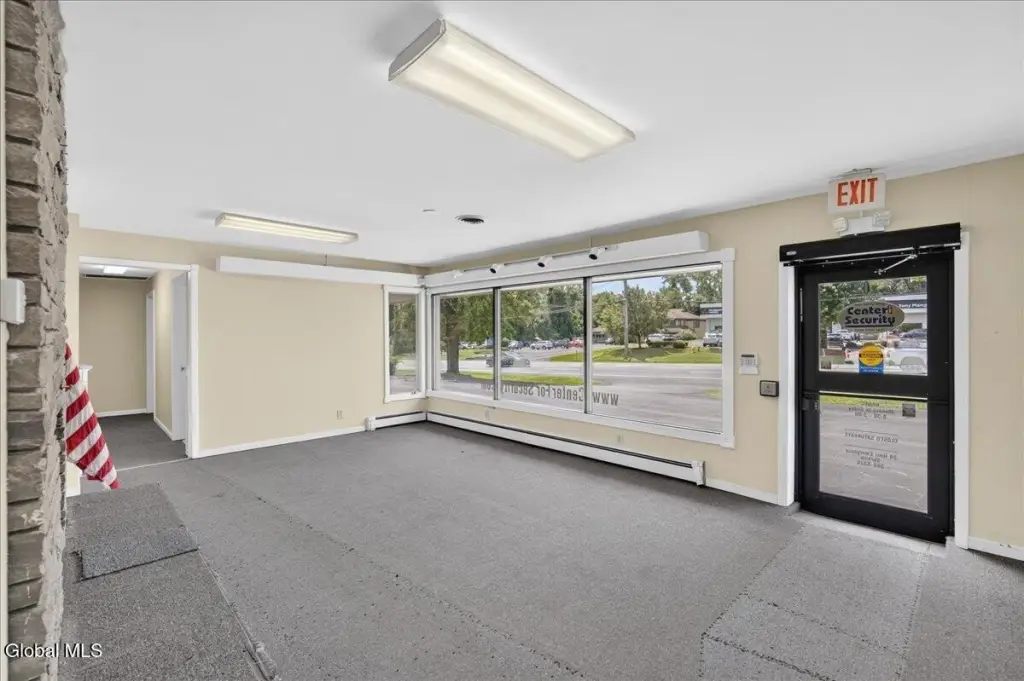
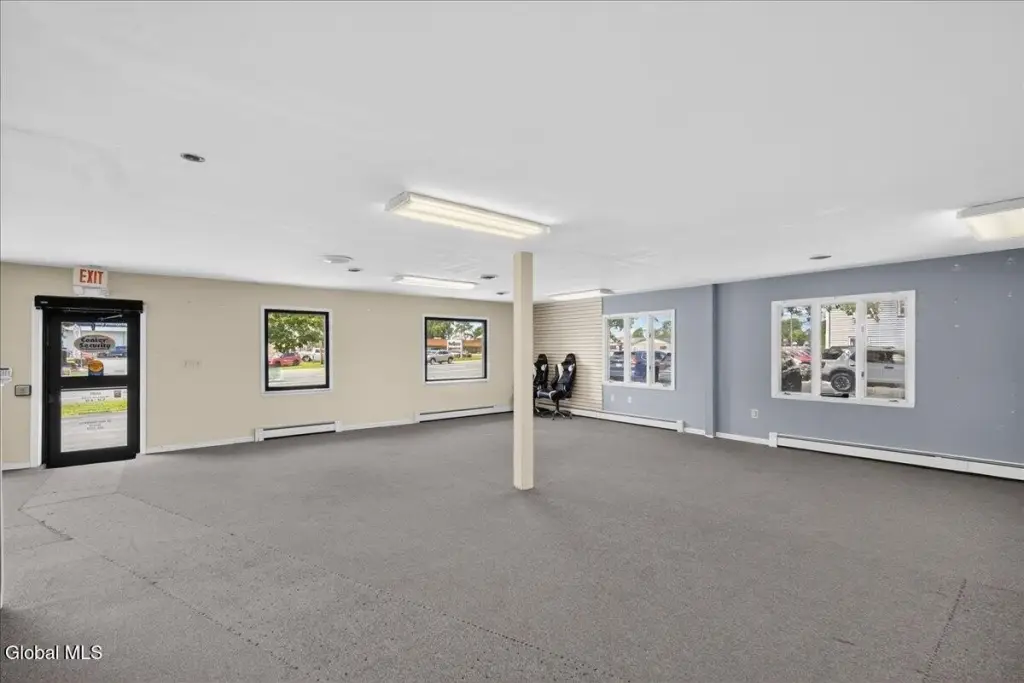
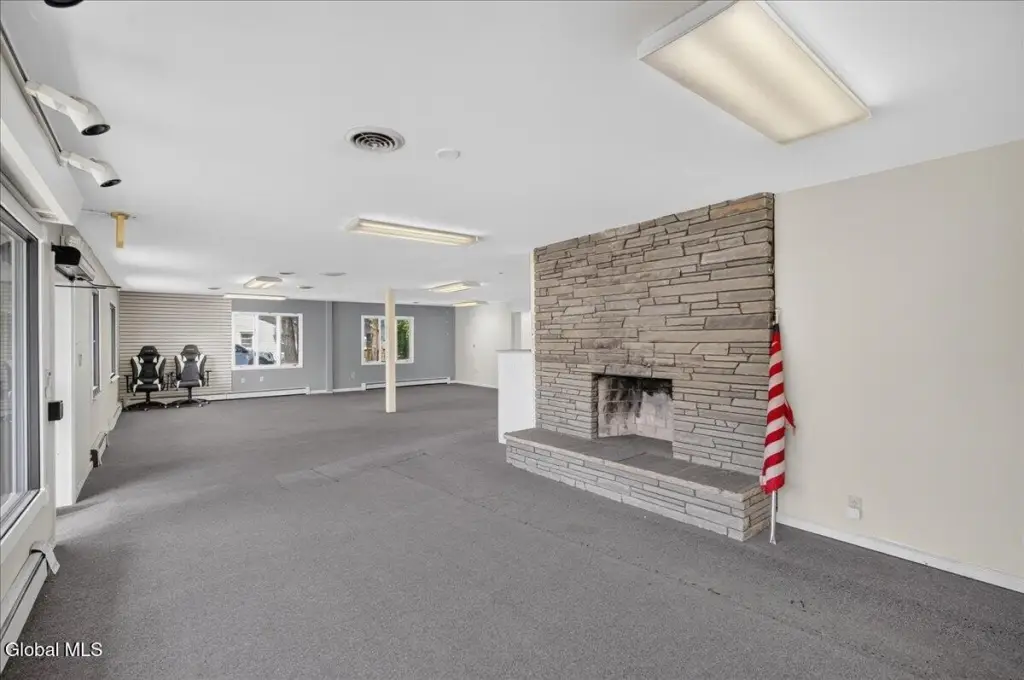
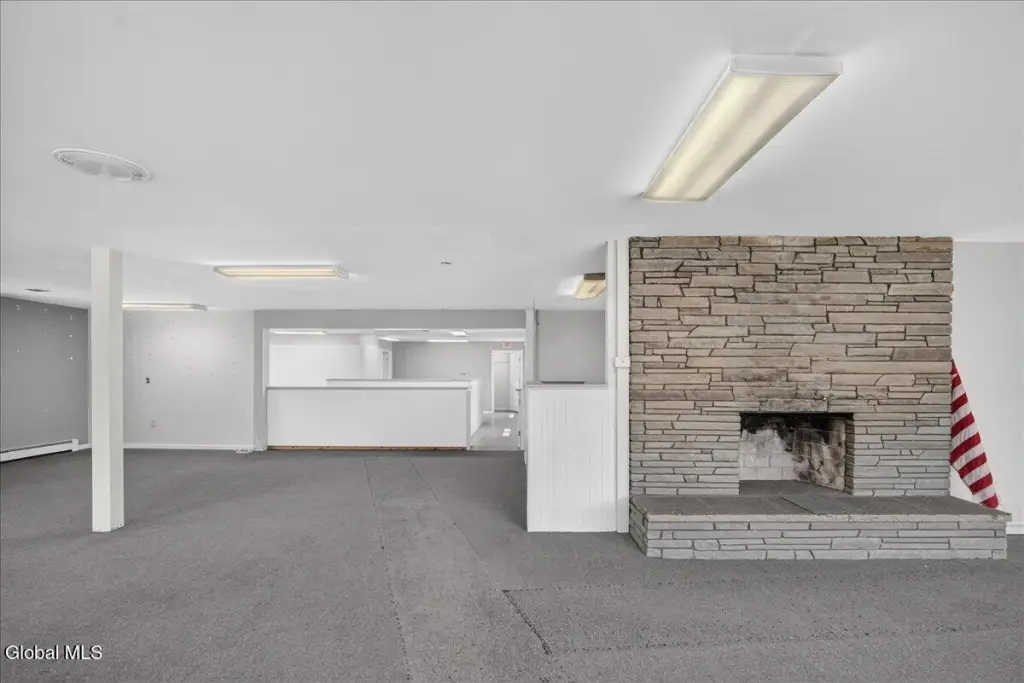
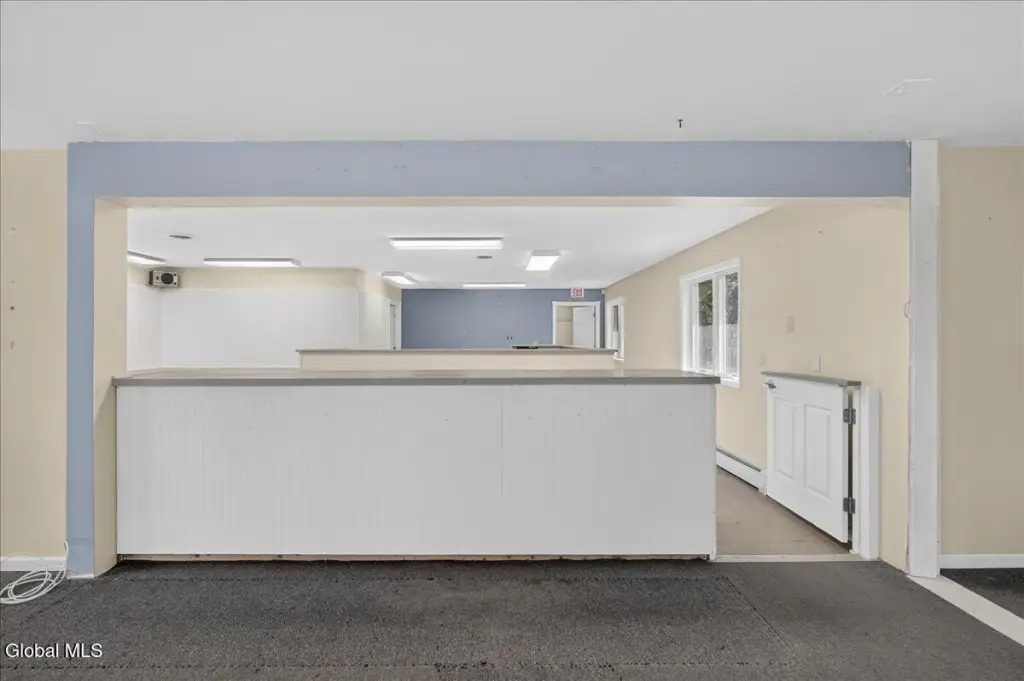
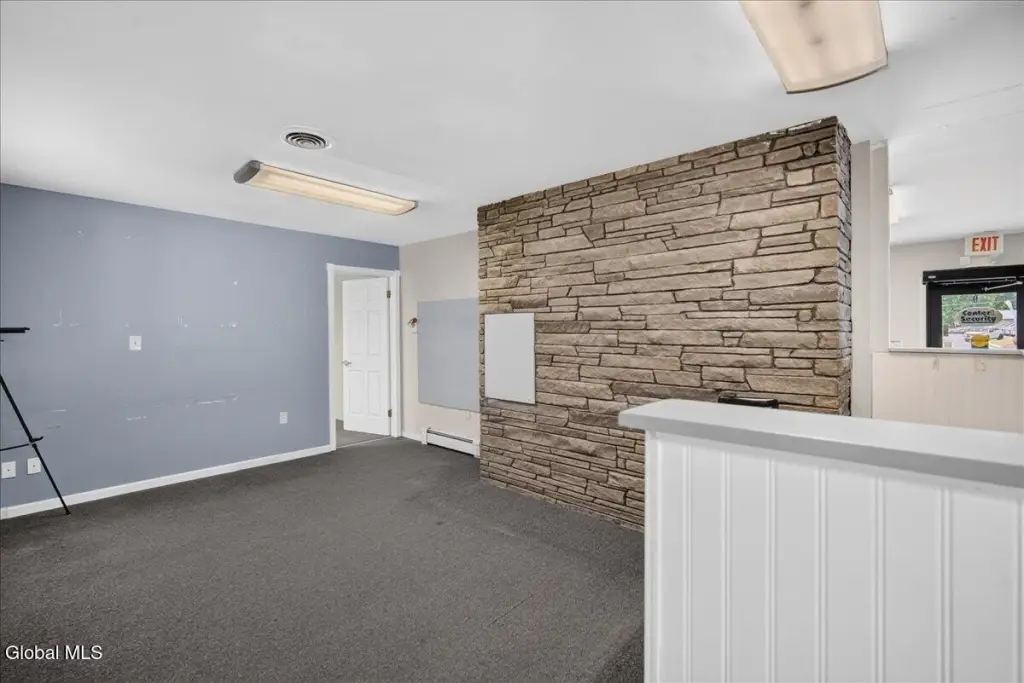
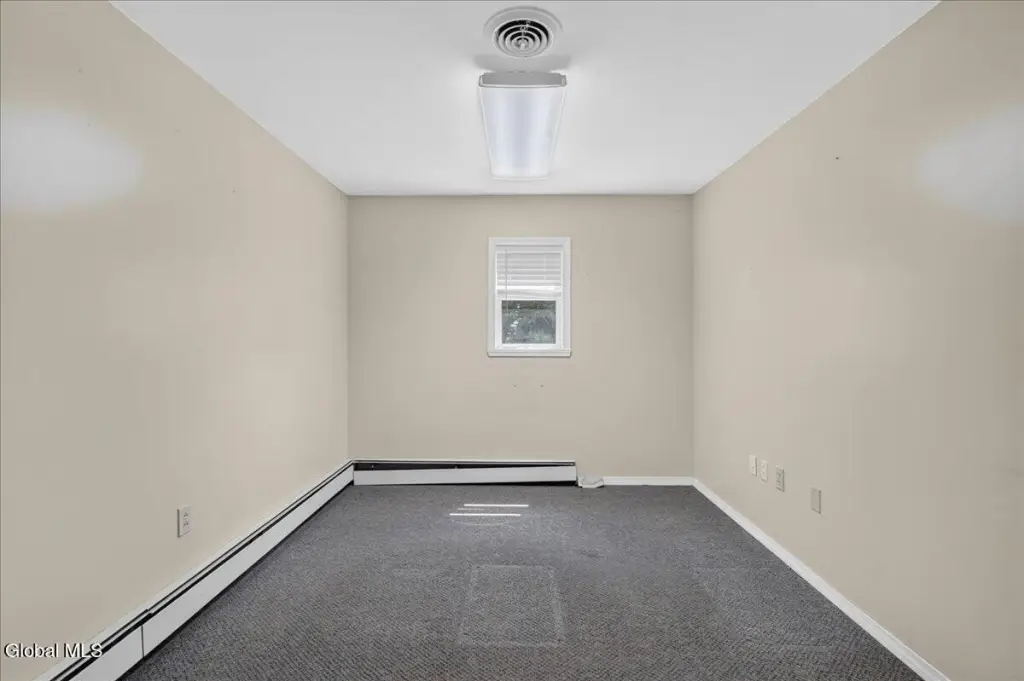
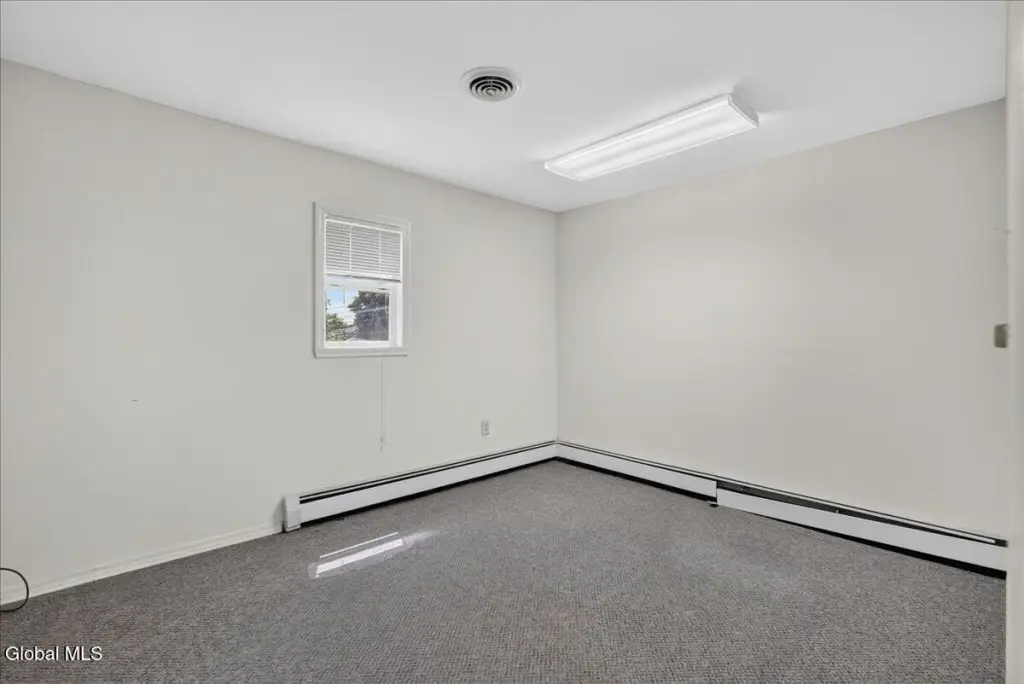
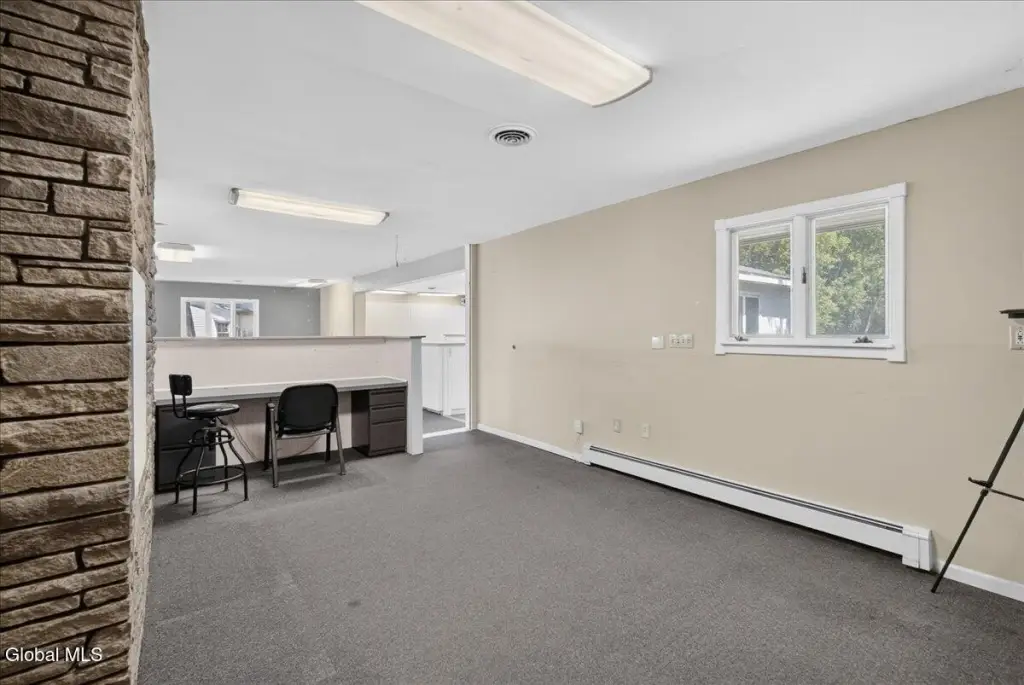
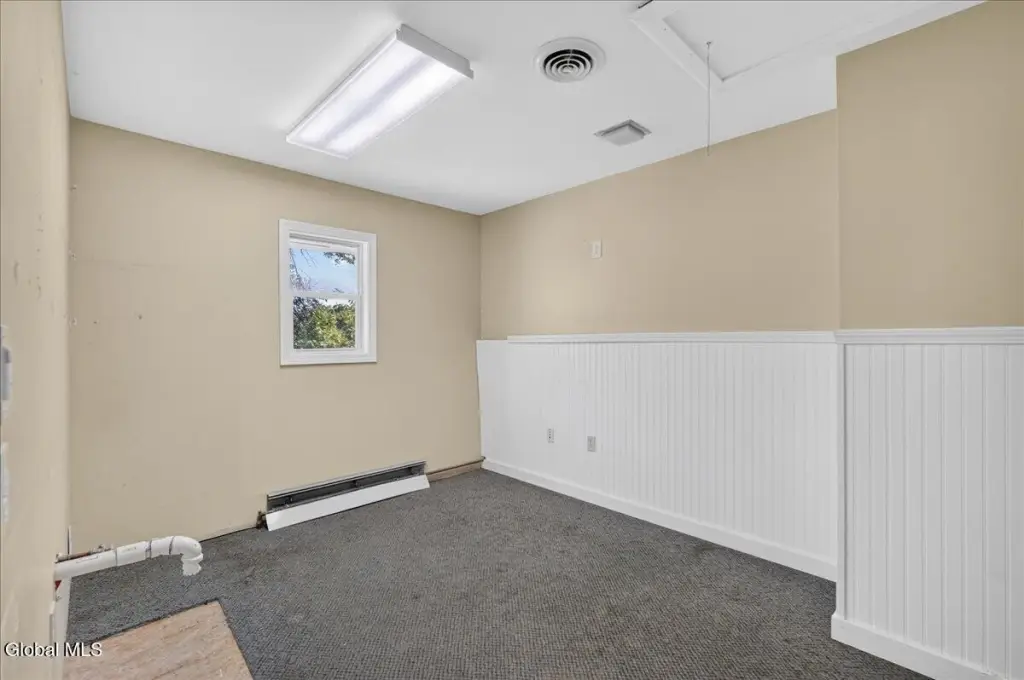
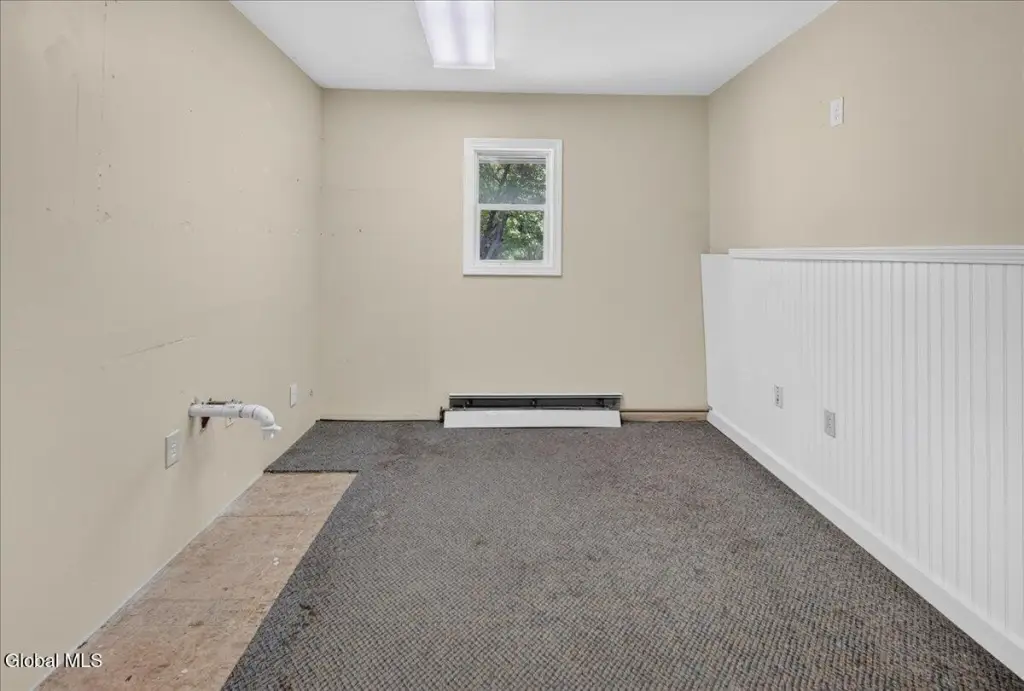
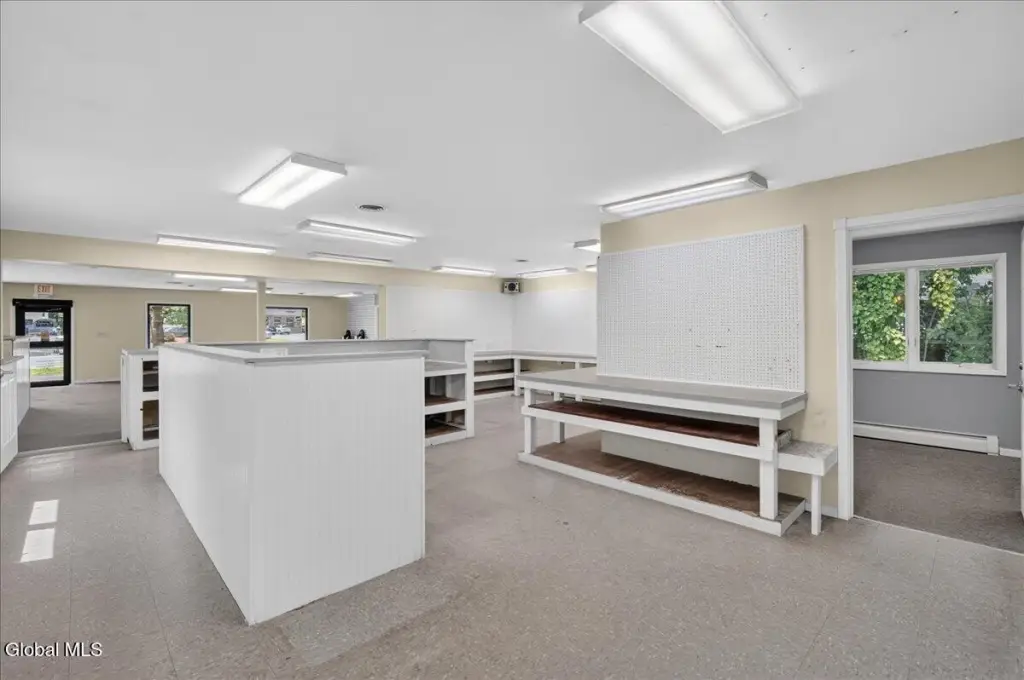
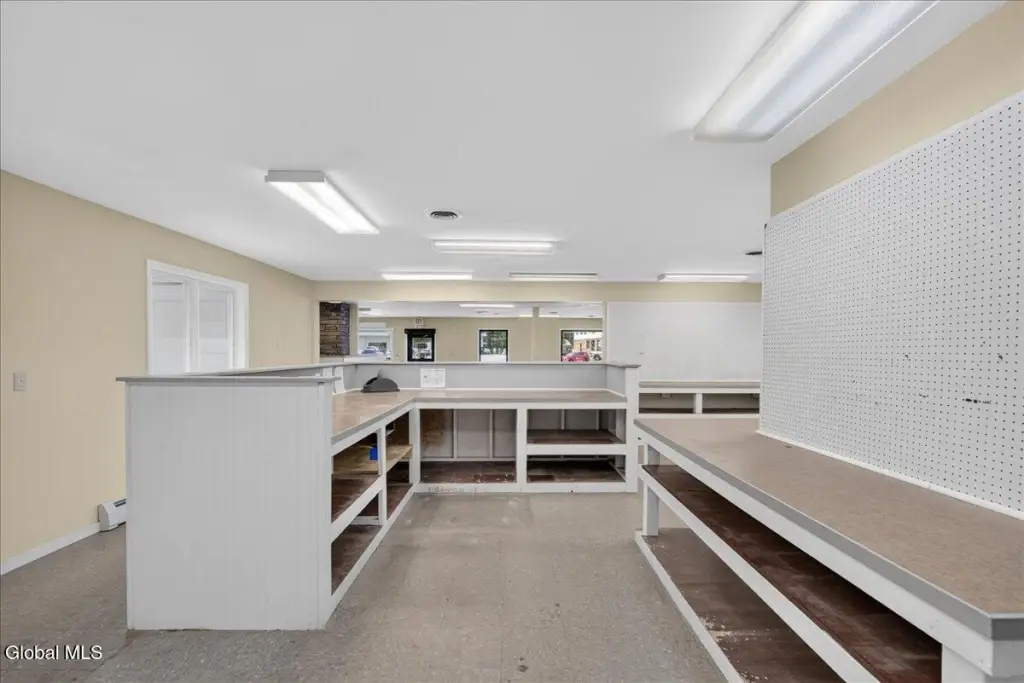
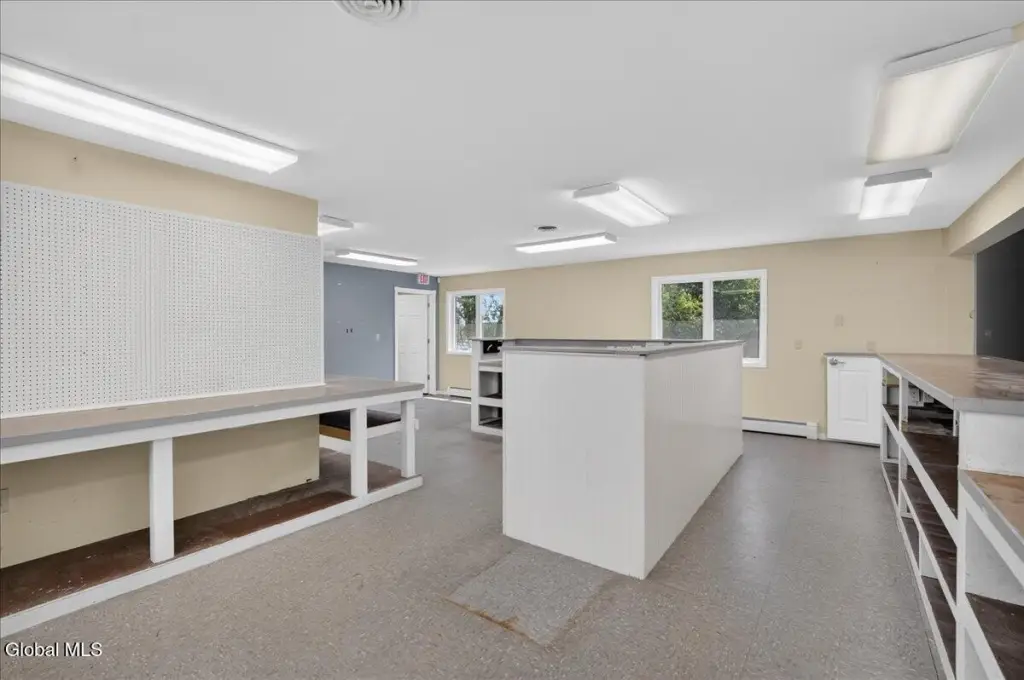
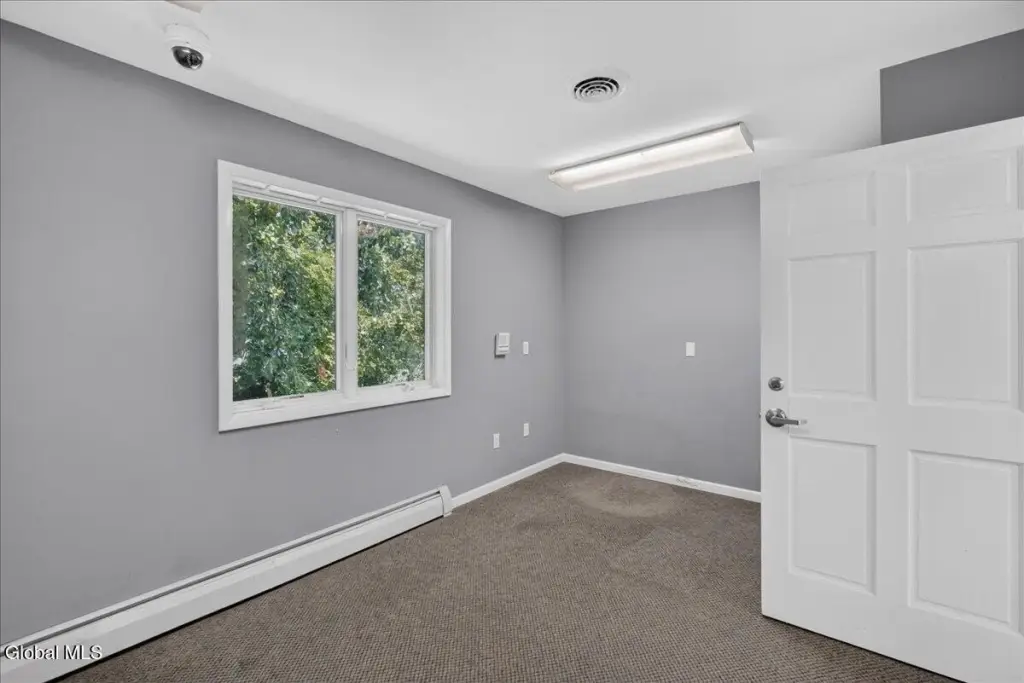
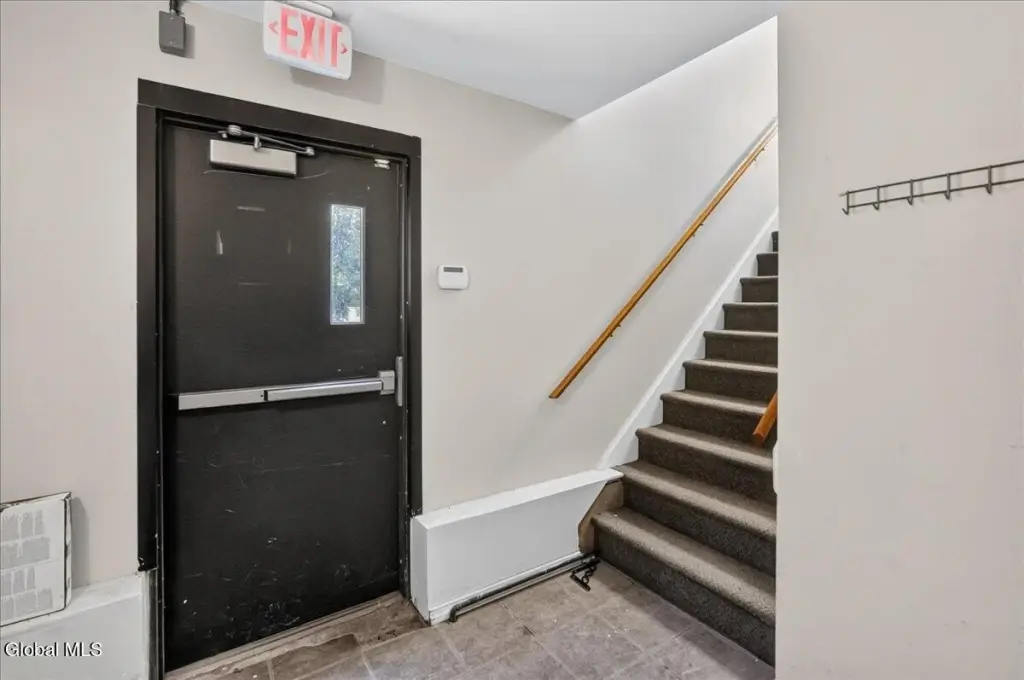
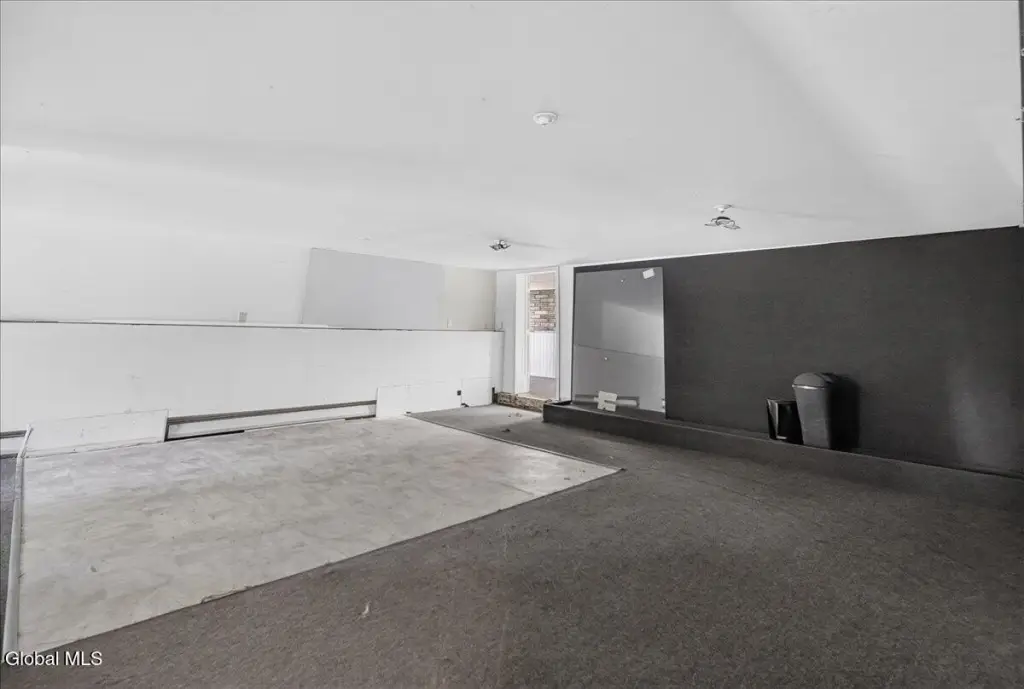
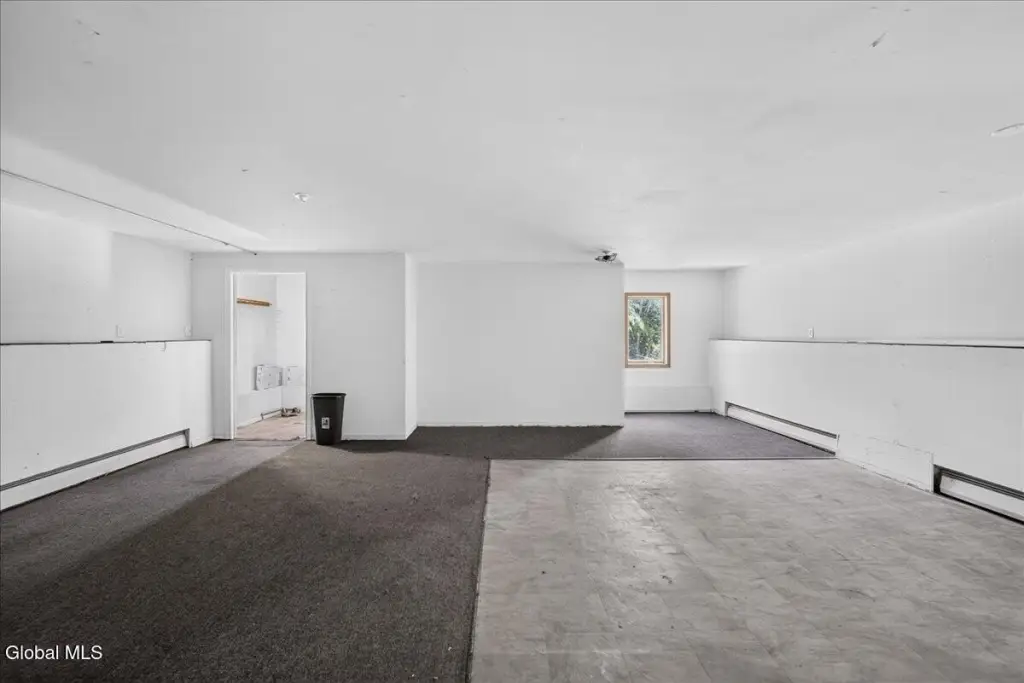
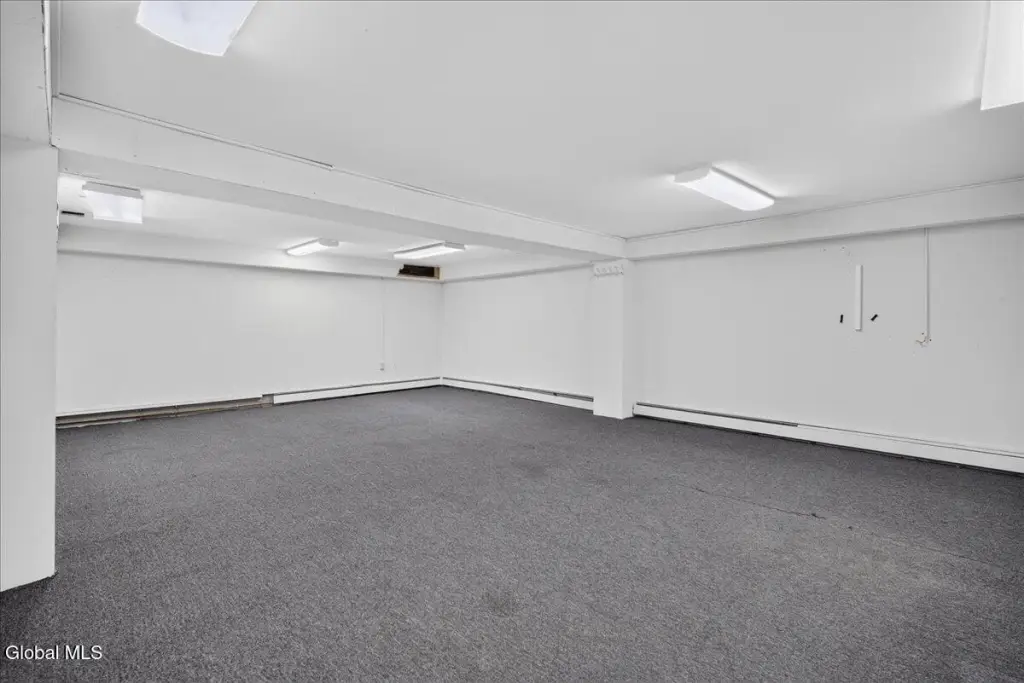
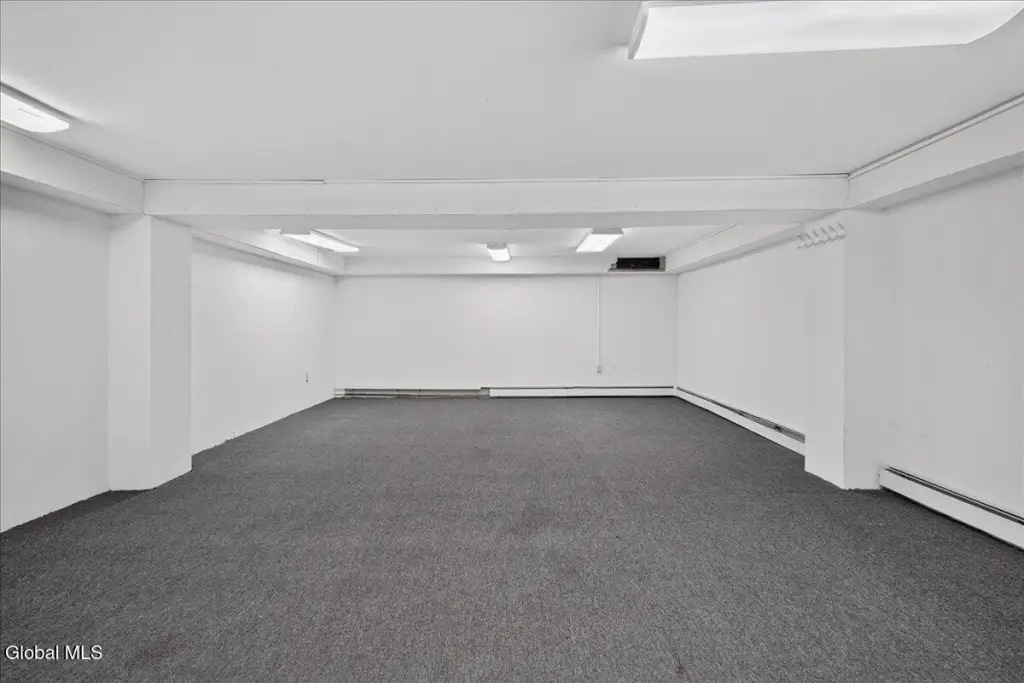
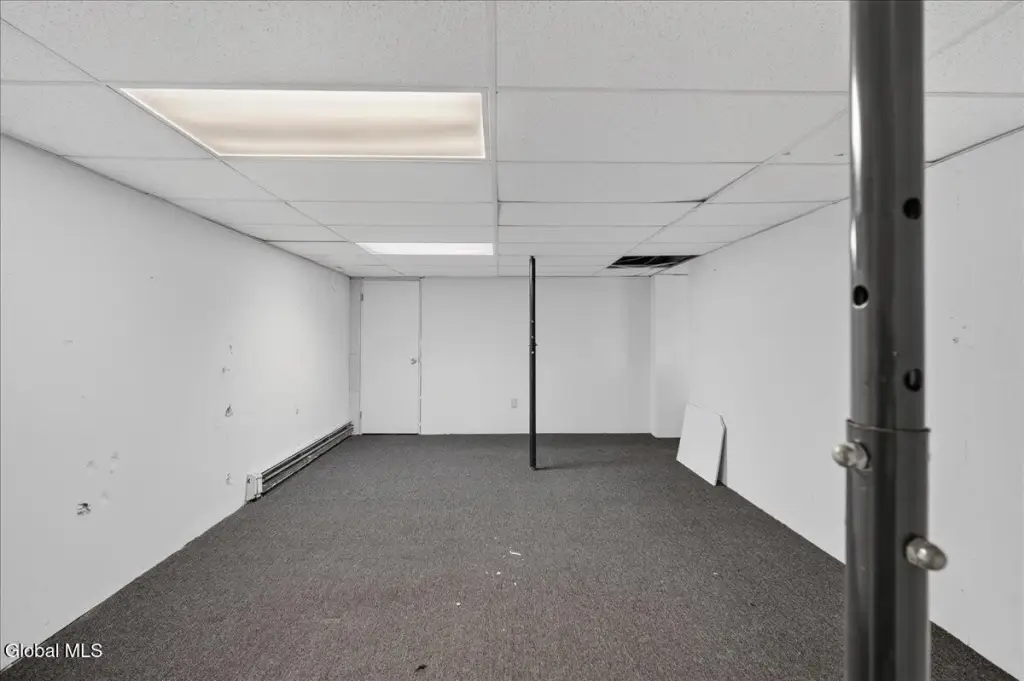
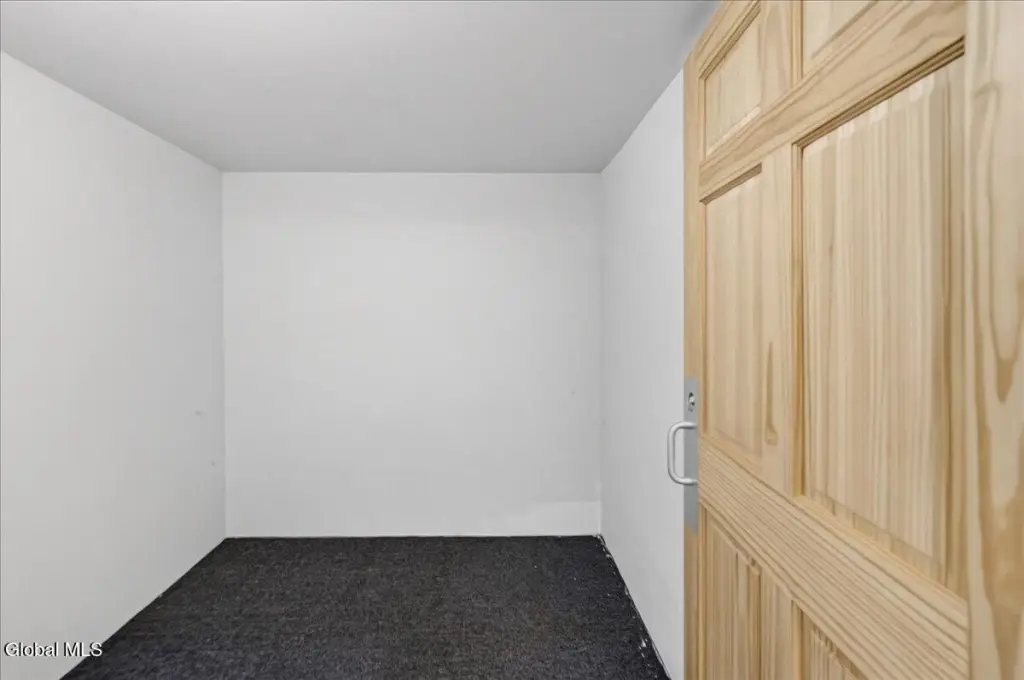
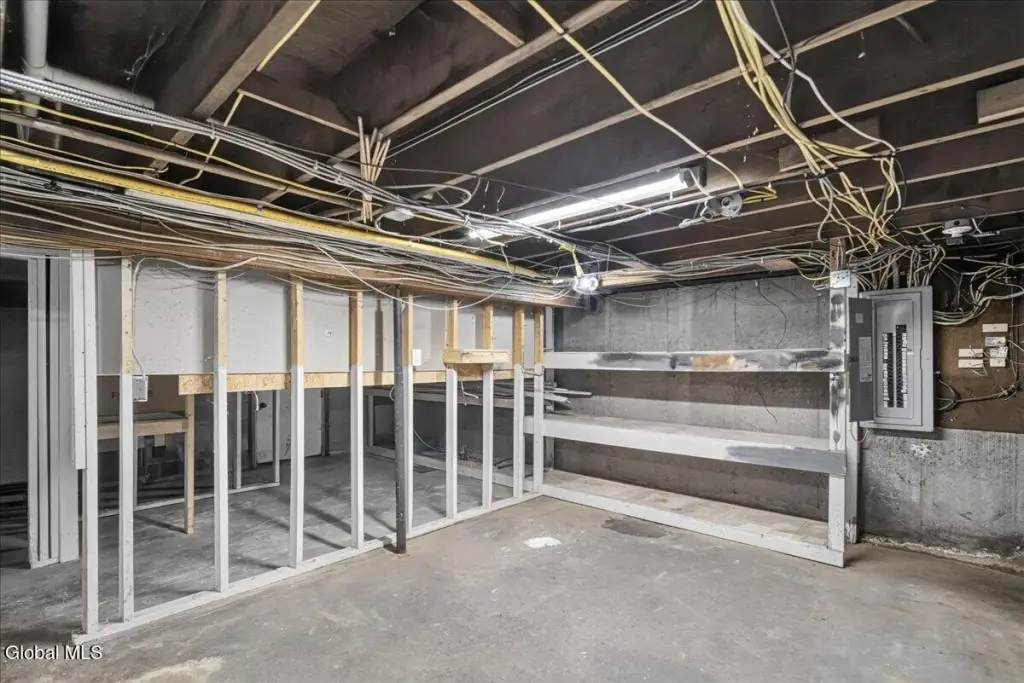
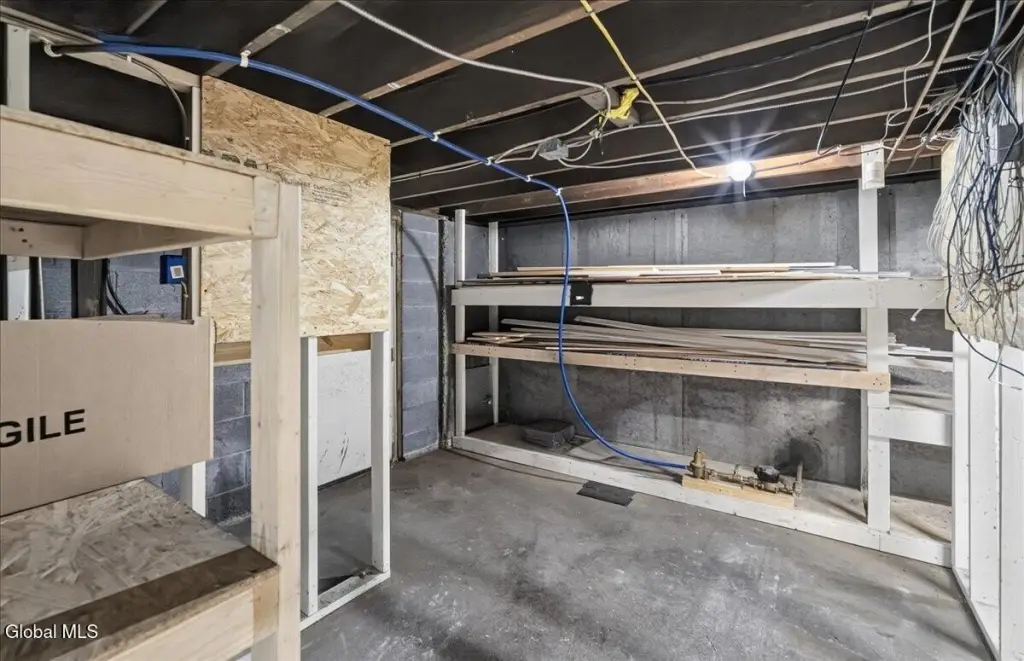
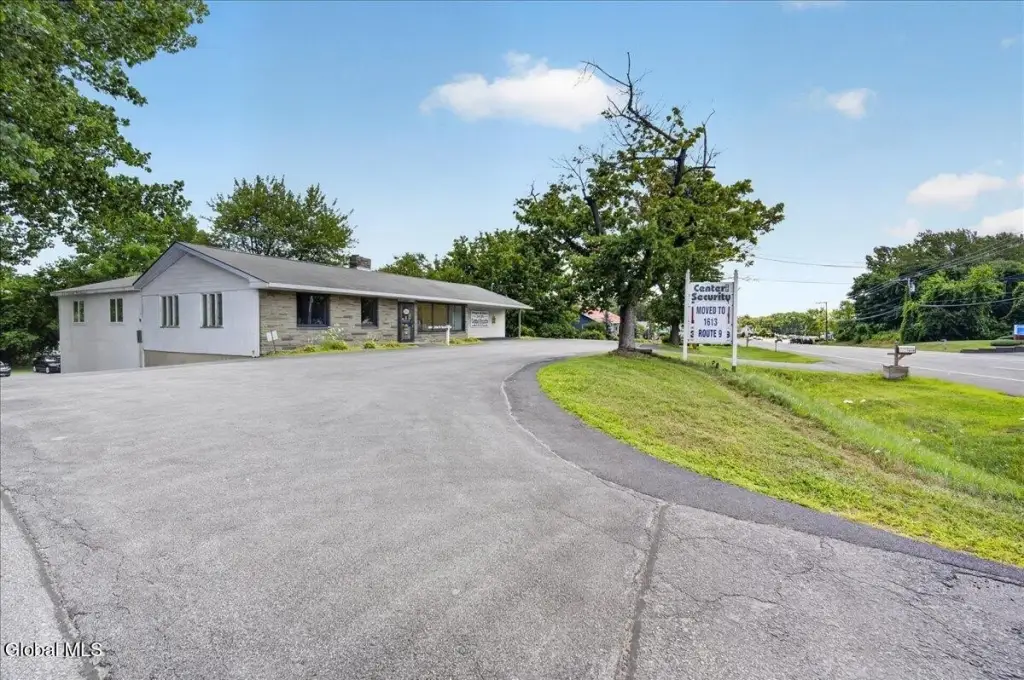
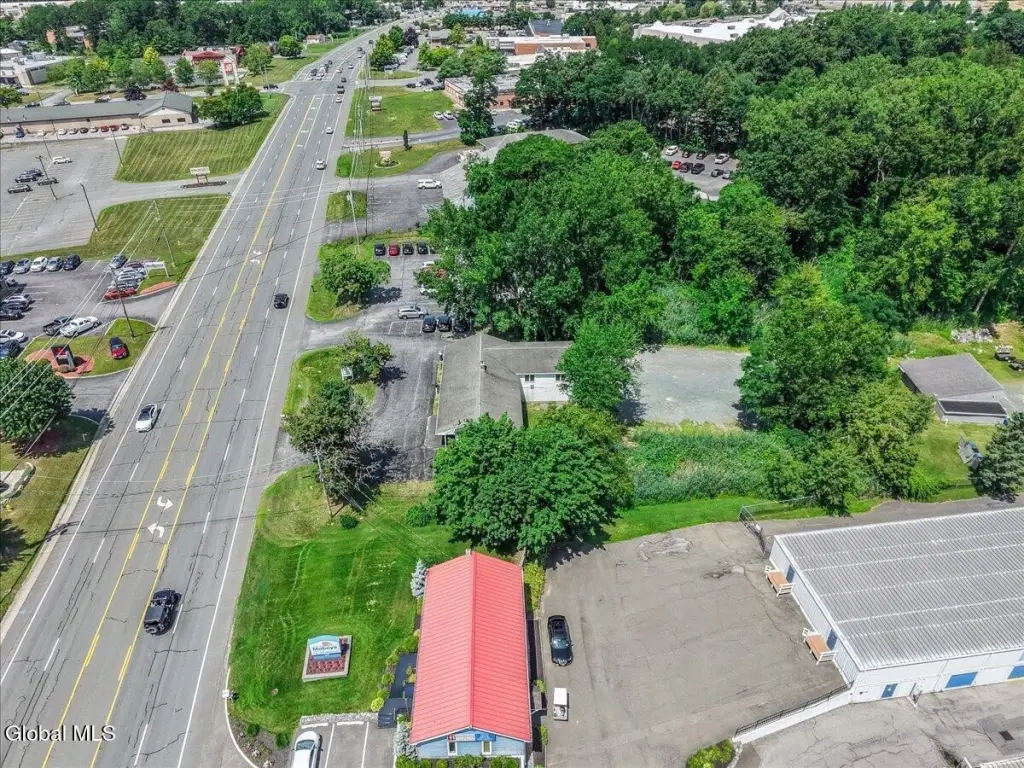
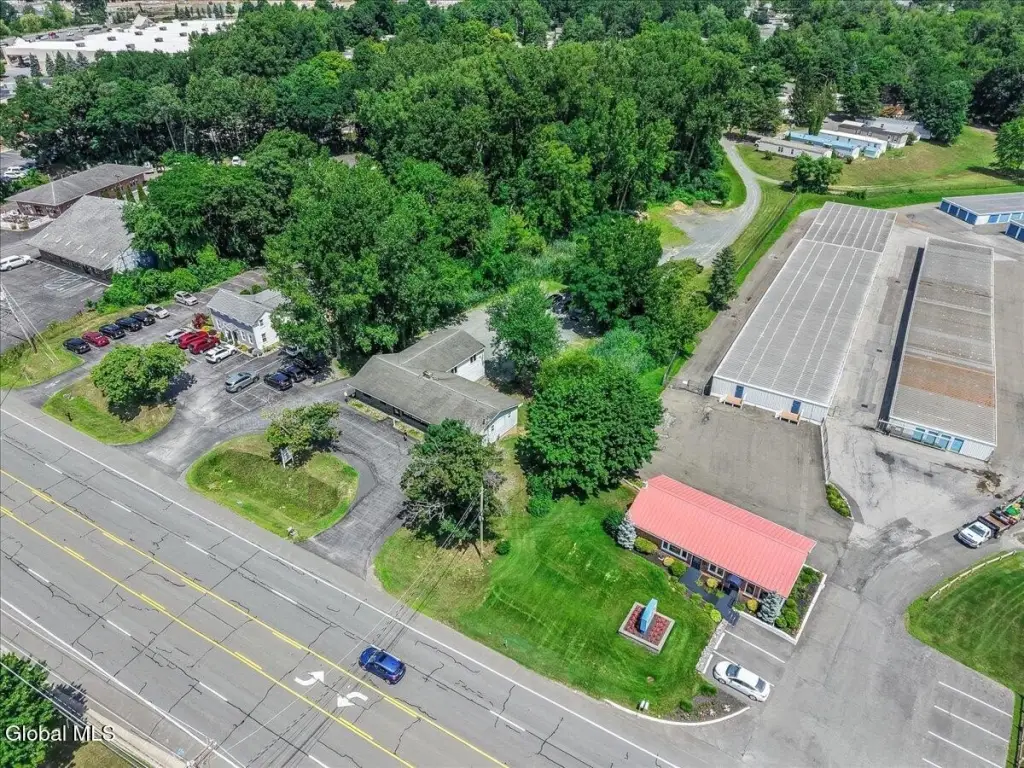
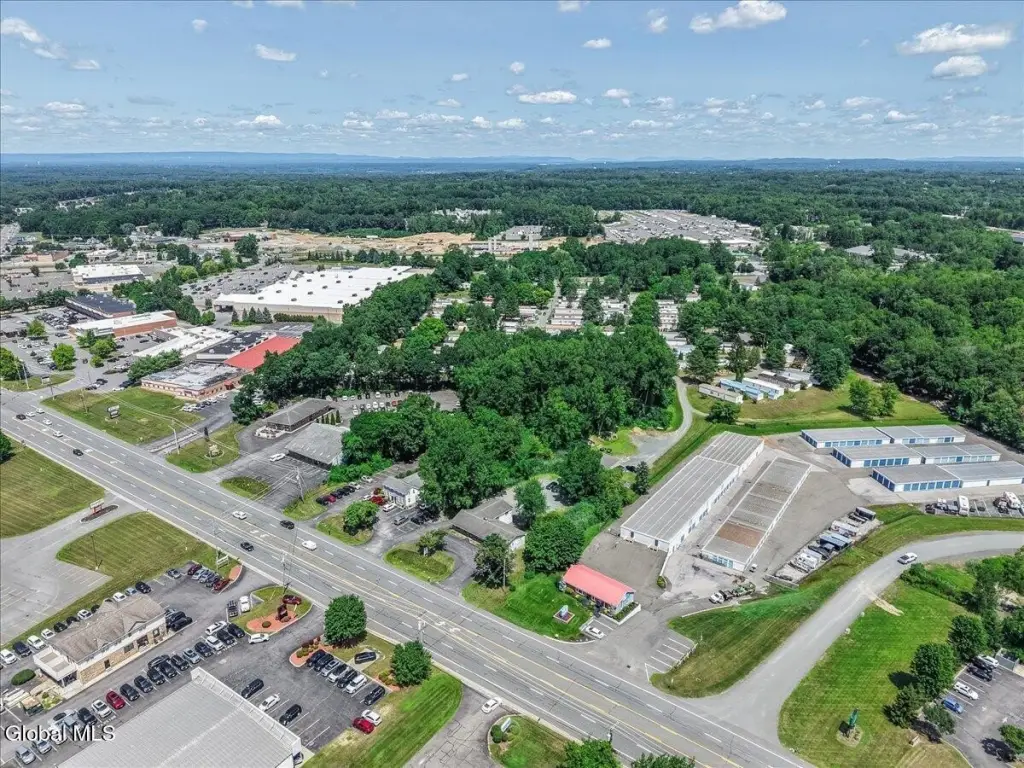
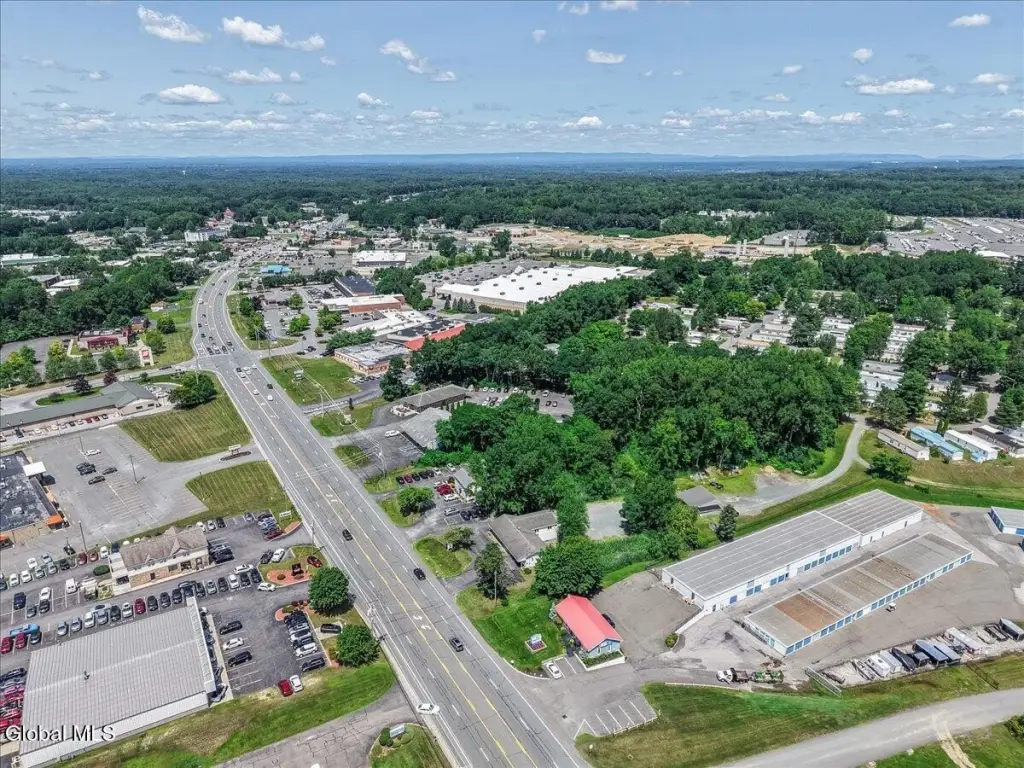
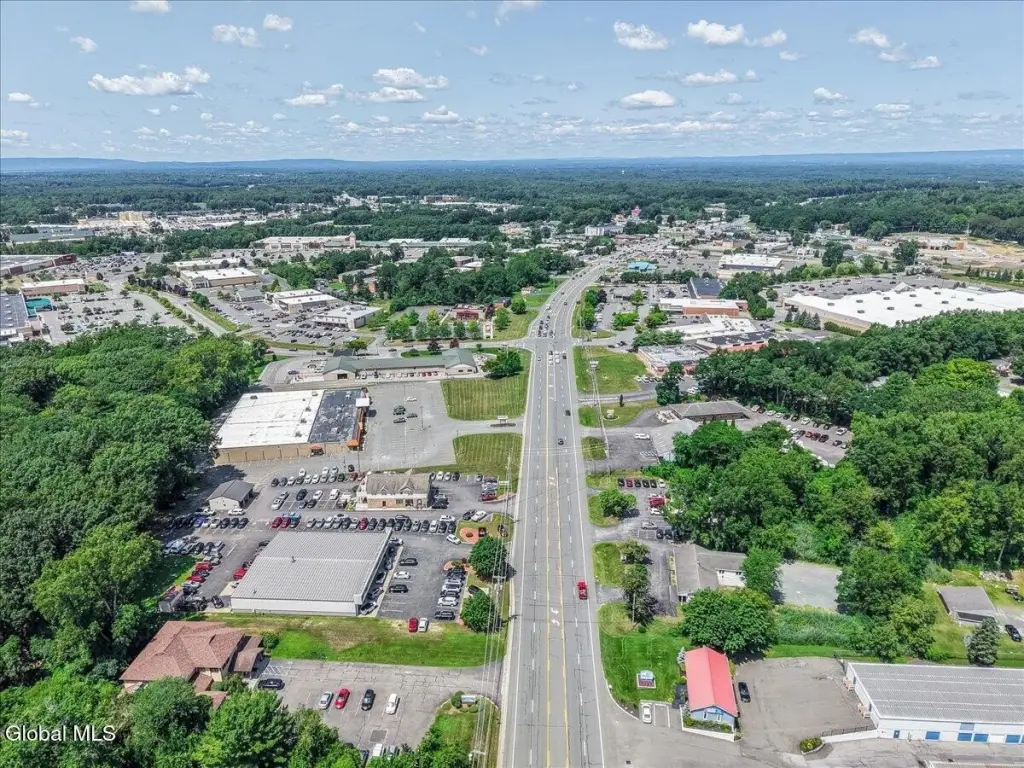
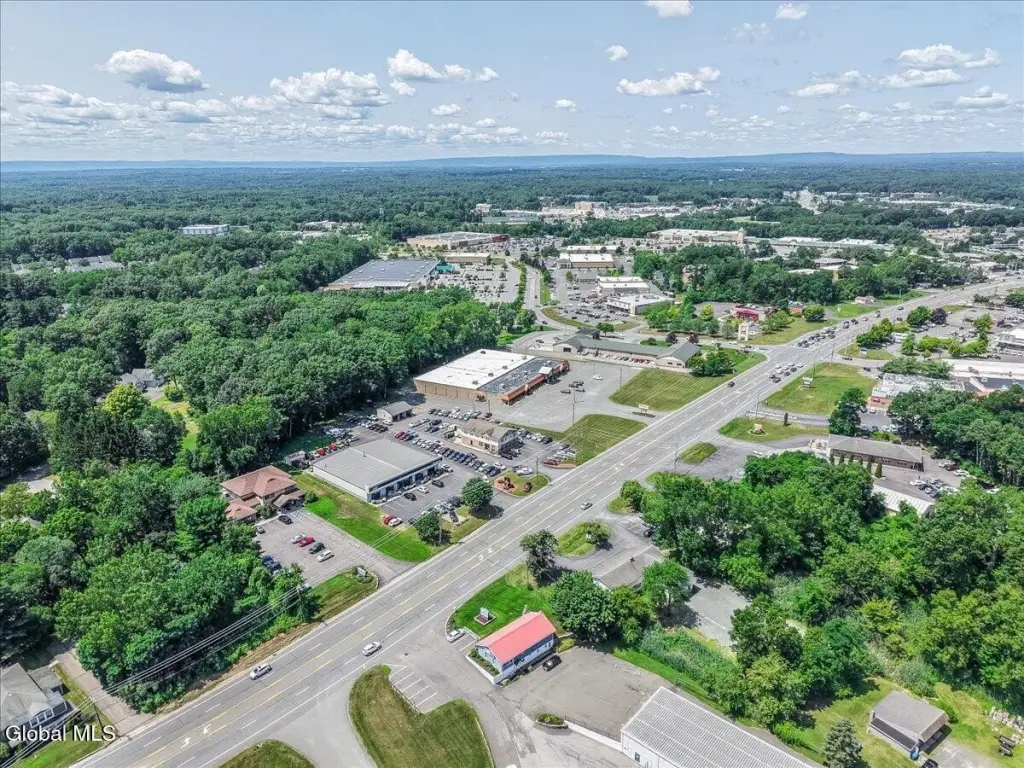
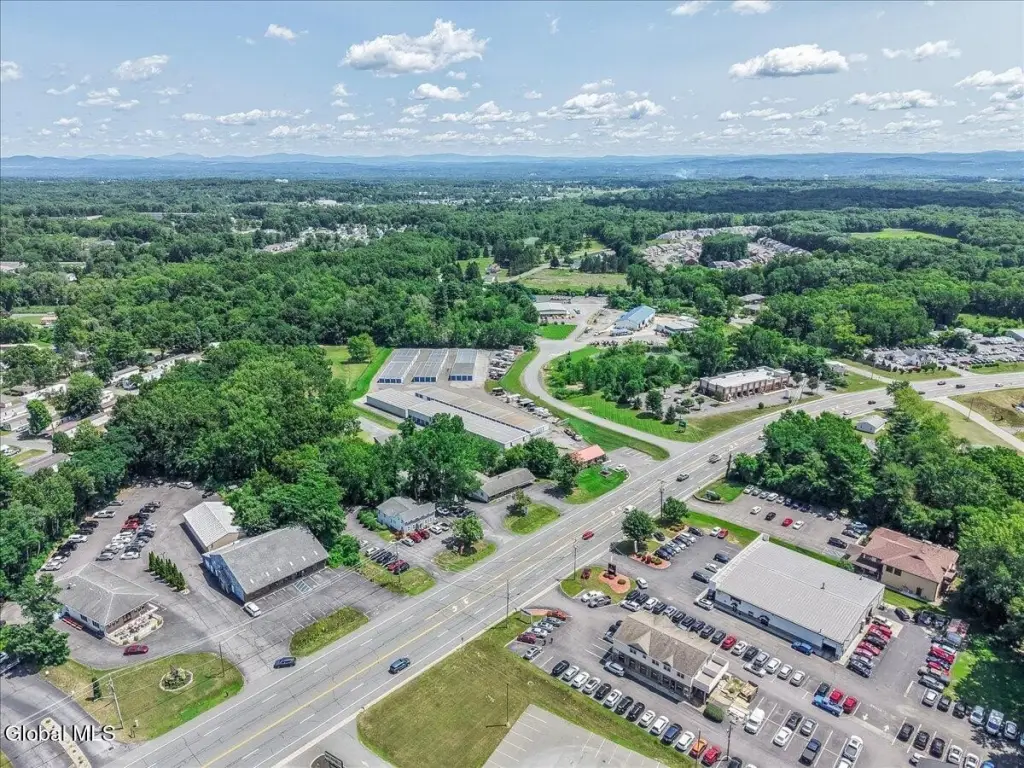
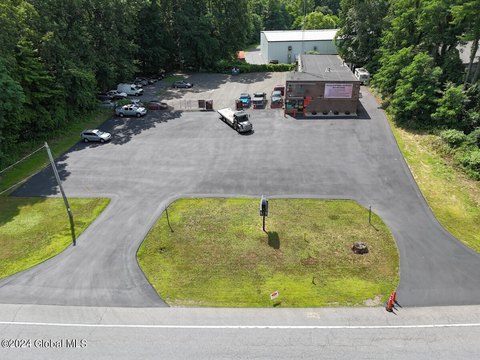
This commercially zoned building sits on a 0.66-acre parcel with approximately 134 feet of frontage and 25+ parking spaces. The property includes about 4,600 SF of usable space, with a main level totaling approximately 2,580 SF featuring multiple rooms and a window front suitable for either retail or office use. A walkout lower level is accessible from the interior and has three separate exterior doors.
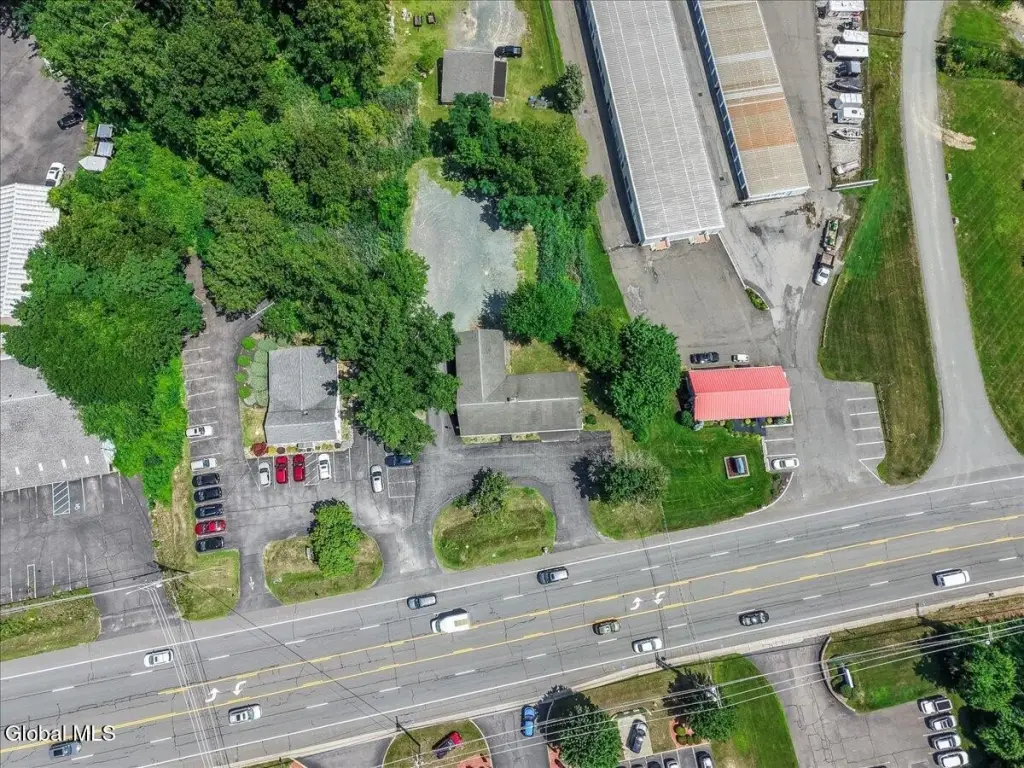
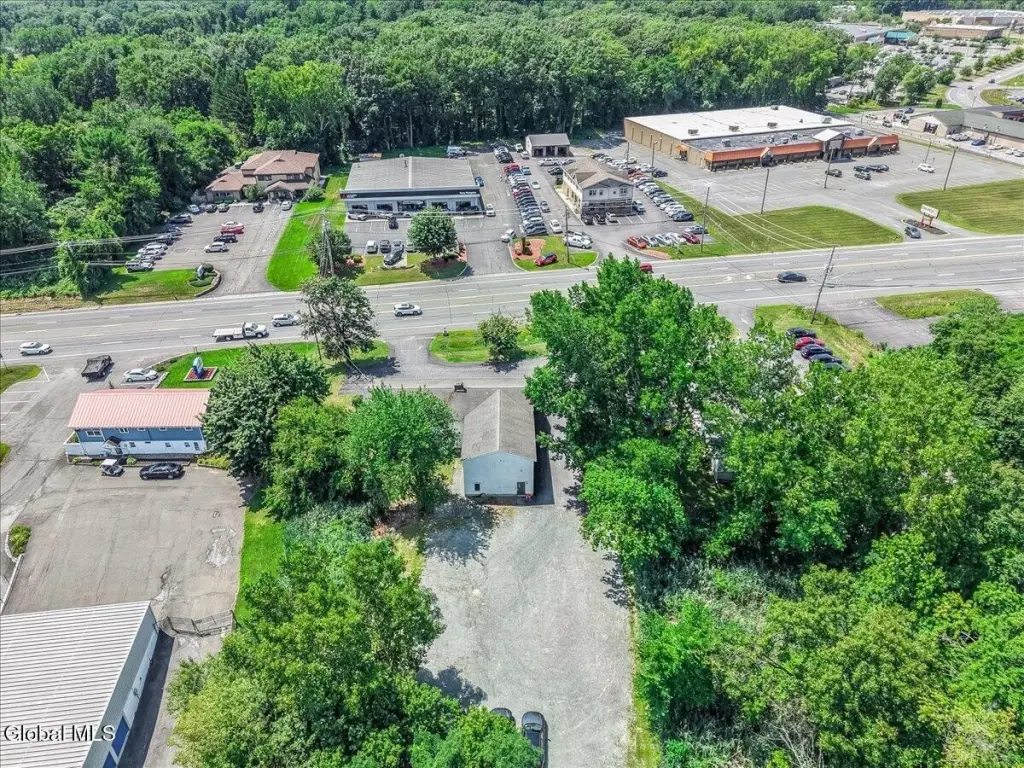
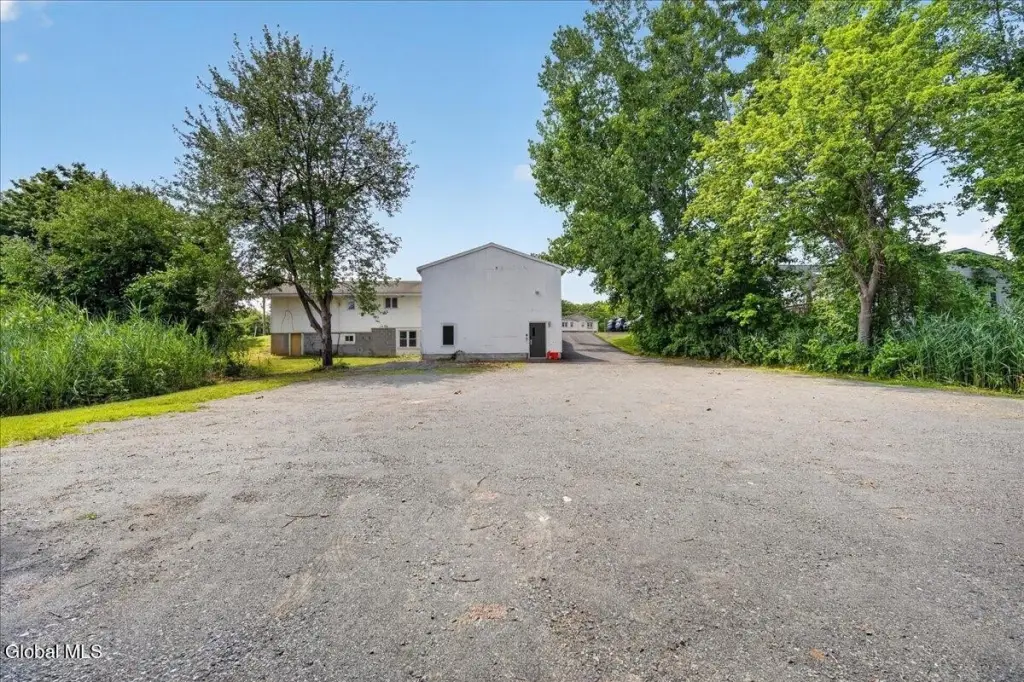
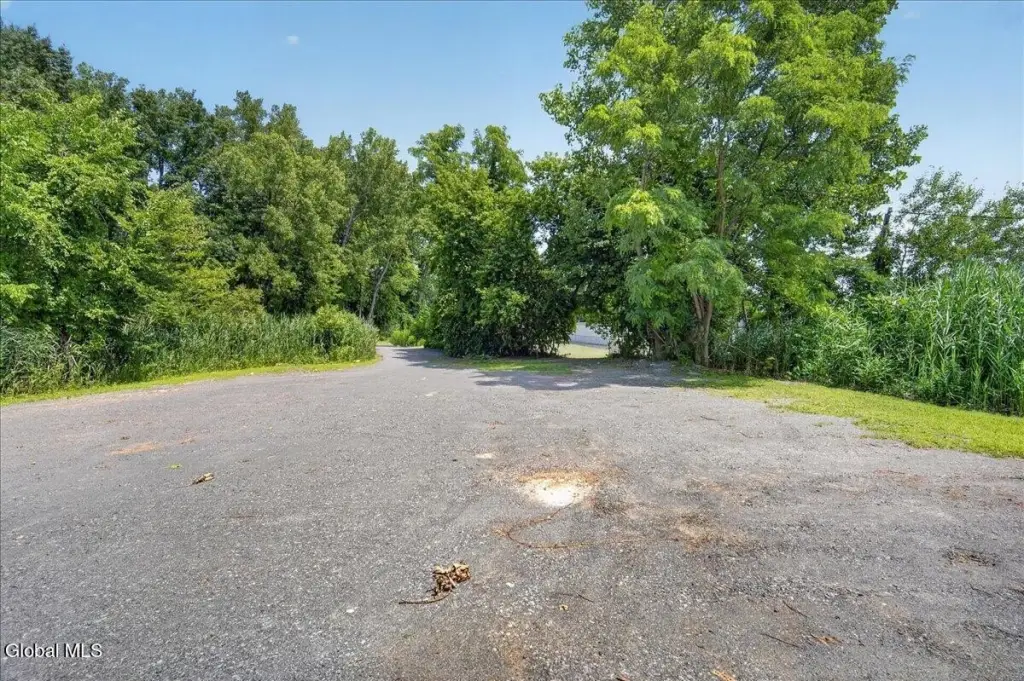
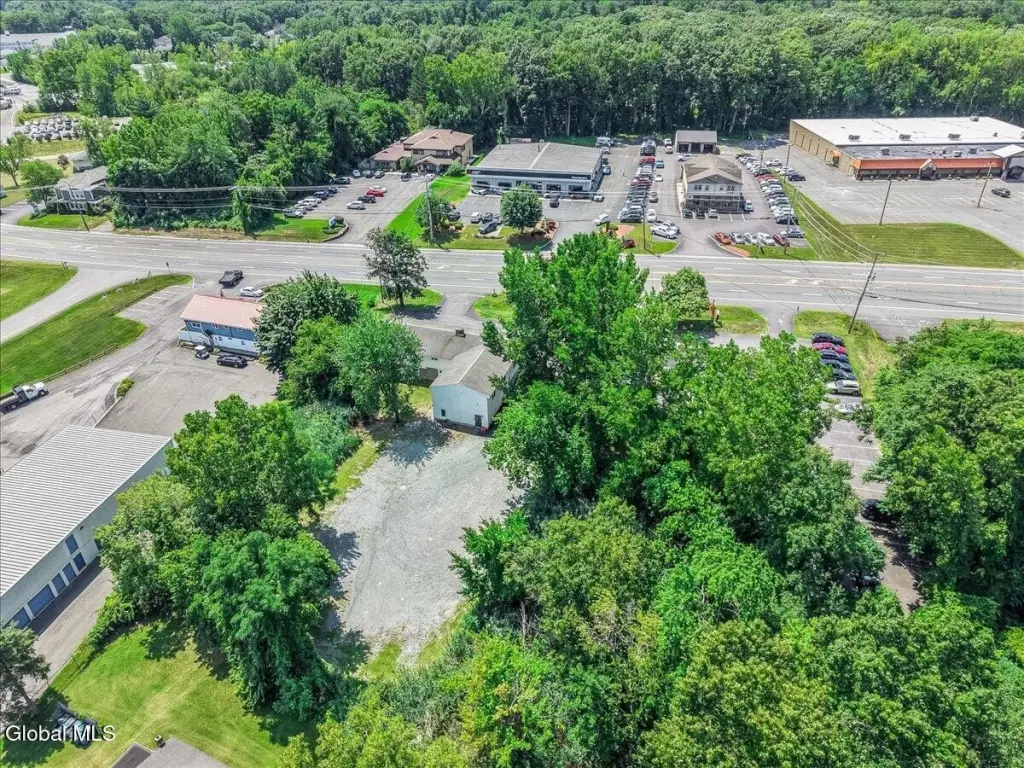
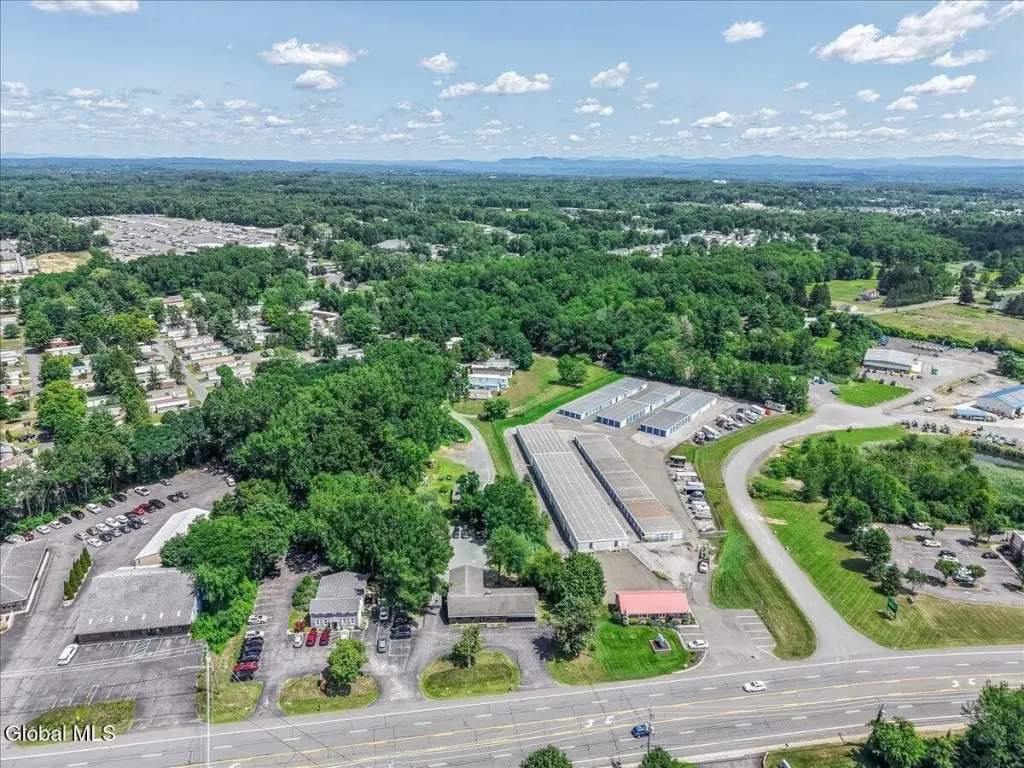
The building is located along a high-traffic Clifton Park/Halfmoon commercial corridor just south of the Route 146 and Route 9 intersection near Exit 9 of I-87, with visibility supported by AADT 19,708 (2025) figures provided in the remarks. Paved parking is available in the front, with additional parking area in the rear.
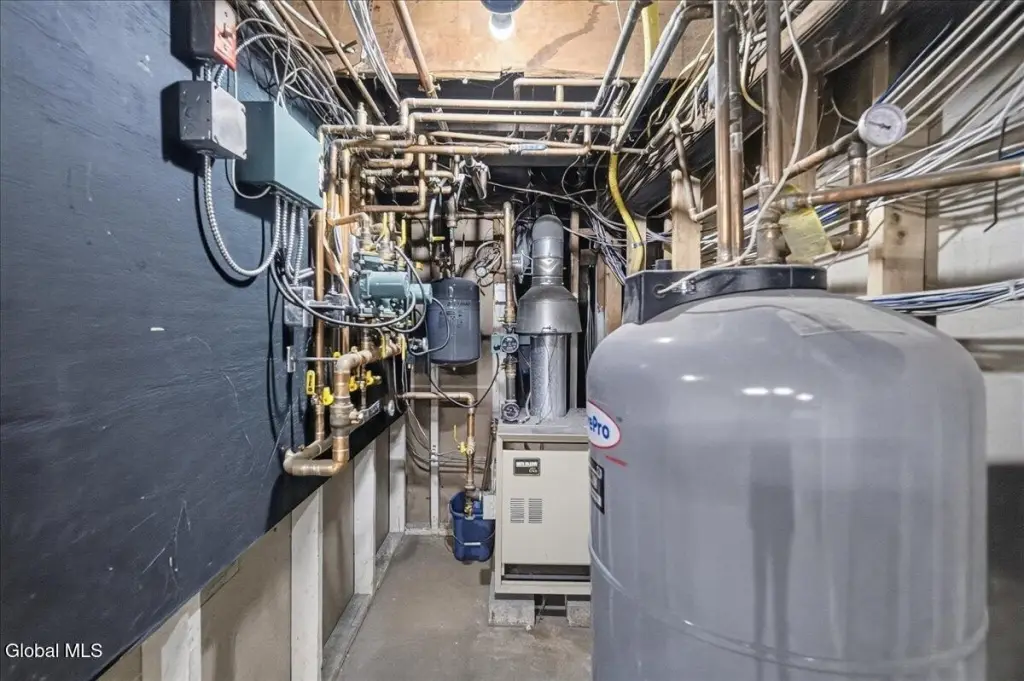
The building is served by public water and septic system with public sewer accessibility. Heating is described as efficient two-zone hot water baseboard, and central air is included. Floor plans and additional zoning information are available upon request.
The building is located along a high-traffic Clifton Park/Halfmoon commercial corridor just south of the Route 146 and Route 9 intersection near Exit 9 of I-87, with visibility supported by AADT 19,708 (2025) figures provided in the remarks. Paved parking is available in the front, with additional parking area in the rear.
The building is served by public water and septic system with public sewer accessibility. Heating is described as efficient two-zone hot water baseboard, and central air is included. Floor plans and additional zoning information are available upon request.
Key Highlights
- 0.66‑acre parcel with 134' frontage on the Clifton Park/Halfmoon commercial corridor south of the Route 146 and Route 9 intersection
- Approximately 4,600 SF usable building space: 2,580 SF main level plus walkout lower level with interior and 3 exterior access doors
- Centrally heated and cooled with zoned hot water baseboard heating and central air; natural gas heat
Financial Insights For Office B
Simulate Cap Rate and NOI
NOI Build-Up
- Vacancy
- income lost from leasable area expected to sit empty during the year — subtracted from gross rent.
- EGI (Effective Gross Income)
- gross rent minus vacancy losses — the realistic income before paying operating costs.
- OpEx (Operating Expenses)
- recurring costs to operate the property (property tax, insurance, utilities, maintenance, management) — excludes financing and capital improvements.
- NOI (Net Operating Income)
- income a property generates after operating costs but before financing and taxes.
| Component | $ | $/SF |
|---|---|---|
| Gross rent | $99.0k | $21.60 |
| − Vacancy | −$16.3k | −$3.56 |
| EGI | $82.7k | $18.04 |
| − OpEx | −$20.7k | −$4.51 |
| NOI | $62.0k | $13.53 |
4,584 SF · lease $21.60/SF/yr · vacancy 16.50% · expense 25.00%
Alternative Uses
Best Use
Office B
$885.8K
$775.1K – $1.03M
NOI $62,008 @ 7.0% cap · market cap 6.23%
Second Best
Retail
$790.5K
$691.7K – $922.2K
NOI $55,333 @ 7.0% cap · market cap 5.56%
Theoretical Best
Office A
$1.37M
$1.20M – $1.60M
NOI $96,044 @ 7.0% cap · market cap 9.65%
Zoning and permitted uses should be independently verified with authorities.
Property Analytics
Property Profile
Location Intelligence
Current Use



Frequently Asked Questions
What type of property is this?
Storefront property - Commercial building on 0.66 acres with 4,600 SF usable space, 25+ parking spaces, and both central air and baseboard heat.
Where is this storefront property located?
The property is located at 1659 Route 9 Clifton Park, NY.
What is the asking price?
The asking price for this property is $995,000.
What are key features of this property?
This property features: 0.66‑acre parcel with 134' frontage on the Clifton Park/Halfmoon commercial corridor south of the Route 146 and Route 9 intersection; Approximately 4,600 SF usable building space: 2,580 SF main level plus walkout lower level with interior and 3 exterior access doors; Centrally heated and cooled with zoned hot water baseboard heating and central air; natural gas heat



