Free-Standing Multi-Tenant Retail
For Sale
Contact for pricing
1658-1668 N Lafayette Street, Denver, CO 80210
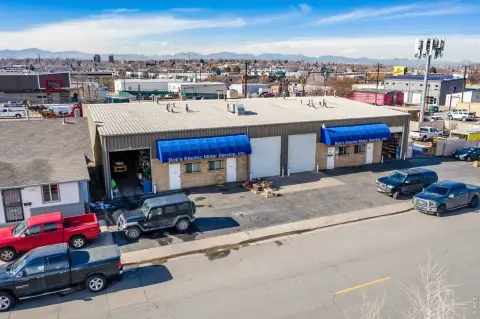
Free-standing building with 24 individually sized units, multiple restrooms and kitchens, terraces, and off-street parking including an 18-space lot.
Property Size13,658 SF
Price / SF$256.26
Days on Market173
Property Features for 1658-1668 N Lafayette Street
General Information
Standard status
Active
Size
13,658 SF
Total Parking Spaces
18
Property subtype
Retail, Office, Mixed Use
Zoning
C-MS-5
Occupancy
97%
Investment Type
Stabilized
Net Operating Income
$391,586
Site & Location
Neighborhood
City Park West
Building Details
Year Built
1921
Year Renovated
2018
Stories
2
Units
24
Tenancy
Multi
Listing Agency:
Kentwood Real Estate
Listed By:
Kyle Malnati · License #CO ER40042617
(303) 358-4250
Source:
Crexi
Added: May 4
Changed: Oct 19
Last Checked: Oct 23 at 6:48AM
Displayed information is deemed reliable but is not guaranteed and should be independently verified. All listing content including descriptions, pricing, images are the copyrighted material of Kentwood Real Estate

Ask AI about this property
Review the available facts, identify missing information and prepare questions for the agent.
Investment Insights
Based on property information with market context.
Introducing Lafayette Exchange at City Park West, a free-standing commercial building located at 1658–1668 N Lafayette Street. The property is currently configured with 24 individually sized units, offering flexible layouts for a mix of boutique, street-facing spaces. A brick façade and expansive windows help support bright interiors and strong curb appeal, while original architectural details are complemented by modern updates.
The building includes 41 rooms total, including 3 kitchens and 7 restrooms, plus 2 terraces. There is also a double-height 2-car garage/store component. Off-street parking is available, including a spacious 18-space parking lot designed to support customer and tenant access.
Positioned along a tree-lined street just blocks from City Park, the property sits within an established mix of restaurants, cafés, markets, and neighborhood amenities.
The building includes 41 rooms total, including 3 kitchens and 7 restrooms, plus 2 terraces. There is also a double-height 2-car garage/store component. Off-street parking is available, including a spacious 18-space parking lot designed to support customer and tenant access.
Positioned along a tree-lined street just blocks from City Park, the property sits within an established mix of restaurants, cafés, markets, and neighborhood amenities.
Key Highlights
- Free‑standing commercial building built in 1921 at 1658–1668 N Lafayette Street
- Currently configured with 24 individually sized units plus 41 total rooms
- Includes 3 kitchens and 7 restrooms, supporting flexible tenant and suite layouts
Financial Insights
Estimated NOI and Cap Rate
NOI / Yr
$200,117
Cap Rate
5.72%
Suggested Prices Based on Cap Rates
Cap Rate 5%
$4,002,340
$4.0M
Cap Rate 7%
$2,858,814
$2.9M
Cap Rate 9%
$2,223,522
$2.2M
Market Conditions
NOI Build-Up for 13,658 SF
Gross rent
$360.6K $26.40/SF
− Vacancy
−$93.7K −$6.86/SF
EGI
$266.8K $19.54/SF
− OpEx
−$66.7K −$4.88/SF
NOI
$200.1K $14.65/SF
Area
Denver, CO
Vacancy
26.00%
Lease Rate
$26.40 /SF/Yr
Expense Ratio
25.00%
Simulate Cap Rate and NOI
Suggested Prices Based on Cap Rates
Cap Rate 5%
$4,002,340
Cap Rate 7%
$2,858,814
Cap Rate 9%
$2,223,522
Alternative Uses
Best Use
Office B
$2.86M
$2.50M – $3.34M
NOI $200,117 @ 7.0% cap · market cap 5.72%
Second Best
Retail
$2.67M
$2.34M – $3.12M
NOI $186,963 @ 7.0% cap · market cap 5.34%
Theoretical Best
Office A
$4.35M
$3.80M – $5.07M
NOI $304,348 @ 7.0% cap · market cap 8.70%
Zoning and permitted uses should be independently verified with authorities.
How Realmo checks its estimates
Property Analytics
Current Use
Location Intelligence
Trade Area within ½ mile
6,946
Businesses Nearby
Under-served
Demand for This Use
Explore this area
Business Placement
Demographics for 80210, CO
39,394
Population
18,496
Households
2.1
Avg Household Size
33
Median Age
76%
College-Educated
99%
High-School Grad
6.1 sq mi
ZIP Area
6,458
Density / Sq Mi
$120,156
Median Household Income
$61,607
Median Earnings
$1,963
Median Rent
$870,500
Median Home Value
Market
Vacancy Rate% for Office in Denver, CO


Similar Off Market Nearby
- Maze Haus — 1235 N Washington St #29, Denver, CO 80203
- Gool: Flower Shop — 903 E Colfax Ave, Denver, CO 80218
- Parkas Florist — 1540 Park Ave, Denver, CO 80218
- Sterling — 1510 N Humboldt St, Denver, CO 80218
- York Florist — 1514 York St, Denver, CO 80206
Frequently Asked Questions
What type of property is this?
Storefront property - Free-standing building with 24 individually sized units, multiple restrooms and kitchens, terraces, and off-street parking including an 18-space lot.
Where is this storefront property located?
The property is located at 1658-1668 N Lafayette Street Denver, CO.
What is the asking price?
The asking price for this property is $3,500,000.
What are key features of this property?
This property features: Free‑standing commercial building built in 1921 at 1658–1668 N Lafayette Street; Currently configured with 24 individually sized units plus 41 total rooms; Includes 3 kitchens and 7 restrooms, supporting flexible tenant and suite layouts