Residential Income Property with

For Sale
$415,000
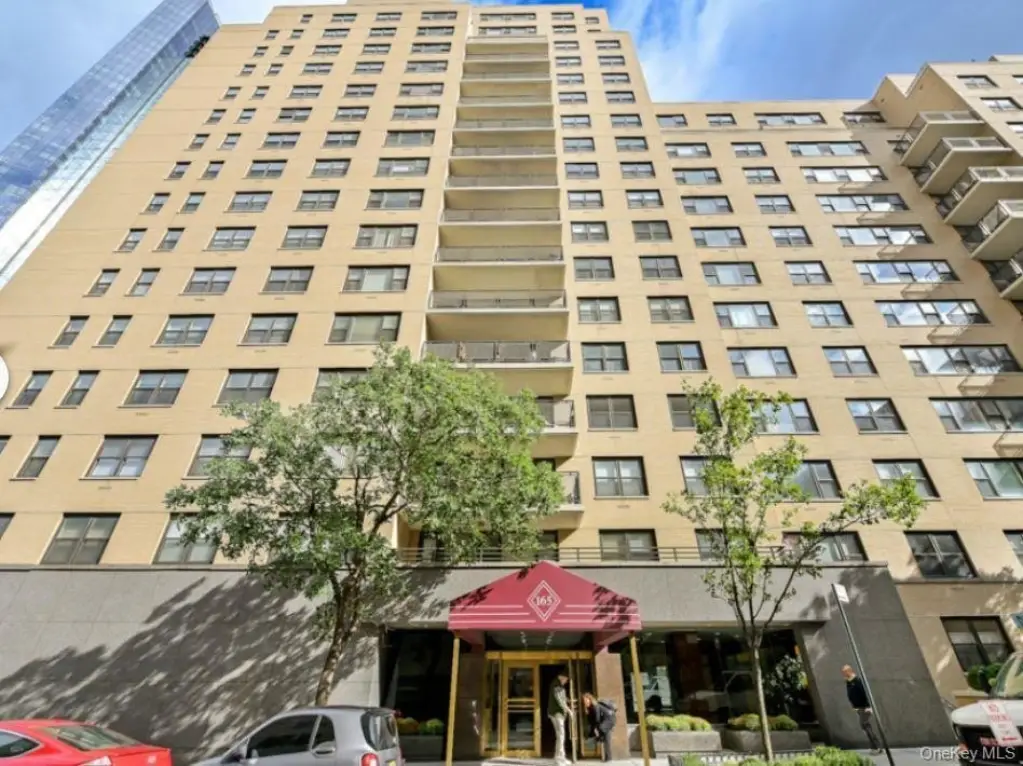
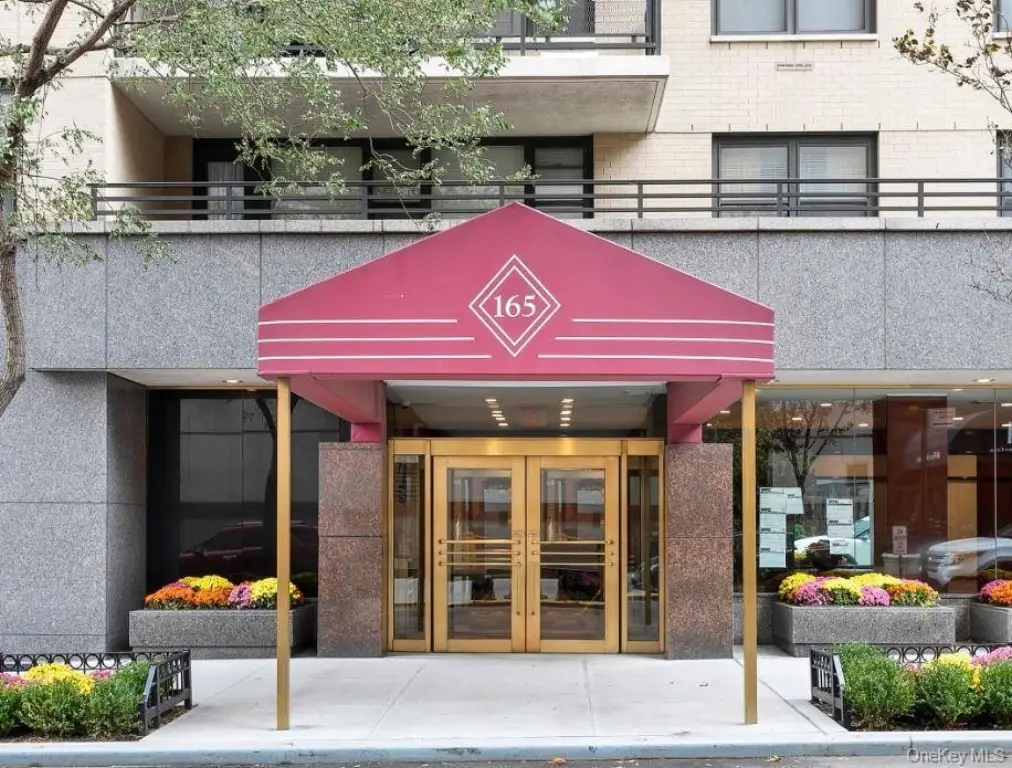
165 West 66th Street, New York, NY 10023
New York, NY
Property Size426 SF
Price / SF$974.18
Days on Market48
Property Features for 165 West 66th Street
General Information
Property type
Residential Multi Family
Property subtype
Other
Bathrooms
1
Full bathrooms
1
Standard status
Active
Size
426 SF
Amenities
24-hour doorman
laundry
bike storage
fitness center
pet friendly
Building Details
Year built
1962
Listing Agency:
NextHome Platinum Properties
(516) 788-8785
Listed By:
Anthony Raimo
(516) 301-6151
Added: Aug 23
Last Checked: Oct 9 at 6:06PM
MLS# 973898
Copyright © 2026 NextHome, Inc. All rights reserved. All information provided by the listing agent/broker is deemed reliable but is not guaranteed and should be independently verified.
Investment Insights
Based on property information with market context.
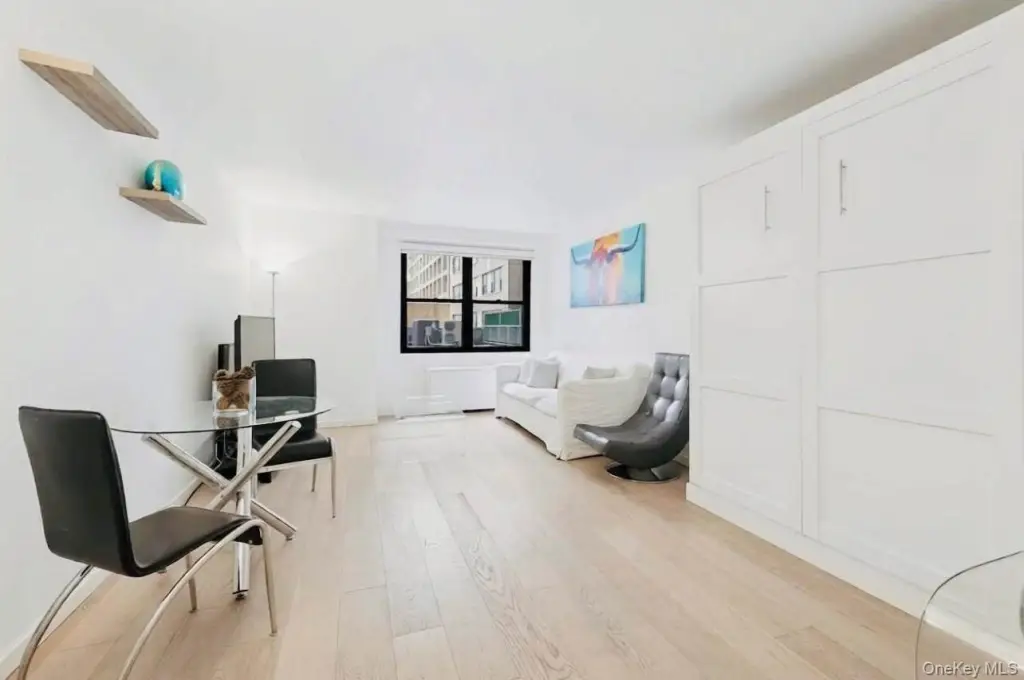
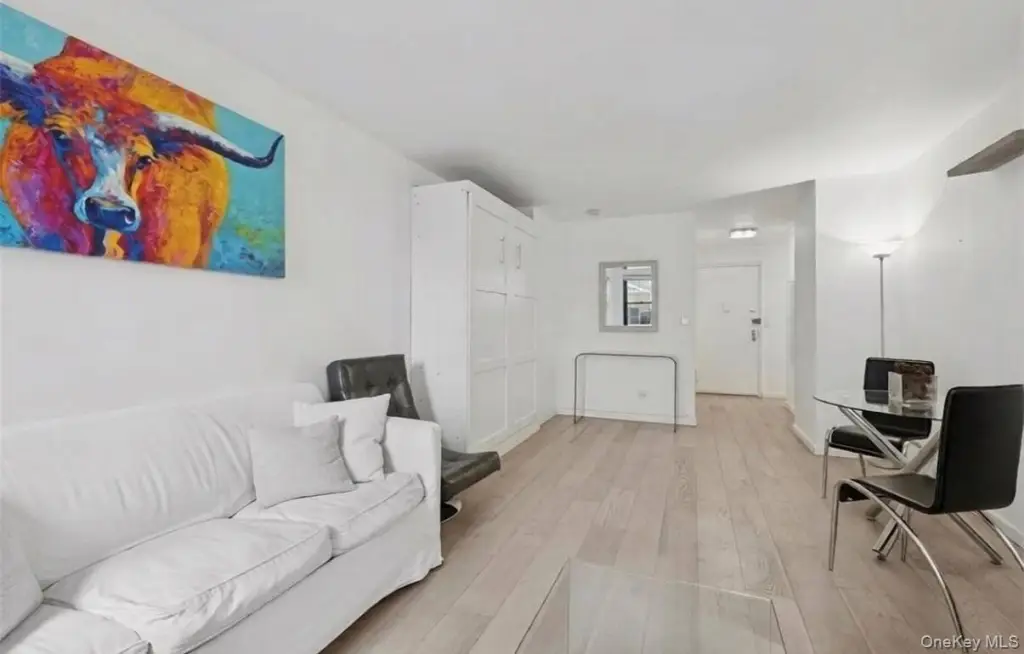
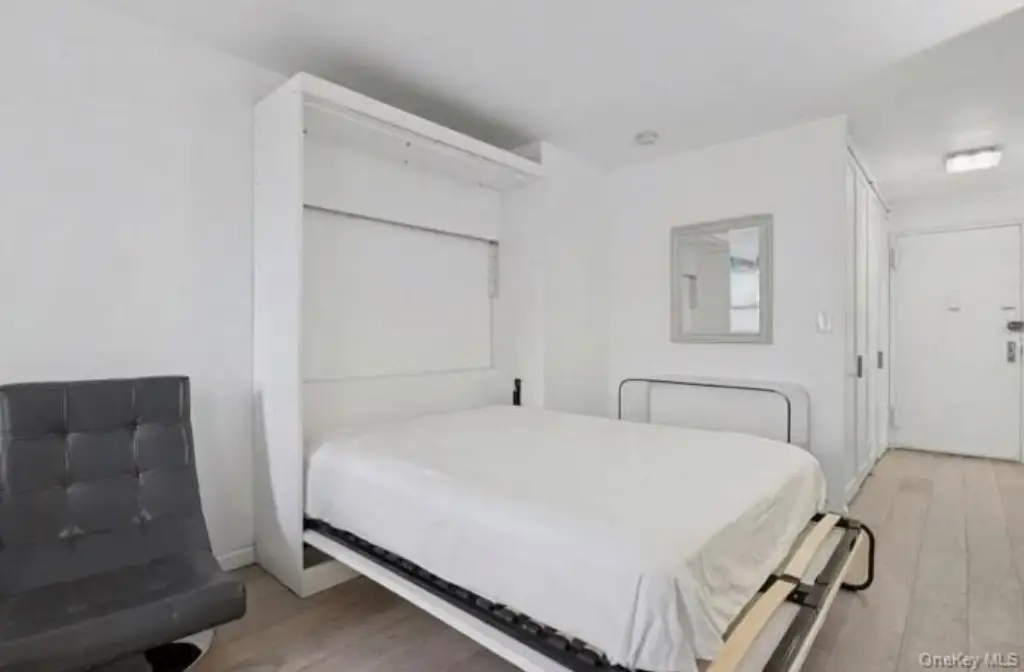
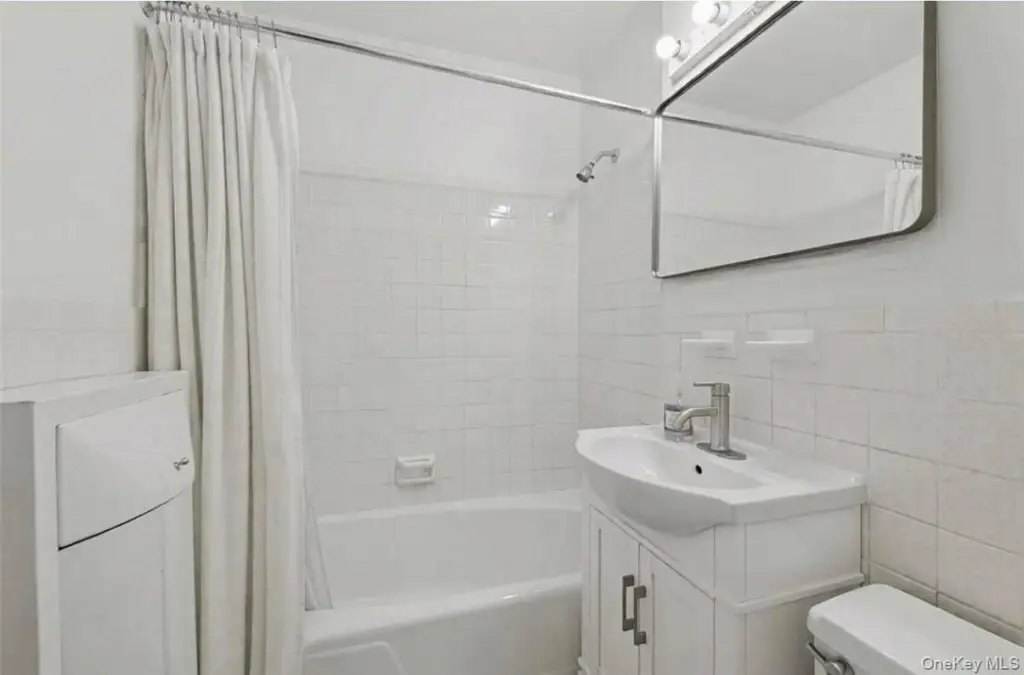
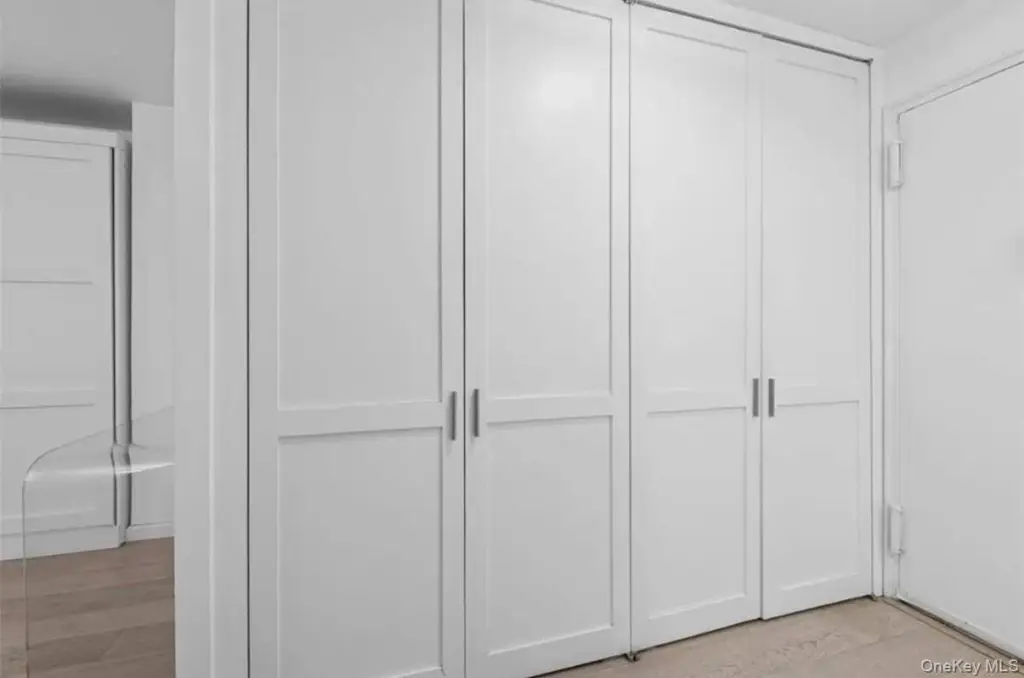
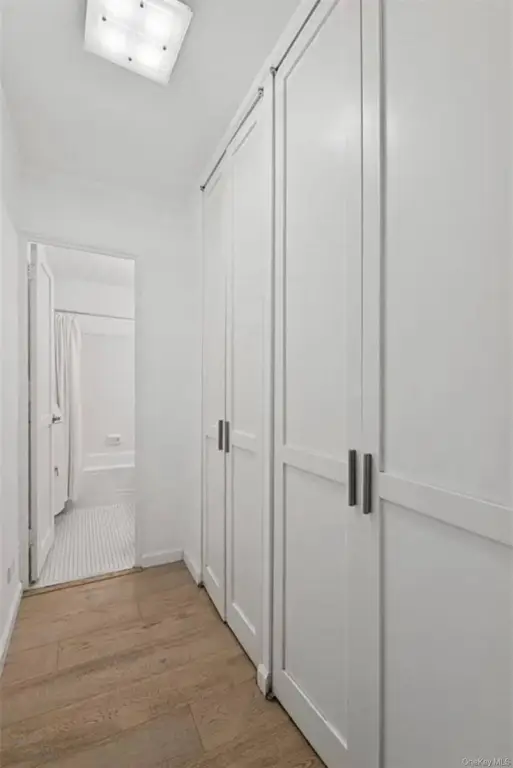
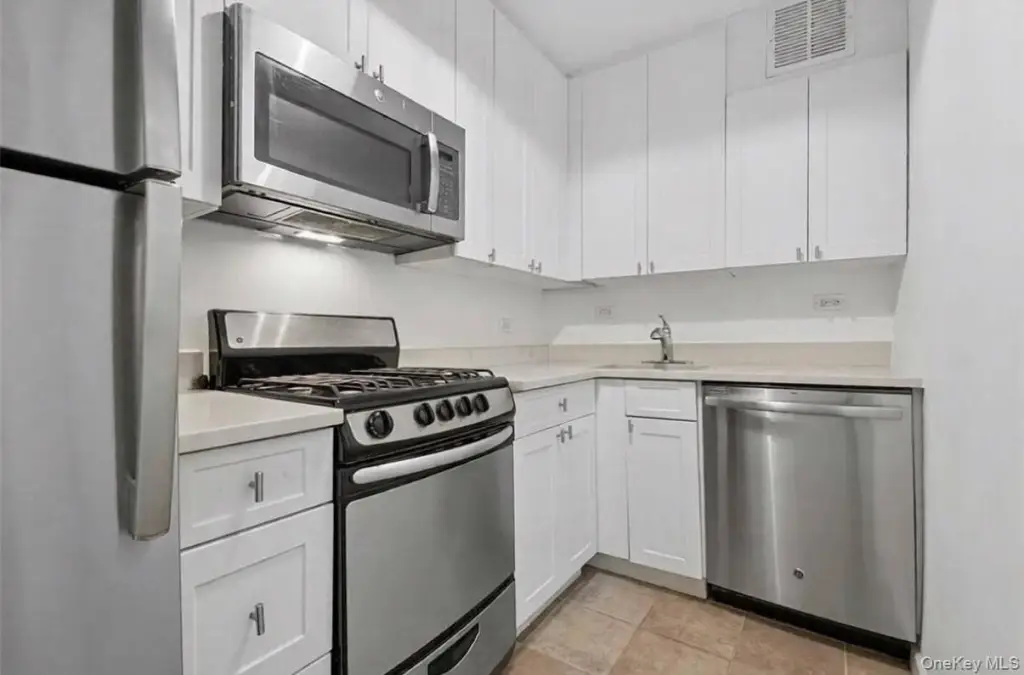
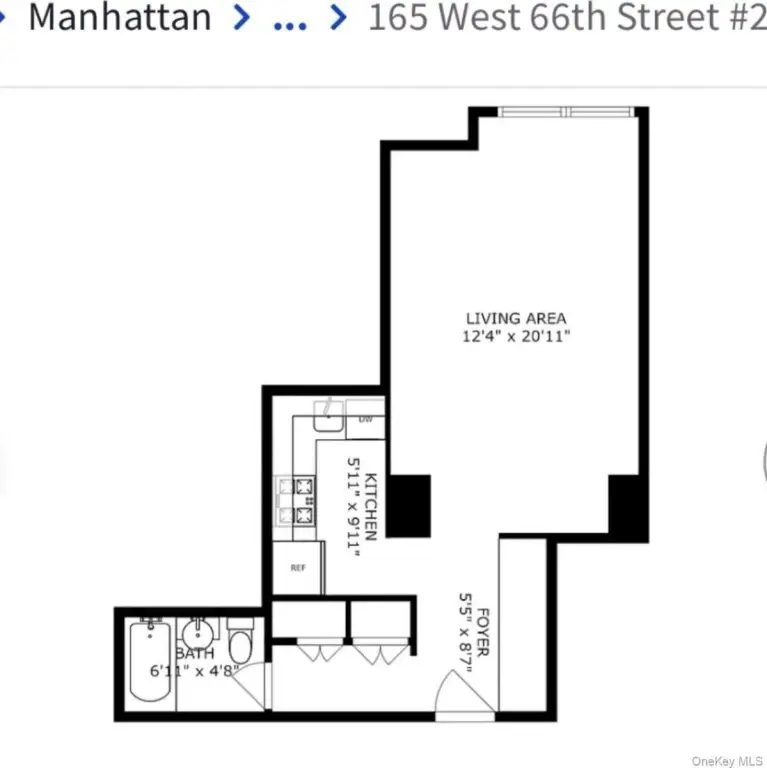
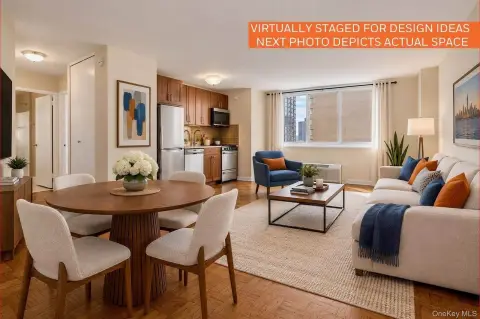
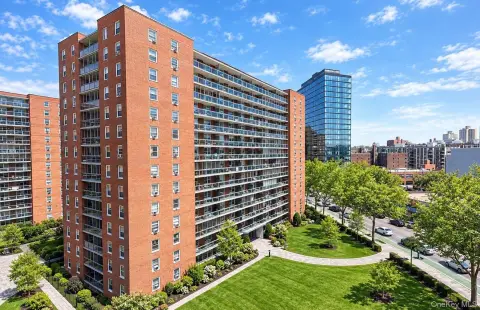
This second-floor studio at 165 West 66th Street offers 426 square feet with a separate kitchen, private hallway, bathroom, dressing area, and four double-door closets. The apartment faces an interior courtyard and is positioned within a 1962 full-service building. Building amenities include a 24-hour doorman, live-in superintendent, laundry facilities, bike storage, and a fitness center.
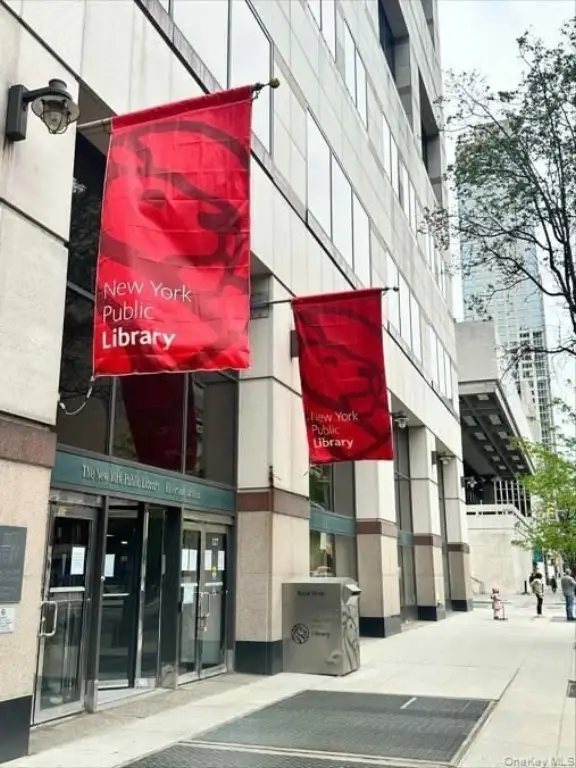
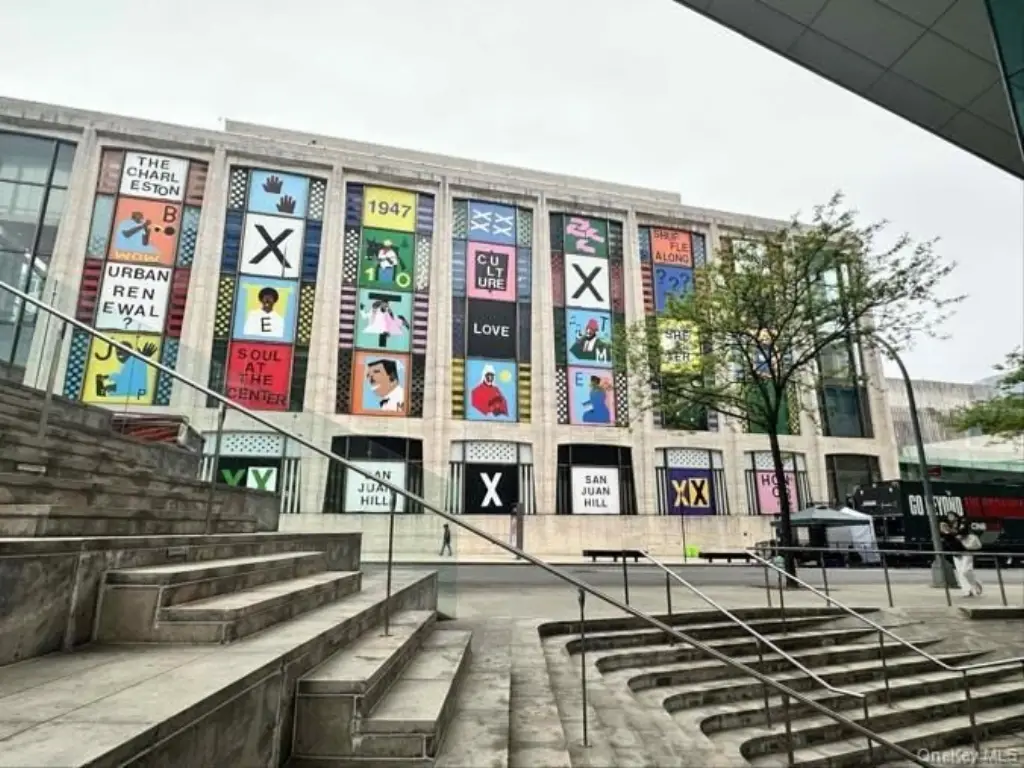
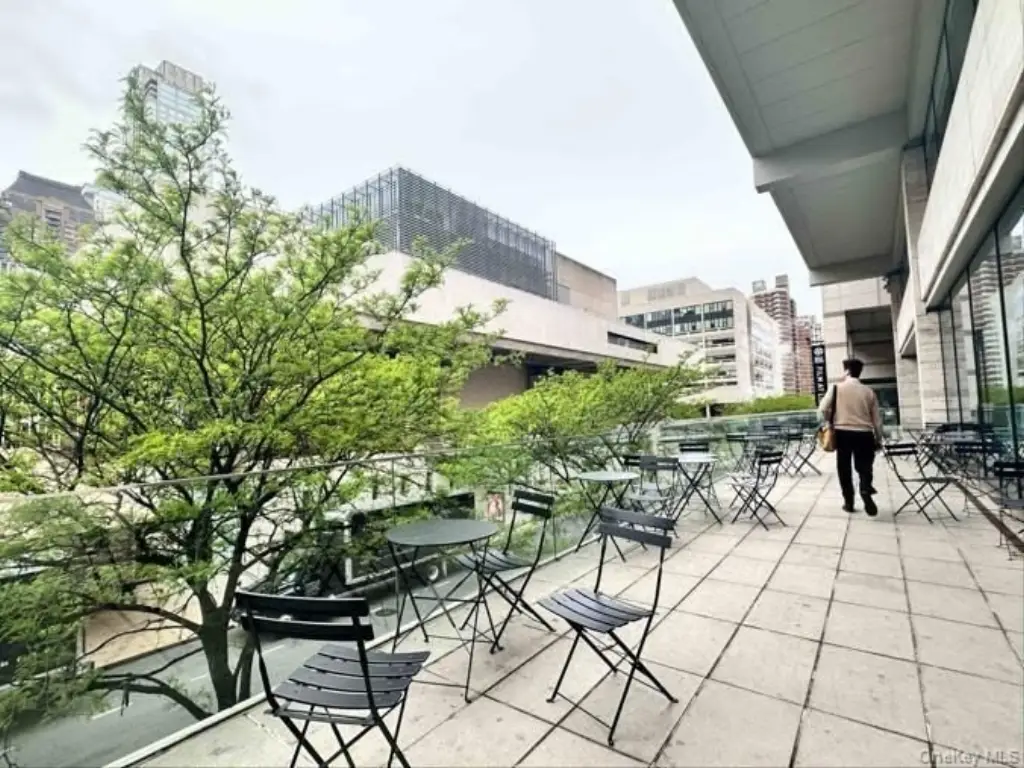
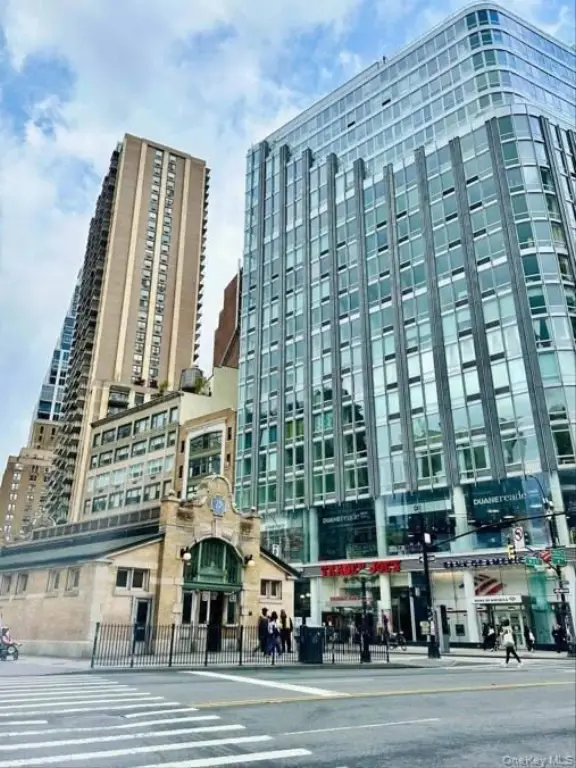
The property is located on West 66th Street between Broadway and Amsterdam, one block from Lincoln Center. Central Park and Riverside Park are both within a short walk, while the 1 train is down the block. Columbus Circle, grocery stores, restaurants, entertainment, and daily services are also nearby.
The property is located on West 66th Street between Broadway and Amsterdam, one block from Lincoln Center. Central Park and Riverside Park are both within a short walk, while the 1 train is down the block. Columbus Circle, grocery stores, restaurants, entertainment, and daily services are also nearby.
Key Highlights
- 426‑square‑foot second‑floor studio
- Separate kitchen with private hallway to bathroom and dressing area
- Four double‑door closets provide substantial storage
Financial Insights
Estimated NOI and Cap Rate
NOI / Yr
$13,383
Cap Rate
3.22%
Suggested Prices Based on Cap Rates
Cap Rate 5%
$267,660
$267.7K
Cap Rate 7%
$191,186
$191.2K
Cap Rate 9%
$148,700
$148.7K
Market Conditions
NOI Build-Up for 426 SF
Gross rent
$25.6K $60.00/SF
− Vacancy
−$1.2K −$2.88/SF
EGI
$24.3K $57.12/SF
− OpEx
−$10.9K −$25.70/SF
NOI
$13.4K $31.42/SF
Area
ZIP 10023
Vacancy
4.80%
Lease Rate
$60.00 /SF/Yr
Expense Ratio
45.00%
Simulate Cap Rate and NOI
Suggested Prices Based on Cap Rates
Cap Rate 5%
$267,660
Cap Rate 7%
$191,186
Cap Rate 9%
$148,700
Alternative Uses
Best Use
Apartment 5plus
$191.2K
$167.3K – $223.1K
NOI $13,383 @ 7.0% cap · market cap 3.22%
Second Best
—
—
no second resolved use
Theoretical Best
Office A
$302.9K
$265.0K – $353.4K
NOI $21,202 @ 7.0% cap · market cap 5.11%
Zoning and permitted uses should be independently verified with authorities.
Property Analytics
Unlock full access to Insights
Subscribe to Realmo Intelligence
Open Analytics
Current Use
Lease Details
1
Residential units
Location Intelligence
Trade Area within ½ mile
14,174
Businesses Nearby
Explore this area
Business Placement
Demographics for 10023, NY
71,164
Population
46,272
Households
1.5
Avg Household Size
42
Median Age
84%
College-Educated
98%
High-School Grad
1.0 sq mi
ZIP Area
71,164
Density / Sq Mi
$157,866
Median Household Income
$109,508
Median Earnings
$3,050
Median Rent
$1,401,800
Median Home Value
Check the figures for this property
Cap Rate, Value Estimation, Potential NOI and more
View Realmo Analytics

Questions? Ask Rey
Realmo’s AI knows this listing — price, zoning, demand, history. Ask anything.




Frequently Asked Questions
What type of property is this?
Residential income property - Second-floor studio with separate kitchen, abundant storage, and access to full-service building amenities.
Where is this residential income property located?
The property is located at 165 West 66th Street New York, NY.
What is the asking price?
The asking price for this property is $415,000.
What are key features of this property?
This property features: 426‑square‑foot second‑floor studio; Separate kitchen with private hallway to bathroom and dressing area; Four double‑door closets provide substantial storage


