Victorian Triplex with
For Sale
$3,699,000
1630-1634 Hyde St, San Francisco, CA 94109
Three flats feature upgraded kitchens, private laundry equipment, and access to a shared patio and sunny backyard.
Property Size4,830 SF
Price / SF$765.84
Days on Market100
Property Features for 1630-1634 Hyde St
General Information
Standard status
Active
Size
4,830 SF
Total Parking Spaces
2
Property subtype
Triplex
Units
Unit Mix
2 x 3BD/1BA, 1 x 2BD/1BA
Multifamily Units
3
Additional Details
Public Transit
Yes
Amenities
fireplace facades
paneling
hardwood floors
built-in china cabinetry
upgraded kitchens
breakfast nook
in-unit washer and dryer
interior staircase
rooftop
shared backyard
shared patio
Building Details
Building Size
4,830 SF
Year Built
1904
Construction
Victorian
Listing Agency:
Christie's Intl RE Sereno
Listed By:
Joni Toy · License #01107461
(925) 895-3755
Source:
Realestatenovo
Added: Jul 9
Changed: Oct 6
Last Checked: Oct 15 at 7:40AM
Displayed information is deemed reliable but is not guaranteed and should be independently verified. All listing content including descriptions, pricing, images are the copyrighted material of Christie's Intl RE Sereno

Ask AI about this property
Review the available facts, identify missing information and prepare questions for the agent.
Investment Insights
Based on property information with market context.
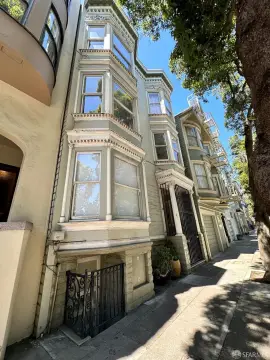
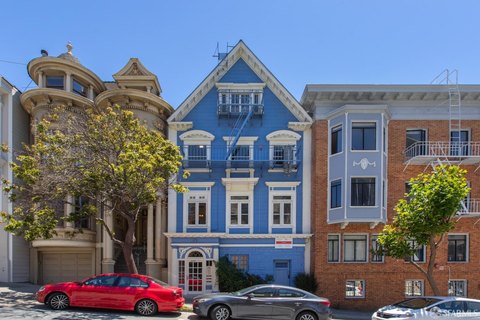
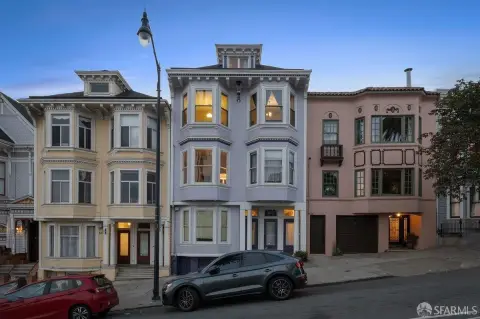
This 1904 Victorian triplex provides 4830+/- square feet of living space across two 3bd/1ba flats and one 2bd/1ba flat. Period character includes fireplace facades, wood paneling, hardwood floors, and built-in china cabinetry. The upgraded kitchens include breakfast nooks and a range, dishwasher, refrigerator, microwave, disposal, washer, and dryer in each flat. A two-car garage connects to an interior stairway leading to the newly installed rooftop.
Residents share a sunny backyard and patio, while all three flats have views toward the Golden Gate Bridge. The property is located at 1630-1634 Hyde St in San Francisco, near markets, restaurants, and cafes, with access to the Hyde Street Cable Car line.
Residents share a sunny backyard and patio, while all three flats have views toward the Golden Gate Bridge. The property is located at 1630-1634 Hyde St in San Francisco, near markets, restaurants, and cafes, with access to the Hyde Street Cable Car line.
Key Highlights
- Triplex with two 3bd/1ba flats and one 2bd/1ba flat
- 4830+/- square feet of total living space
- 1904 Victorian with fireplace facades, paneling, hardwood floors, and built‑in china cabinetry
Financial Insights
Estimated NOI and Cap Rate
NOI / Yr
$162,120
Cap Rate
4.38%
Suggested Prices Based on Cap Rates
Cap Rate 5%
$3,242,400
$3.2M
Cap Rate 7%
$2,316,000
$2.3M
Cap Rate 9%
$1,801,333
$1.8M
Market Conditions
NOI Build-Up for 4,830 SF
Gross rent
$246.3K $51.00/SF
− Vacancy
−$14.7K −$3.05/SF
EGI
$231.6K $47.95/SF
− OpEx
−$69.5K −$14.39/SF
NOI
$162.1K $33.57/SF
Area
ZIP 94109
Vacancy
5.98%
Lease Rate
$51.00 /SF/Yr
Expense Ratio
30.00%
Simulate Cap Rate and NOI
Suggested Prices Based on Cap Rates
Cap Rate 5%
$3,242,400
Cap Rate 7%
$2,316,000
Cap Rate 9%
$1,801,333
Alternative Uses
Best Use
Multifamily LT 5
$2.32M
$2.03M – $2.70M
NOI $162,120 @ 7.0% cap · market cap 4.38%
Second Best
Apartment 5plus
$2.06M
$1.80M – $2.40M
NOI $144,271 @ 7.0% cap · market cap 3.90%
Theoretical Best
Retail
$22.02M
$19.27M – $25.69M
NOI $1,541,381 @ 7.0% cap · market cap 41.67%
Zoning and permitted uses should be independently verified with authorities.
How Realmo checks its estimates
Property Analytics
Current Use
Lease Details
3
Residential units
Location Intelligence
Trade Area within ½ mile
10,528
Businesses Nearby
Explore this area
Business Placement
Demographics for 94109, CA
58,501
Population
39,043
Households
1.5
Avg Household Size
38
Median Age
65%
College-Educated
90%
High-School Grad
1.1 sq mi
ZIP Area
53,183
Density / Sq Mi
$112,201
Median Household Income
$89,841
Median Earnings
$2,172
Median Rent
$1,390,000
Median Home Value
Market
Vacancy Rate% for Multifamily in West region






Frequently Asked Questions
What type of property is this?
Triplex - Three flats feature upgraded kitchens, private laundry equipment, and access to a shared patio and sunny backyard.
Where is this triplex located?
The property is located at 1630-1634 Hyde St San Francisco, CA.
What is the asking price?
The asking price for this property is $3,699,000.
What are key features of this property?
This property features: Triplex with two 3bd/1ba flats and one 2bd/1ba flat; 4830+/- square feet of total living space; 1904 Victorian with fireplace facades, paneling, hardwood floors, and built‑in china cabinetry


