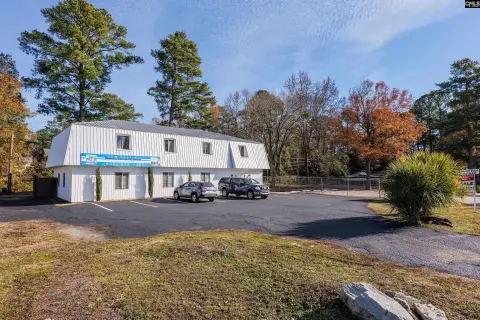
Renovated Office
For Sale
$538,000
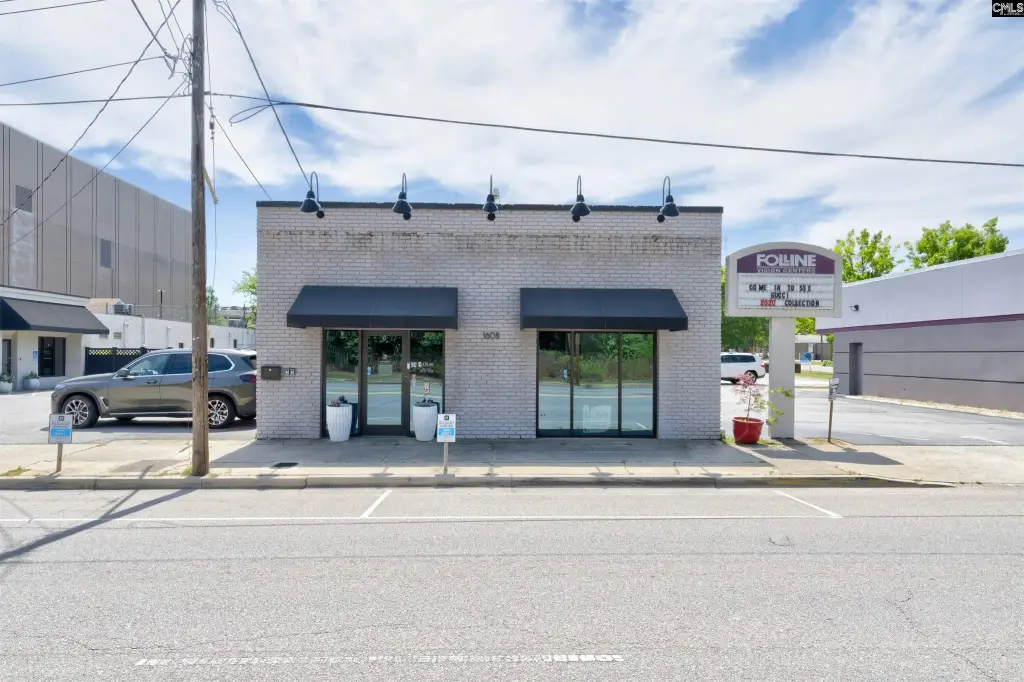
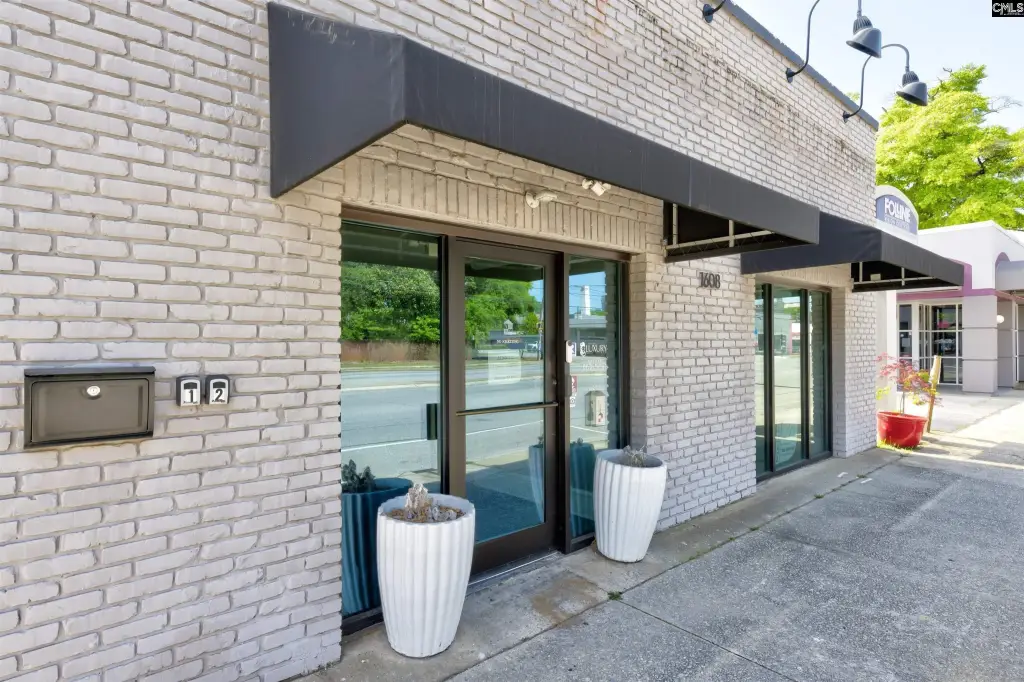
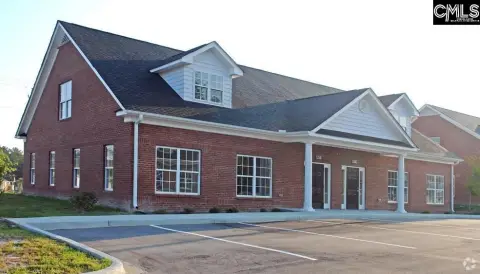
1608 Taylor Street, Columbia, SC 29201
COMMERCIAL/INDUSTRIAL, Columbia, SC
Property Size1,830 SF
Lot Size0.04 Acres
Price / SF$293.99
Days on Market151
Property Features for 1608 Taylor Street
General Information
Property type
Commercial Sale
Property subtype
Other
Zoning
CAC
Directions
On Taylor St. between Pickens Street and Henderson Street.
Subdivision
City of Columbia, Denny terrace, Lake Elizabeth
Standard status
Active
Size
1,830 SF
Lot size
0.04 Acres
Utilities
Cooling system
Central Air
Building Details
Floors in Building
1
Roof type
Membrane
Listing Agency:
Yip Premier Real Estate LLC
(803) 388-8798
Listed By:
Karen Yip · License #43725
(803) 546-2112
Added: May 19
Changed: Oct 2
Last Checked: Oct 16 at 5:06AM
MLS# 634477
Copyright © 2026 Consolidated MLS, SC. All rights reserved. All information provided by the listing agent/broker is deemed reliable but is not guaranteed and should be independently verified.

Ask AI about this property
Review the available facts, identify missing information and prepare questions for the agent.
Investment Insights
Based on property information with market context.
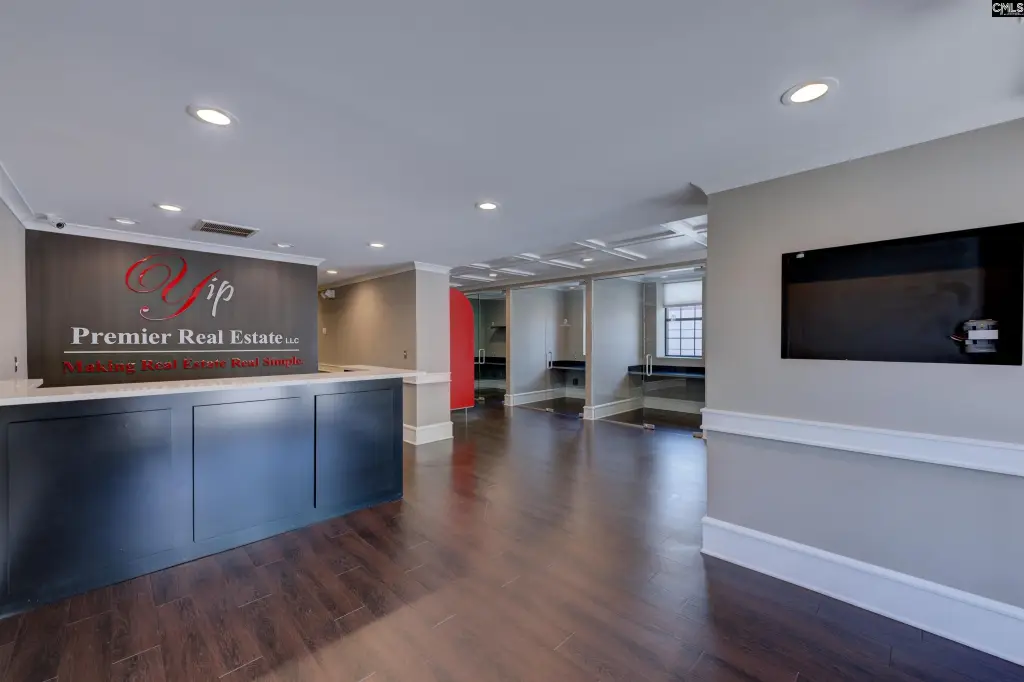
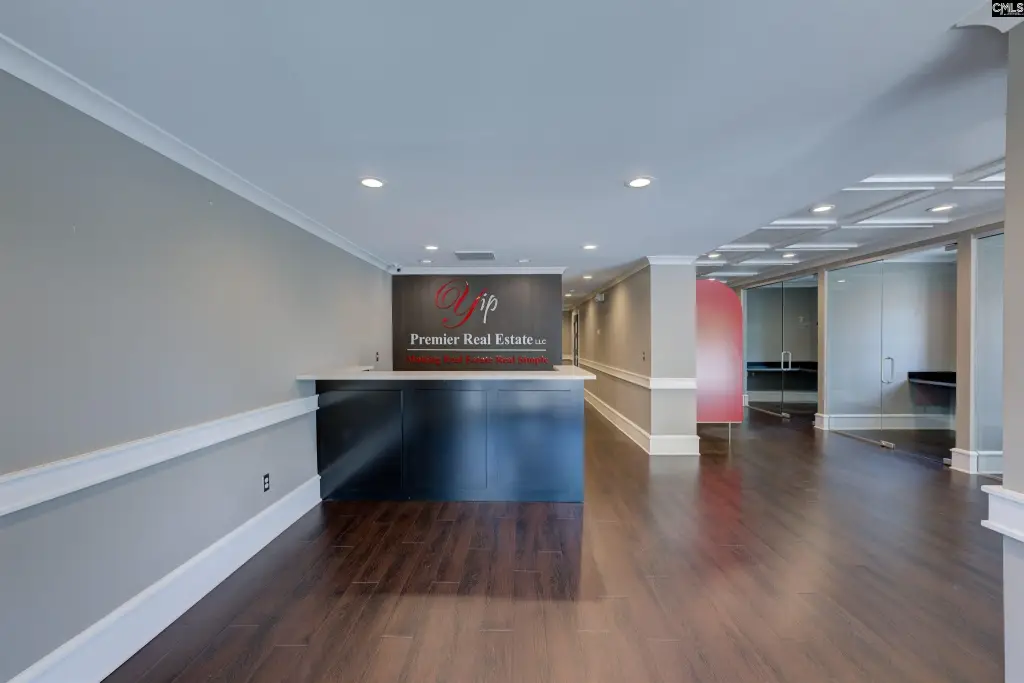
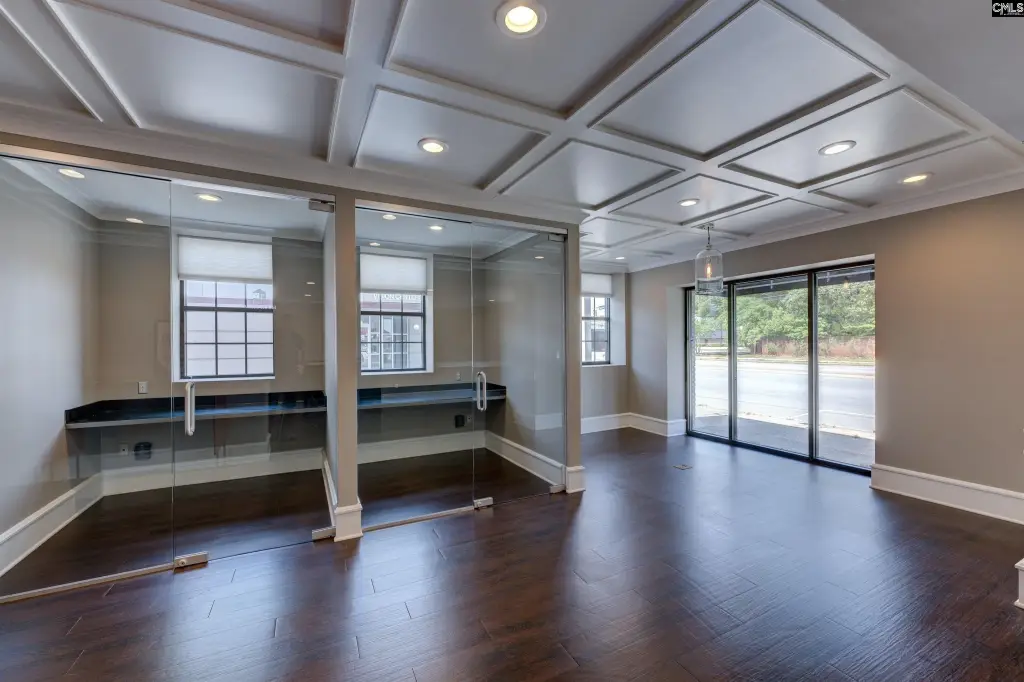
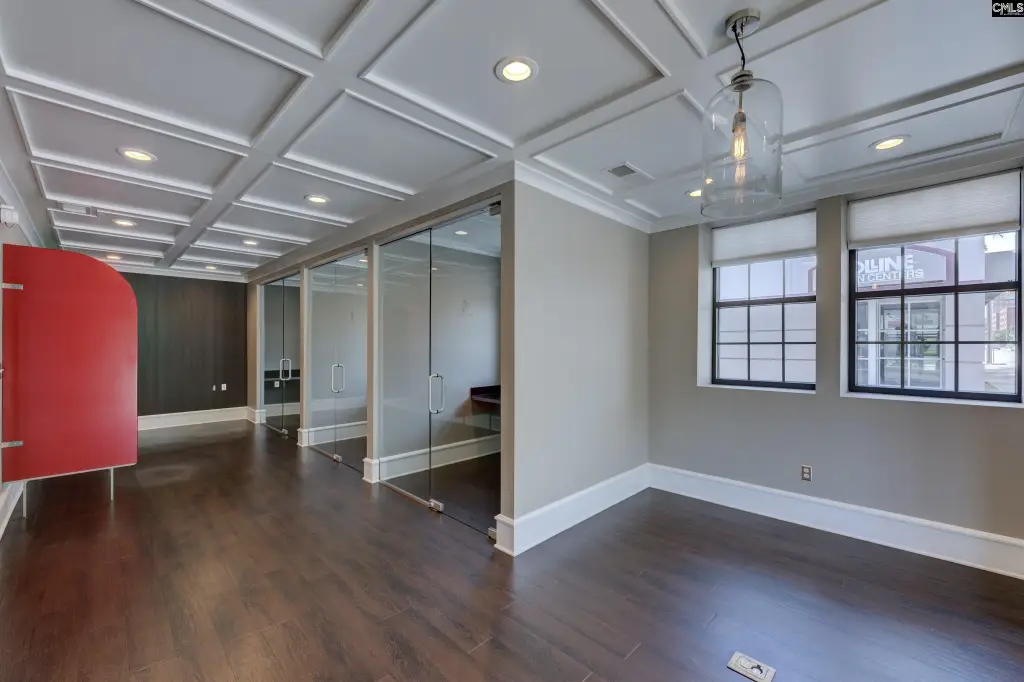
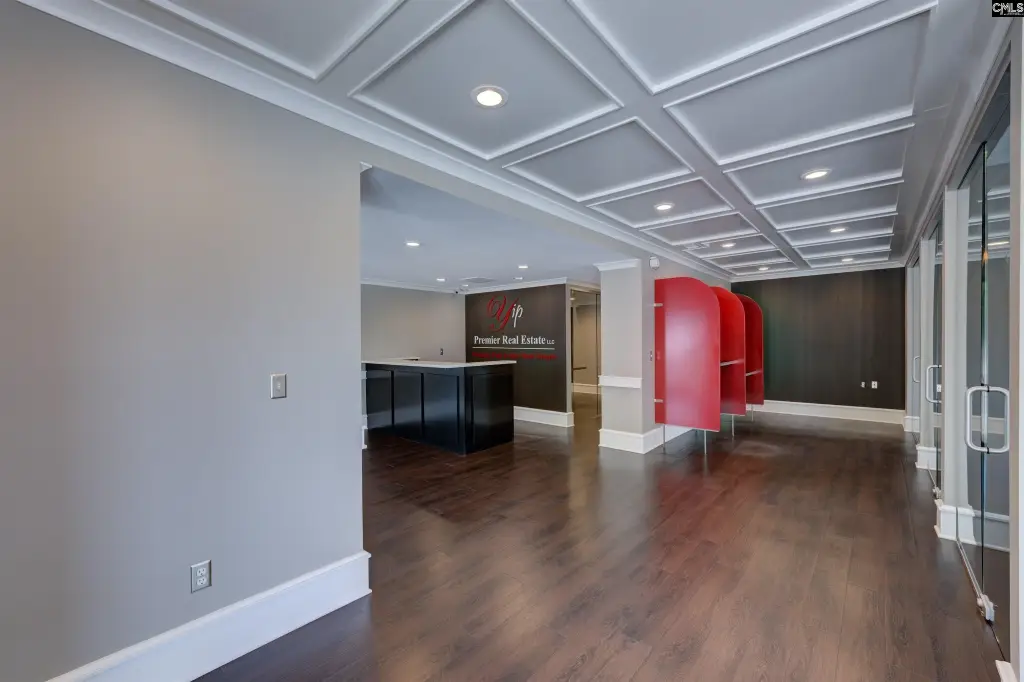
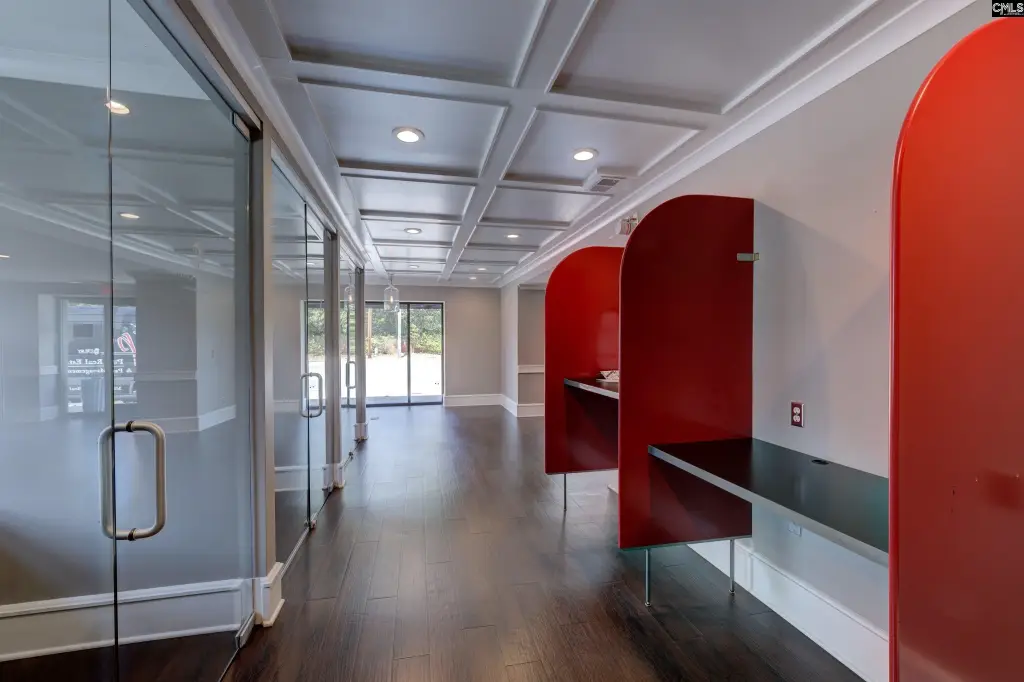
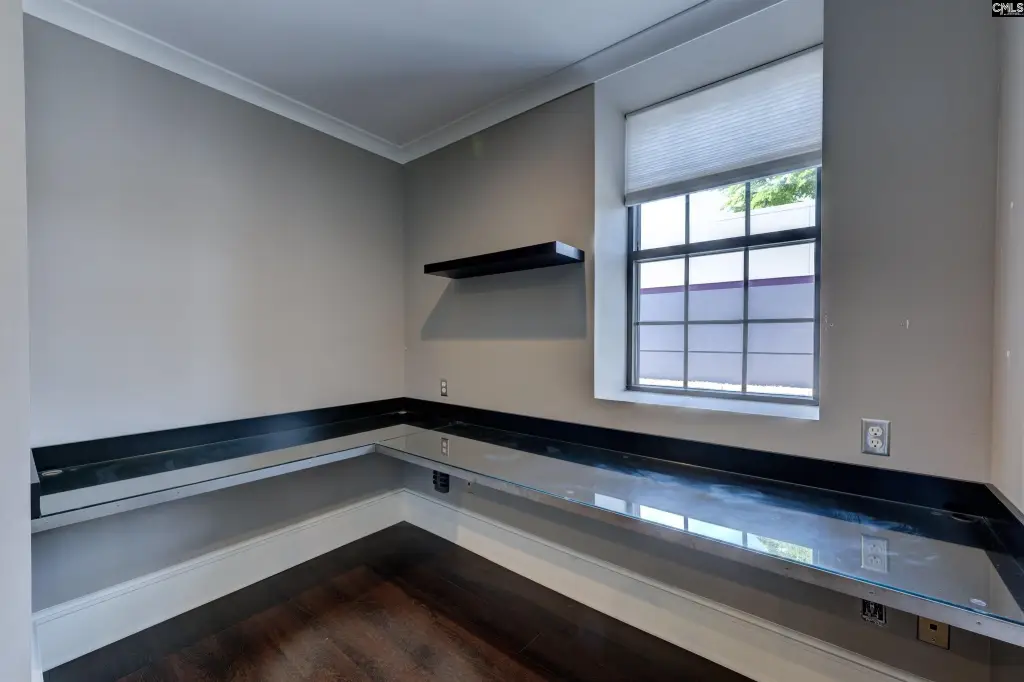
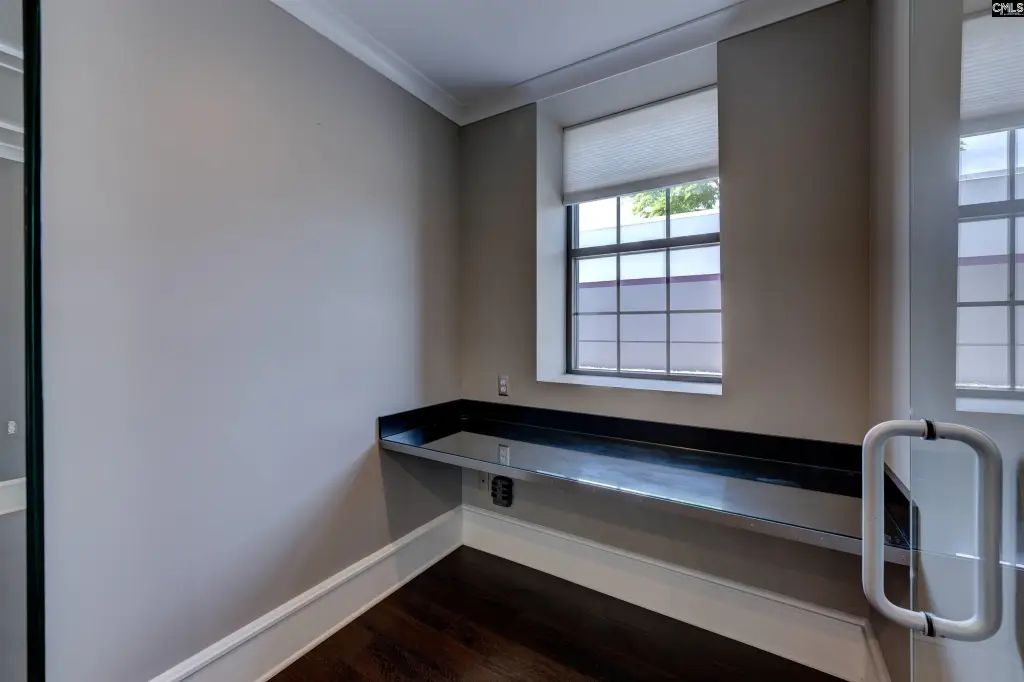
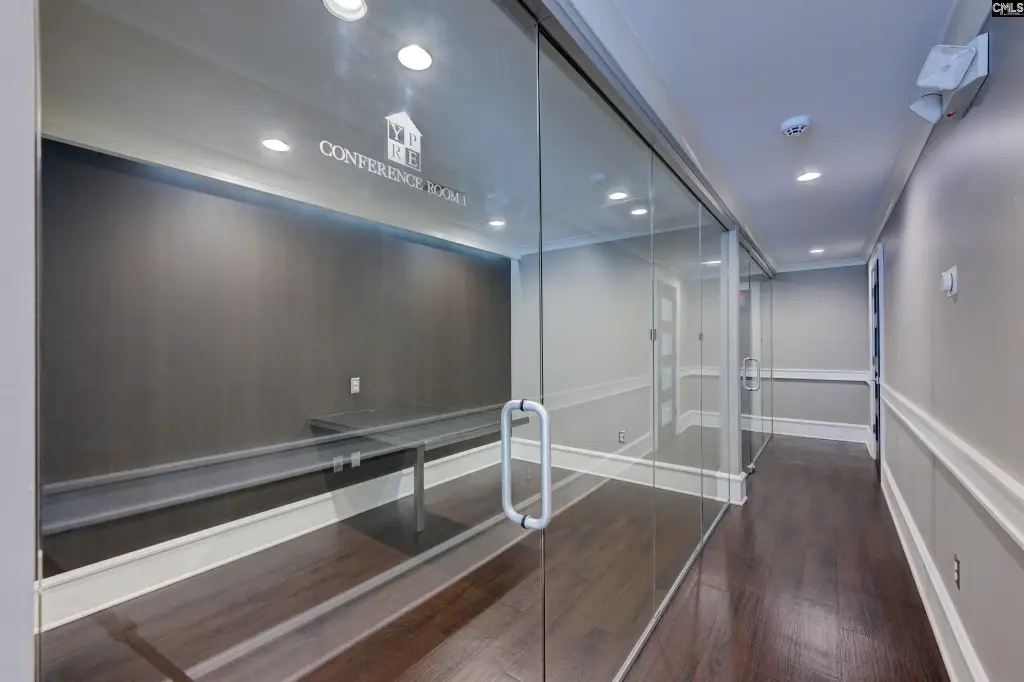
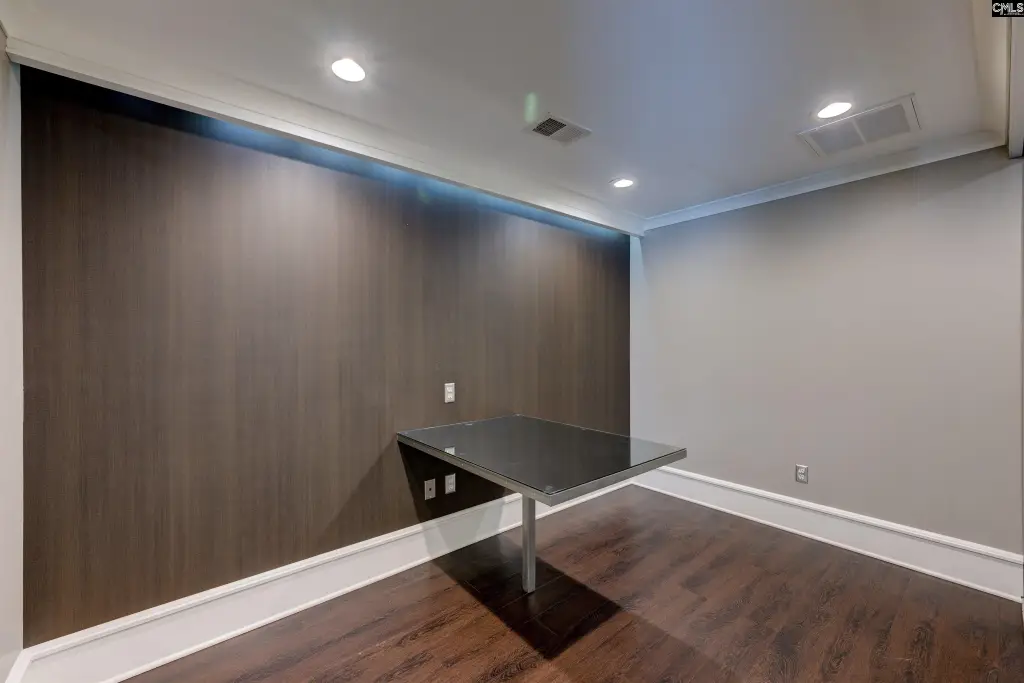
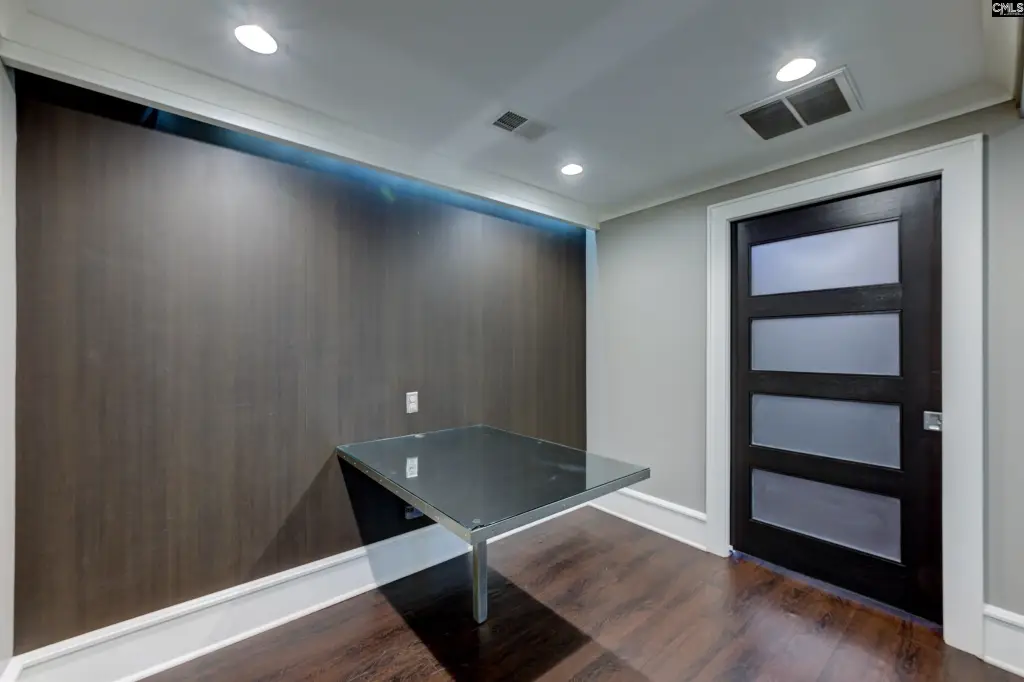
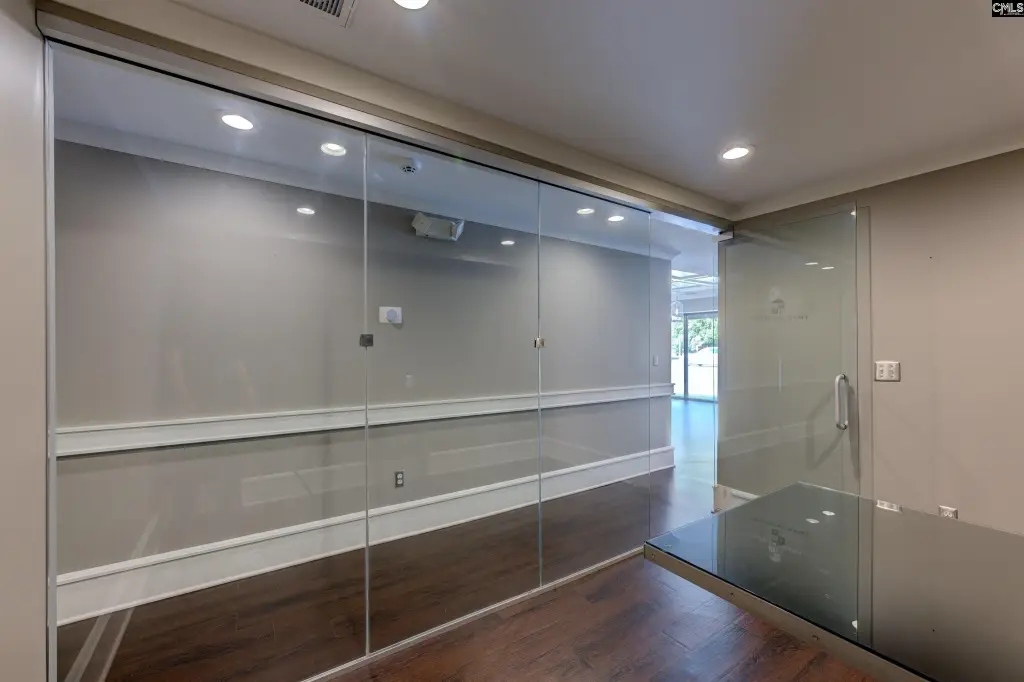
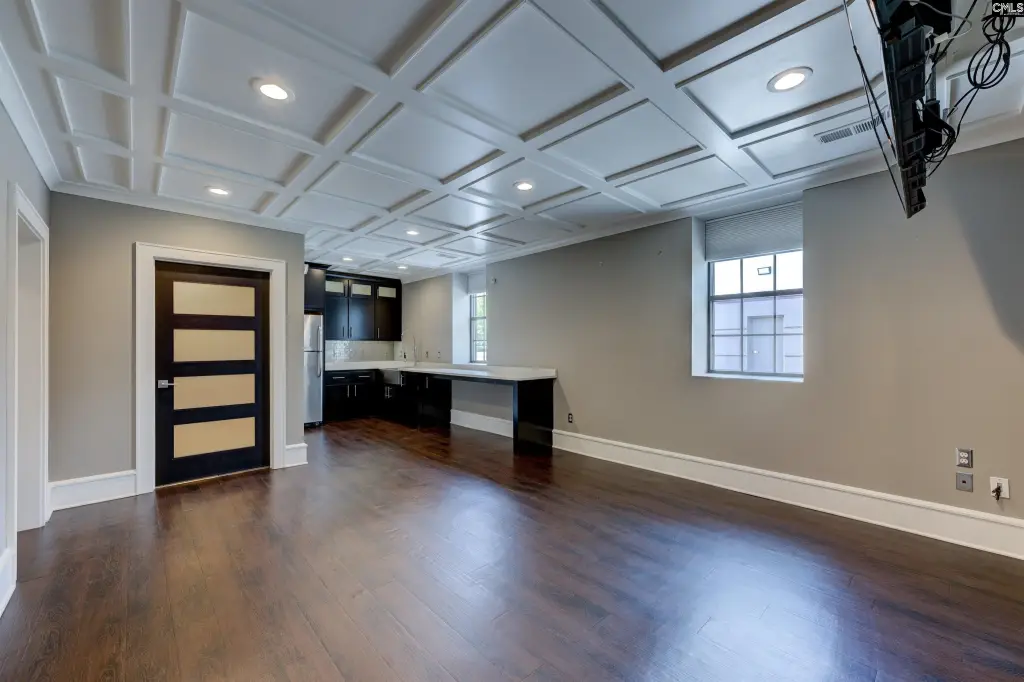
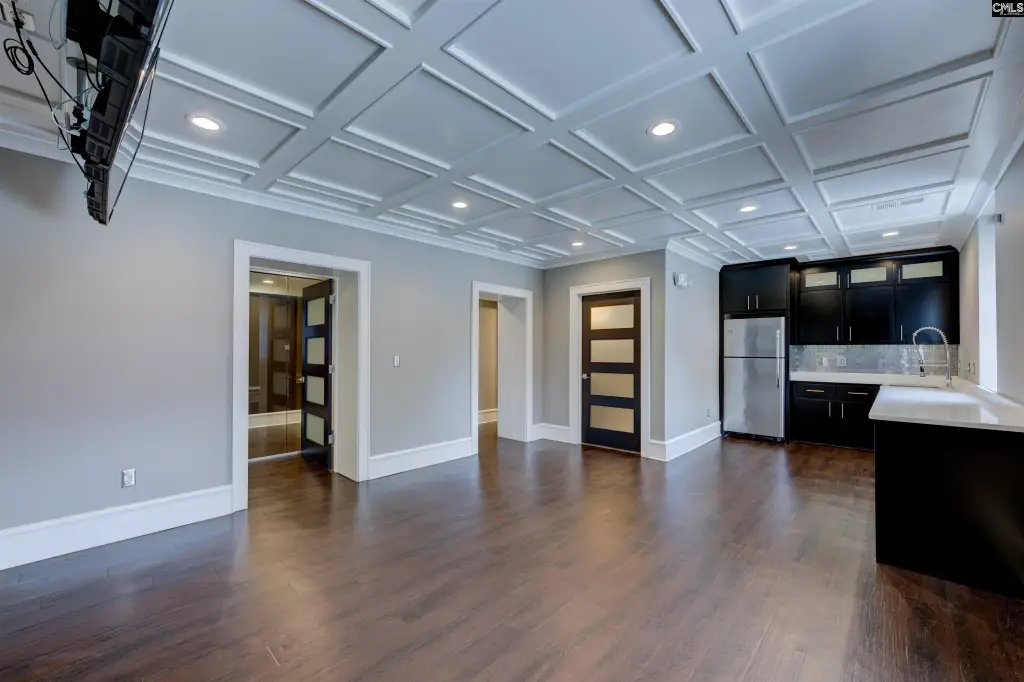
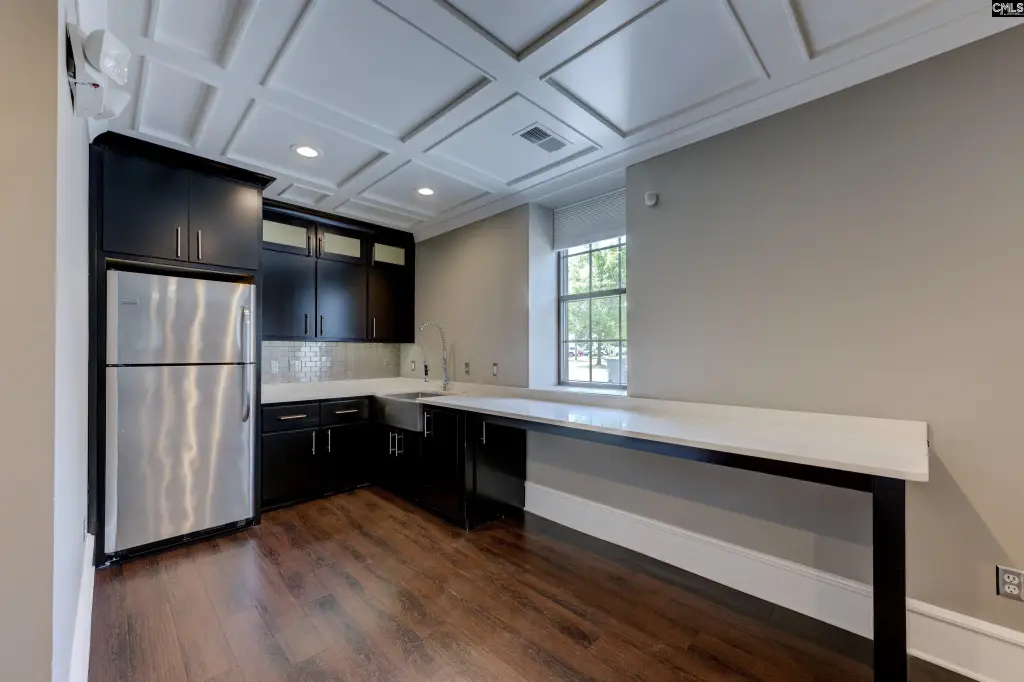
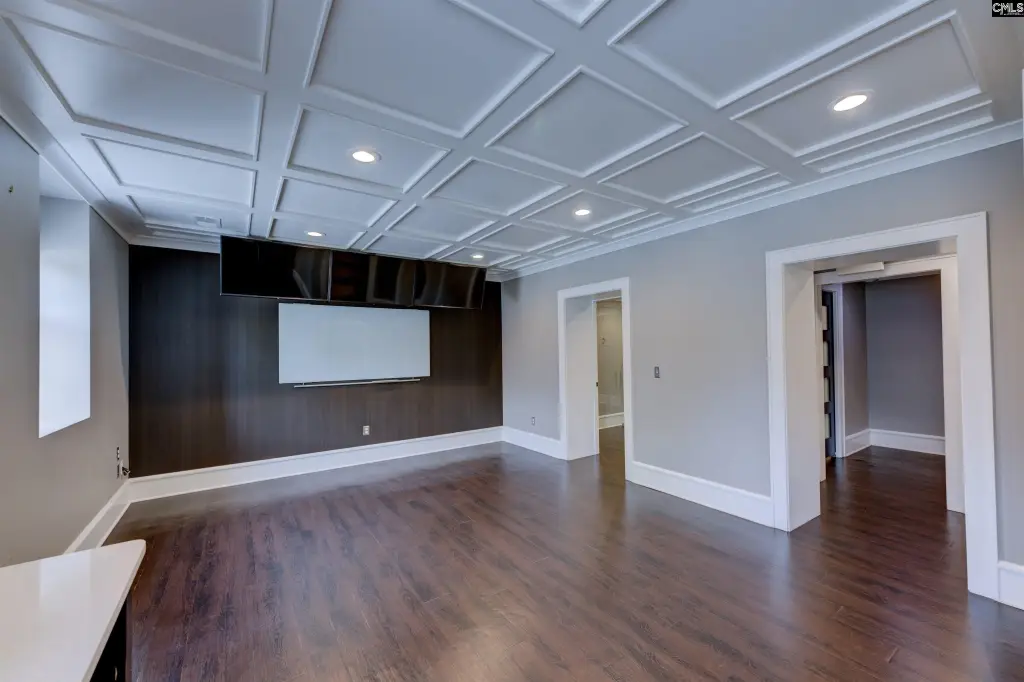
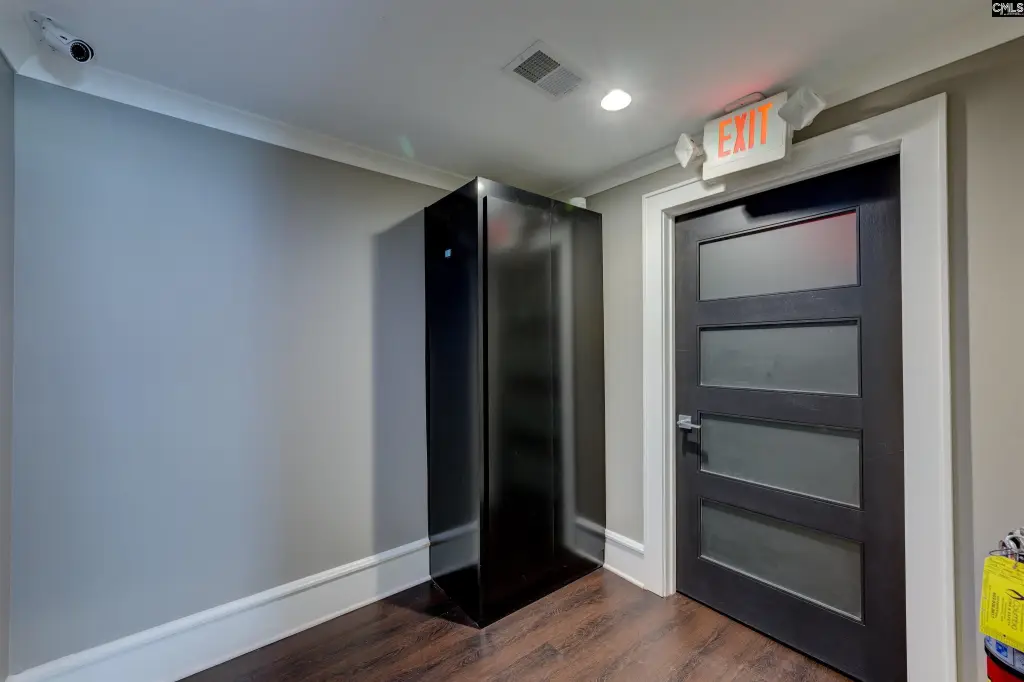
This renovated office unit provides 1,830 square feet of workspace on a 0.04-acre parcel. The layout includes an open work area, reception and lobby, workstations, a main office, and a room serving as both breakroom and conference space. Central air supports the interior, and the building has a membrane roof.
Located at 1608 Taylor Street in Columbia, the property offers ample street parking and CAC zoning. The configuration combines collaborative workspace with defined administrative areas in a compact office setting.
Located at 1608 Taylor Street in Columbia, the property offers ample street parking and CAC zoning. The configuration combines collaborative workspace with defined administrative areas in a compact office setting.
Key Highlights
- Renovated 1,830‑square‑foot office unit
- Open layout with reception area and lobby
- Workstations plus a dedicated main office
Financial Insights
Estimated NOI and Cap Rate
NOI / Yr
$21,740
Cap Rate
4.04%
Suggested Prices Based on Cap Rates
Cap Rate 5%
$434,800
$434.8K
Cap Rate 7%
$310,571
$310.6K
Cap Rate 9%
$241,556
$241.6K
Market Conditions
NOI Build-Up for 1,830 SF
Gross rent
$35.1K $19.20/SF
− Vacancy
−$6.1K −$3.36/SF
EGI
$29.0K $15.84/SF
− OpEx
−$7.2K −$3.96/SF
NOI
$21.7K $11.88/SF
Area
Columbia, SC
Vacancy
17.50%
Lease Rate
$19.20 /SF/Yr
Expense Ratio
25.00%
Simulate Cap Rate and NOI
Suggested Prices Based on Cap Rates
Cap Rate 5%
$434,800
Cap Rate 7%
$310,571
Cap Rate 9%
$241,556
Alternative Uses
Best Use
Office B
$310.6K
$271.8K – $362.3K
NOI $21,740 @ 7.0% cap · market cap 4.04%
Second Best
—
—
no second resolved use
Theoretical Best
Office A
$450.6K
$394.3K – $525.7K
NOI $31,543 @ 7.0% cap · market cap 5.86%
Zoning and permitted uses should be independently verified with authorities.
How Realmo checks its estimates
Property Analytics
Unlock full access to Insights
Subscribe to Realmo Intelligence
Open Analytics
Current Use
Location Intelligence
Trade Area within ½ mile
5,432
Businesses Nearby
Explore this area
Business Placement
Demographics for 29201, SC
25,259
Population
12,619
Households
2
Avg Household Size
25
Median Age
56%
College-Educated
92%
High-School Grad
11.5 sq mi
ZIP Area
2,196
Density / Sq Mi
$34,327
Median Household Income
$14,671
Median Earnings
$1,207
Median Rent
$238,200
Median Home Value
Check the figures for this property
Cap Rate, Value Estimation, Potential NOI and more
View Realmo Analytics
Market
Vacancy Rate% for Office in Columbia, SC



Frequently Asked Questions
What type of property is this?
Office units - Open-plan workspace with reception, workstations, and a combined breakroom and conference room.
Where is this office units located?
The property is located at 1608 Taylor Street Columbia, SC.
What is the asking price?
The asking price for this property is $538,000.
What are key features of this property?
This property features: Renovated 1,830‑square‑foot office unit; Open layout with reception area and lobby; Workstations plus a dedicated main office


