Fenced Flex Warehouse with
For Sale
Contact for pricing
1608 John Redditt Dr., Lufkin, TX 75904
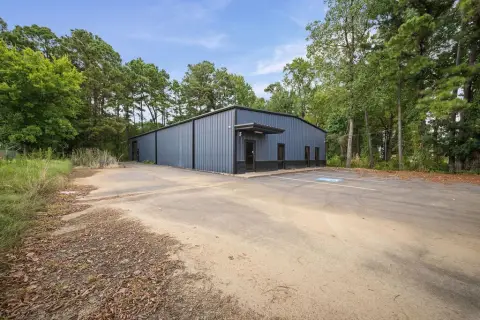
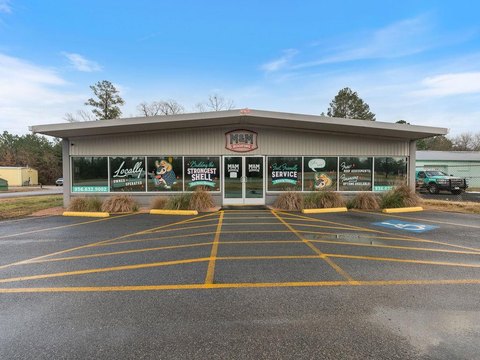
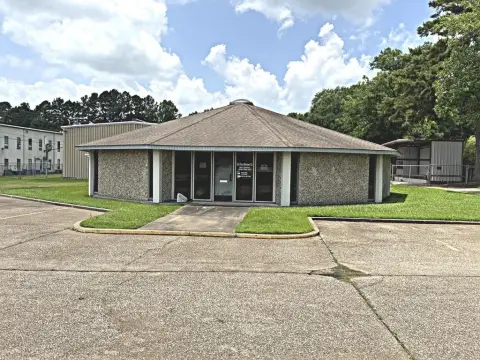
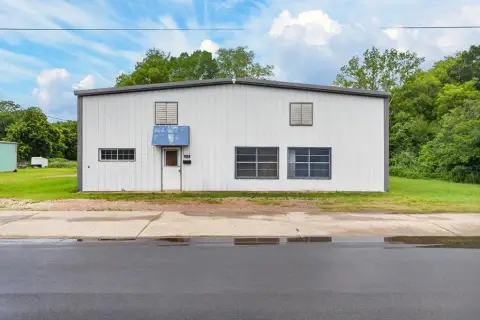
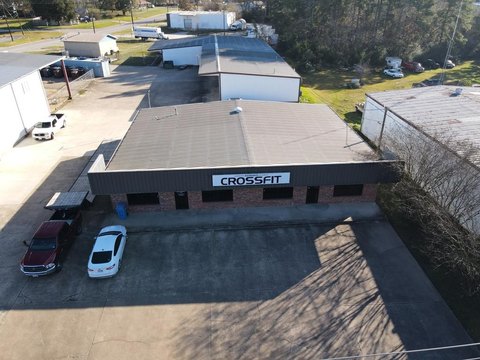
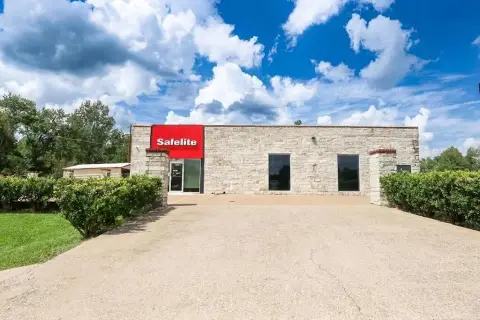
Lease-in-place flex facility with showroom, office, and warehouse space plus a fenced concrete yard.
Property Size7,500 SF
Price / SF$93.33
Days on Market367
Property Features for 1608 John Redditt Dr.
General Information
Standard status
Active
Size
7,500 SF
Property subtype
Industrial
Zoning
LM-Light Manufacturing
Occupancy
100%
Investment Type
Owner/User
Site & Location
Traffic Count
20,000 vehicles/day
Fenced Yard
Yes
Building Details
Year Built
1985
Buildings
1
Tenancy
Single
Listing Agency:
Gann Medford Real Estate Inc
Listed By:
Ben Moore · License #TX
(936) 635-6061
Source:
Crexi
Added: Oct 22, 2025
Changed: Oct 16
Last Checked: Oct 23 at 6:13AM
Displayed information is deemed reliable but is not guaranteed and should be independently verified. All listing content including descriptions, pricing, images are the copyrighted material of Gann Medford Real Estate Inc

Ask AI about this property
Review the available facts, identify missing information and prepare questions for the agent.
Investment Insights
Based on property information with market context.
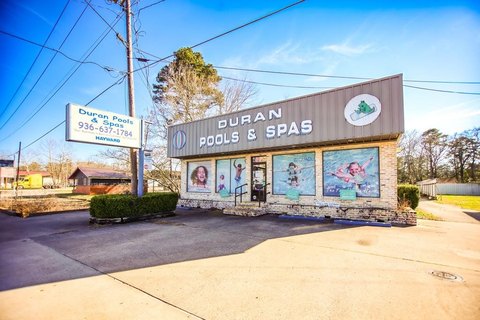
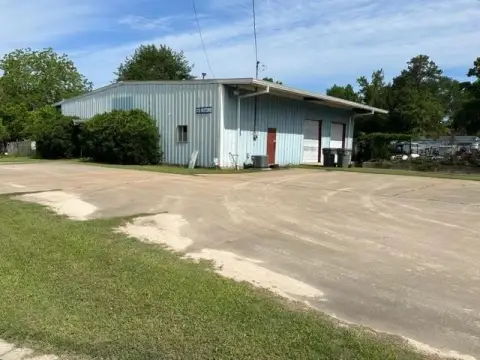
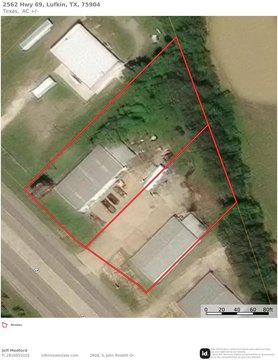
The property is a 7,500 SF flex-style facility that combines showroom, office, and warehouse space under one roof. It is fenced on three sides and includes more than 18,000 SF of concrete paving behind the fence, providing a dedicated yard area for operations or customer/service access. Ample parking is available on site.
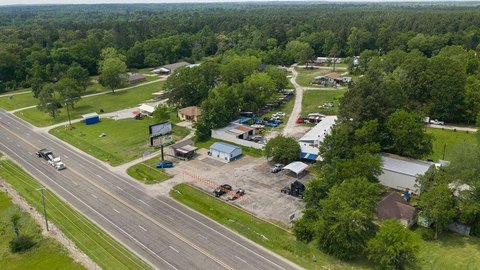
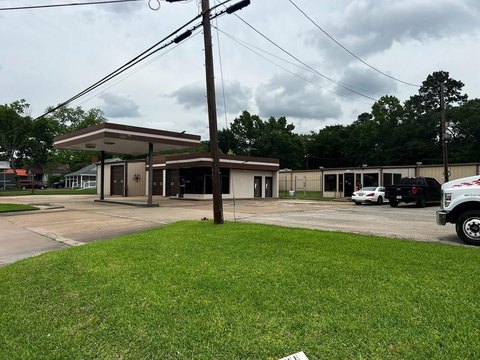
The site is positioned on a hard corner with a traffic light and high visibility, with an identified 20,000 annual average daily traffic count. Access is provided from North John Redditt Dr. and Lotus Lane, and the property is zoned for light manufacturing.
For buyers, the asset is offered with a 24-month active lease in place. The current tenant is Red Ball Oxygen, and the rent structure is described as producing an annual NOI of $45,000. With its combination of office/showroom space and warehouse and yard area, the layout may suit tenants or operators looking for a streamlined, single-site setup aligned with light manufacturing uses. A listing agent must accompany on showings with 24 hours’ notice.
The site is positioned on a hard corner with a traffic light and high visibility, with an identified 20,000 annual average daily traffic count. Access is provided from North John Redditt Dr. and Lotus Lane, and the property is zoned for light manufacturing.
For buyers, the asset is offered with a 24-month active lease in place. The current tenant is Red Ball Oxygen, and the rent structure is described as producing an annual NOI of $45,000. With its combination of office/showroom space and warehouse and yard area, the layout may suit tenants or operators looking for a streamlined, single-site setup aligned with light manufacturing uses. A listing agent must accompany on showings with 24 hours’ notice.
Key Highlights
- 1985‑built 7,500 SF commercial facility with showroom, office, and warehouse space under one roof
- 24‑month active lease in place; currently leased to Red Ball Oxygen with annual NOI of $45,000
- Hard corner with traffic light and 20,000 AADT (annual average daily traffic) count
Financial Insights
Estimated NOI and Cap Rate
NOI / Yr
$63,422
Cap Rate
9.06%
Suggested Prices Based on Cap Rates
Cap Rate 5%
$1,268,440
$1.3M
Cap Rate 7%
$906,029
$906.0K
Cap Rate 9%
$704,689
$704.7K
Market Conditions
NOI Build-Up for 7,500 SF
Gross rent
$102.6K $13.68/SF
− Vacancy
−$5.0K −$0.67/SF
EGI
$97.6K $13.01/SF
− OpEx
−$34.2K −$4.55/SF
NOI
$63.4K $8.46/SF
Area
Angelina County, TX
Vacancy
4.90%
Lease Rate
$13.68 /SF/Yr
Expense Ratio
35.00%
Simulate Cap Rate and NOI
Suggested Prices Based on Cap Rates
Cap Rate 5%
$1,268,440
Cap Rate 7%
$906,029
Cap Rate 9%
$704,689
Alternative Uses
Best Use
Flex RnD
$906.0K
$792.8K – $1.06M
NOI $63,422 @ 7.0% cap · market cap 9.06%
Second Best
Warehouse
$644.3K
$563.8K – $751.7K
NOI $45,104 @ 7.0% cap · market cap 6.44%
Theoretical Best
Office A
$2.11M
$1.85M – $2.47M
NOI $147,963 @ 7.0% cap · market cap 21.14%
Zoning and permitted uses should be independently verified with authorities.
How Realmo checks its estimates
Property Analytics
Who owns this building?
See the owner, sales and loan history
Open Analytics
Current Use
Lease Details
20,000 VPD
Traffic count
Yes
Fenced yard
Location Intelligence
Trade Area within ½ mile
90
Businesses Nearby
Balanced
Demand for This Use
Explore this area
Business Placement
Demographics for 75904, TX
34,680
Population
14,829
Households
2.3
Avg Household Size
38
Median Age
19%
College-Educated
88%
High-School Grad
160.5 sq mi
ZIP Area
216
Density / Sq Mi
$59,325
Median Household Income
$36,711
Median Earnings
$1,086
Median Rent
$173,000
Median Home Value
Check the figures for this property
Cap Rate, Value Estimation, Potential NOI and more
View Realmo Analytics
Market
Vacancy Rate% for Industrial in South region

Frequently Asked Questions
What type of property is this?
Flex space - Lease-in-place flex facility with showroom, office, and warehouse space plus a fenced concrete yard.
Where is this flex space located?
The property is located at 1608 John Redditt Dr. Lufkin, TX.
What is the asking price?
The asking price for this property is $700,000.
What are key features of this property?
This property features: 1985‑built 7,500 SF commercial facility with showroom, office, and warehouse space under one roof; 24‑month active lease in place; currently leased to Red Ball Oxygen with annual NOI of $45,000; Hard corner with traffic light and 20,000 AADT (annual average daily traffic) count


