Historic Pensacola Building For
For Sale
$815,000
16 West La Rua Street, Pensacola, FL 32501
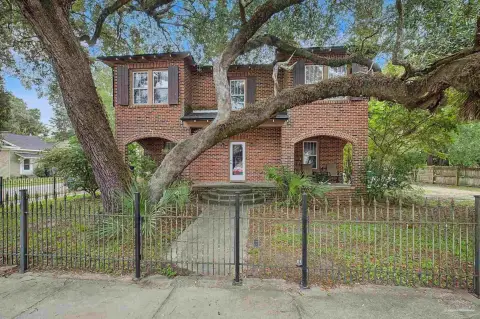
Charming historic building in Pensacola's vibrant arts and culture scene.
Property Size3,038 SF
Price / SF$268.27
Days on Market328
Property Features for 16 West La Rua Street
General Information
Standard status
Active
Size
3,038 SF
Class
B
Property subtype
Office
Building Details
Building Size
3,038 SF
Year Built
1900
Listing Agency:
Bellcore Commercial
Listed By:
Robert Bell · License #FL #SL698346
(850) 232-2587
Source:
Bellcorecommercial
Added: Nov 21, 2025
Changed: Oct 3
Last Checked: Oct 14 at 9:57PM
Displayed information is deemed reliable but is not guaranteed and should be independently verified. All listing content including descriptions, pricing, images are the copyrighted material of Bellcore Commercial
Investment Insights
Based on property information with market context.
This historic building, constructed in 1900, offers 3,038 square feet of space and is zoned PR-2, allowing for versatile usage. The property is ideally suited for use as an office, creative space, or loft. Located in the heart of the Pensacola area, the property offers investment potential, blending historic architecture with modern possibilities. The surrounding neighborhood features a thriving arts and culture scene, with renowned eateries, galleries, and boutiques. Nearby landmarks include the Pensacola Museum of Art and the Palafox Market. The location also offers proximity to the scenic waterfront and historic sites, presenting an investment opportunity within a dynamic community that blends creativity and commerce.
Key Highlights
- Prime location in the heart of the Pensacola area, offering access to a thriving arts and culture scene, renowned eateries, galleries, and boutiques.
- Versatile PR‑2 zoning allows for office, creative, or loft space.
- Charming 3,038 SF historic building built in 1900, brimming with character and unique architectural details.
Financial Insights
Estimated NOI and Cap Rate
NOI / Yr
$51,236
Cap Rate
6.29%
Suggested Prices Based on Cap Rates
Cap Rate 5%
$1,024,720
$1.0M
Cap Rate 7%
$731,943
$731.9K
Cap Rate 9%
$569,289
$569.3K
Market Conditions
NOI Build-Up for 3,038 SF
Gross rent
$76.2K $25.08/SF
− Vacancy
−$7.9K −$2.59/SF
EGI
$68.3K $22.49/SF
− OpEx
−$17.1K −$5.62/SF
NOI
$51.2K $16.87/SF
Area
Escambia County, FL
Vacancy
10.34%
Lease Rate
$25.08 /SF/Yr
Expense Ratio
25.00%
Simulate Cap Rate and NOI
Suggested Prices Based on Cap Rates
Cap Rate 5%
$1,024,720
Cap Rate 7%
$731,943
Cap Rate 9%
$569,289
Alternative Uses
Best Use
Office B
$731.9K
$640.5K – $853.9K
NOI $51,236 @ 7.0% cap · market cap 6.29%
Second Best
—
—
no second resolved use
Theoretical Best
Office A
$891.6K
$780.2K – $1.04M
NOI $62,413 @ 7.0% cap · market cap 7.66%
Zoning and permitted uses should be independently verified with authorities.
How Realmo checks its estimates
Property Analytics
Unlock full access to Insights
Subscribe to Realmo Intelligence
Open Analytics
Current Use
Location Intelligence
Trade Area within ½ mile
2,621
Businesses Nearby
Explore this area
Business Placement
Demographics for 32501, FL
10,960
Population
5,505
Households
2
Avg Household Size
41
Median Age
30%
College-Educated
86%
High-School Grad
3.7 sq mi
ZIP Area
2,962
Density / Sq Mi
$39,127
Median Household Income
$31,312
Median Earnings
$964
Median Rent
$277,500
Median Home Value
Check the figures for this property
Cap Rate, Value Estimation, Potential NOI and more
View Realmo Analytics
Market
Vacancy Rate% for Office in South region

Questions? Ask Rey
Realmo’s AI knows this listing — price, zoning, demand, history. Ask anything.


Frequently Asked Questions
What type of property is this?
Office units - Charming historic building in Pensacola's vibrant arts and culture scene.
Where is this office units located?
The property is located at 16 West La Rua Street Pensacola, FL.
What is the asking price?
The asking price for this property is $815,000.
What are key features of this property?
This property features: Prime location in the heart of the Pensacola area, offering access to a thriving arts and culture scene, renowned eateries, galleries, and boutiques.; Versatile PR‑2 zoning allows for office, creative, or loft space.; Charming 3,038 SF historic building built in 1900, brimming with character and unique architectural details.


