Mixed-Use Retail and Office
16 S Perry Street Montgomery, AL 36104
For Sale
$650,000
COMMERCIAL - Montgomery, AL
Property Size2,439 SF
Price / SF$266.50
Days on Market142
Property Features for 16 S Perry Street
General Information
- Property type
- Commercial Sale
- Property subtype
- Other
- Parking
- 2
- Standard status
- Active
- APN
- 10-03-07-3-303-027.001
- Size
- 2,439 SF
Taxes and HOA fees
- Tax Description
- COM SW INT PERRY ST & DEXTER AVE TH S 140 TO POB TH S 20 TH W 75 TH N 20 TH E 75 TO POB
- Tax Annual Amount
- 1219
Building Details
- Year built
- 1870
- Floors in Building
- 2
- Flooring type
- Tile, Carpet
- Building materials
- BrickVeneer, Concrete
Listing Agency:
RE/MAX Properties LLC
(334) 361-9300
Listed By:
Paul S. Harper · License #0067249
(334) 361-9300
Added: Mar 5
Changed: Jul 7
Last Checked: Jul 25 at 10:06PM
MLS# 584401
Copyright © 2026 Montgomery Area Association of Realtors MLS. All rights reserved. All information provided by the listing agent/broker is deemed reliable but is not guaranteed and should be independently verified.
Investment Insights
Based on property information with market context.
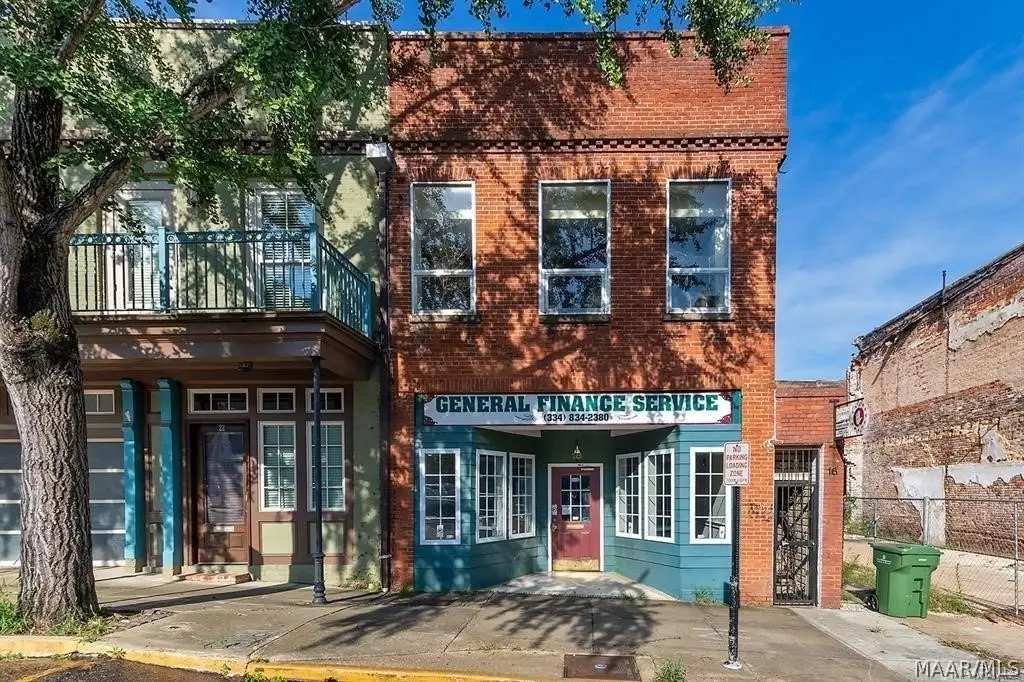
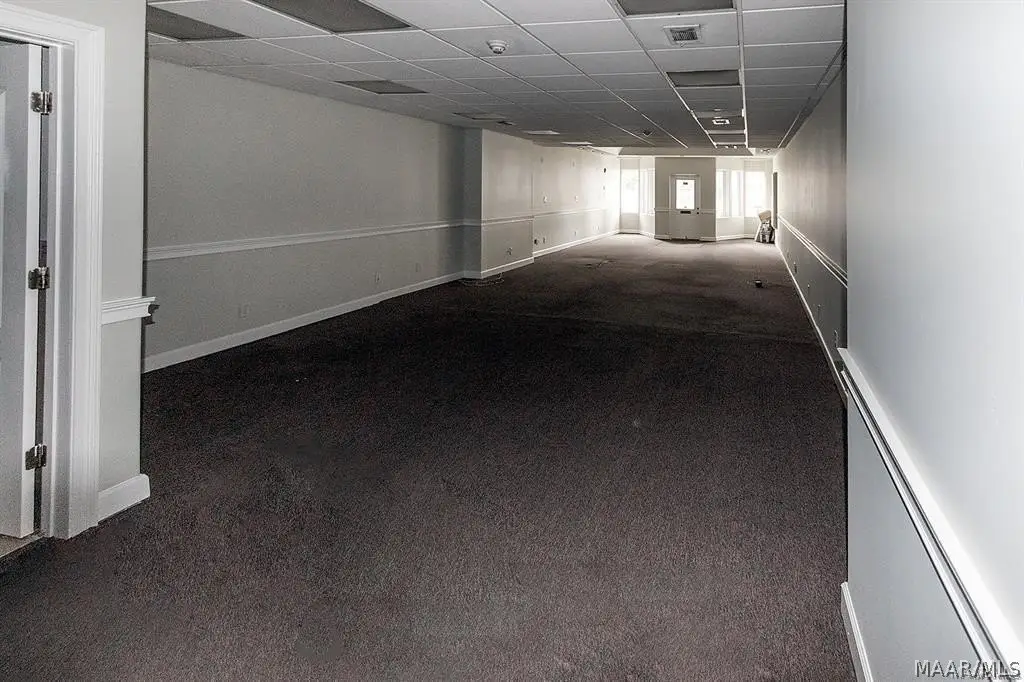
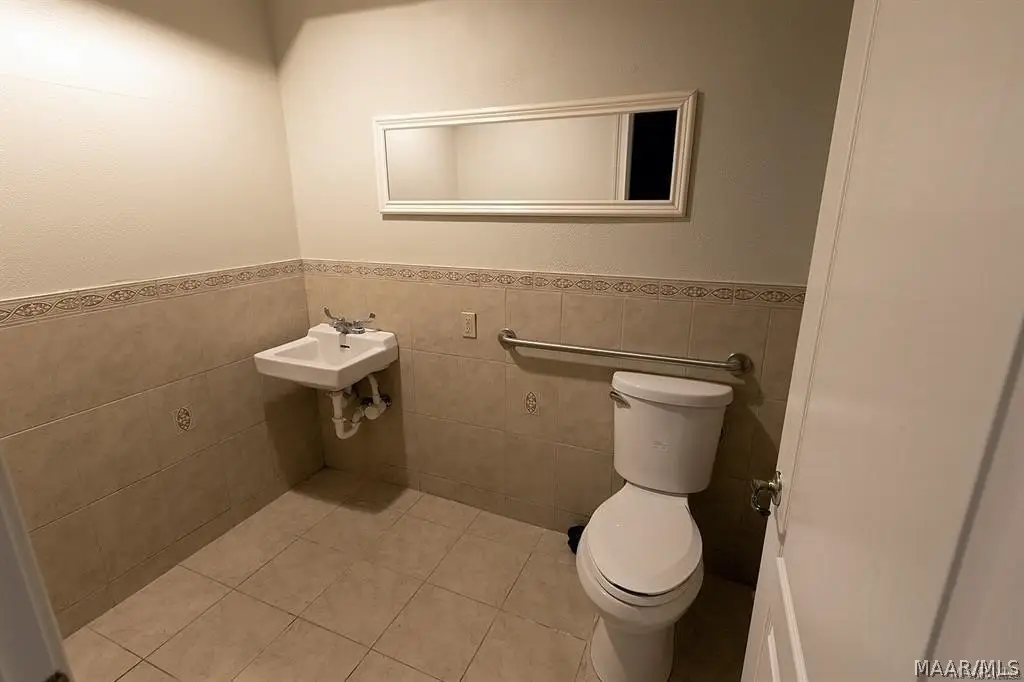
This mixed-use commercial building offers a two-level configuration designed for adaptable business use. The downstairs area has been freshly painted and includes two bathrooms, providing a clean, ready-to-occupy base for storefront or customer-facing operations. Upstairs features a waiting area, kitchenette, two additional bathrooms, and office space, creating a practical separation between reception and work areas.
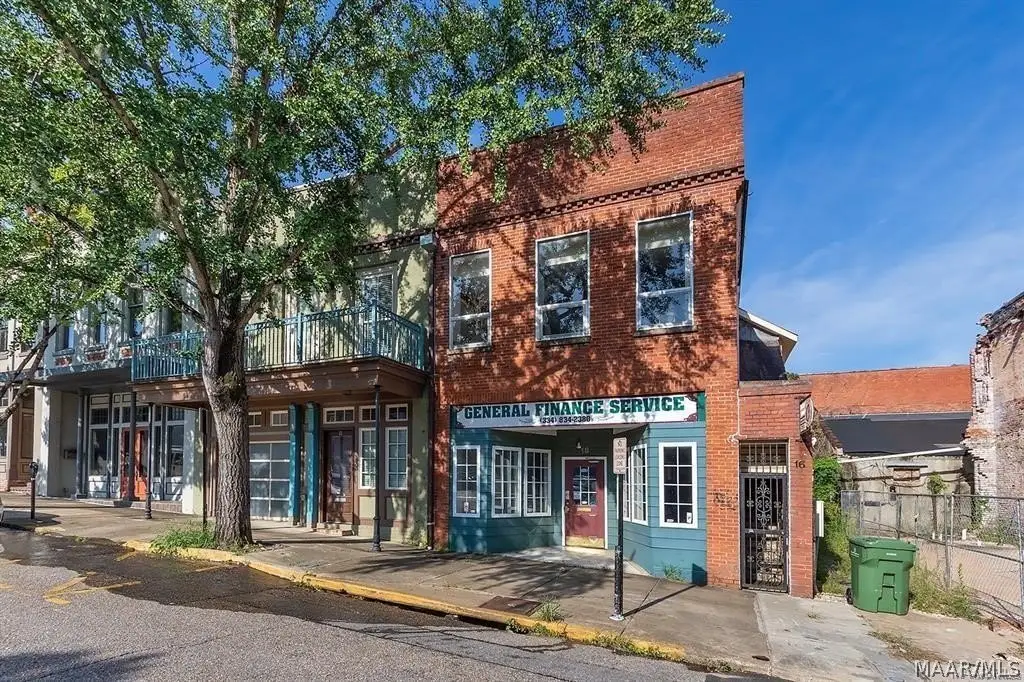
Located at 16 S Perry Street in Montgomery, Alabama (36104), the property is positioned in downtown Montgomery. Public remarks describe the setting as walkable to nearby restaurants, shops, and cultural/entertainment options, with convenient access to major transportation hubs and highways.
The space is well suited for tenants seeking both customer interface and back-office functionality under one roof, given the downstairs restroom provisions and the upstairs combination of waiting area, kitchenette, and office space. The building’s described historic charm and architectural character may also appeal to businesses looking for a distinctive environment for employees and visitors. With a versatile floor plan and multiple restroom facilities, this property can accommodate a range of commercial concepts that benefit from having separate levels for different functions.
Located at 16 S Perry Street in Montgomery, Alabama (36104), the property is positioned in downtown Montgomery. Public remarks describe the setting as walkable to nearby restaurants, shops, and cultural/entertainment options, with convenient access to major transportation hubs and highways.
The space is well suited for tenants seeking both customer interface and back-office functionality under one roof, given the downstairs restroom provisions and the upstairs combination of waiting area, kitchenette, and office space. The building’s described historic charm and architectural character may also appeal to businesses looking for a distinctive environment for employees and visitors. With a versatile floor plan and multiple restroom facilities, this property can accommodate a range of commercial concepts that benefit from having separate levels for different functions.
Key Highlights
- Commercial building with historic character; built in 1870
- Construction materials include brick veneer and concrete
- Downstairs freshly painted and includes two bathrooms
Financial Insights For Retail
Simulate Cap Rate and NOI
NOI Build-Up
- Vacancy
- income lost from leasable area expected to sit empty during the year — subtracted from gross rent.
- EGI (Effective Gross Income)
- gross rent minus vacancy losses — the realistic income before paying operating costs.
- OpEx (Operating Expenses)
- recurring costs to operate the property (property tax, insurance, utilities, maintenance, management) — excludes financing and capital improvements.
- NOI (Net Operating Income)
- income a property generates after operating costs but before financing and taxes.
| Component | $ | $/SF |
|---|---|---|
| Gross rent | $41.0k | $16.80 |
| − Vacancy | −$2.3k | −$0.94 |
| EGI | $38.7k | $15.86 |
| − OpEx | −$11.6k | −$4.76 |
| NOI | $27.1k | $11.10 |
2,439 SF · lease $16.80/SF/yr · vacancy 5.60% · expense 30.00%
Alternative Uses
Best Use
Retail
$386.8K
$338.5K – $451.3K
NOI $27,076 @ 7.0% cap · market cap 4.17%
Second Best
—
—
no second resolved use
Theoretical Best
Office A
$505.8K
$442.5K – $590.1K
NOI $35,403 @ 7.0% cap · market cap 5.45%
Zoning and permitted uses should be independently verified with local authorities.
Property Analytics
Property Profile
Location Intelligence
Current Use by Public Records
Gaylor Bishop & Son
Electrical Service




FAQs
What type of property is this?
Storefront property - Two-level layout with freshly painted downstairs space and upstairs waiting area, kitchenette, offices, and four bathrooms.
Where is this storefront property located?
The property is located at 16 S Perry Street Montgomery, AL.
What is the asking price?
The asking price for this property is $650,000.
What are key features of this property?
This property features: Commercial building with historic character; built in 1870; Construction materials include brick veneer and concrete; Downstairs freshly painted and includes two bathrooms


