Renovated Mixed-Use
For Sale
$1,399,000
Pending
1567 LAKE BALDWIN Lane, Orlando, FL 32814
Residential Income, ORLANDO, FL
Property Size3,129 SF
Lot Size0.09 Acres
Days on Market152
Property Features for 1567 LAKE BALDWIN Lane
General Information
Property type
Residential Multi Family
Property subtype
Triplex
Zoning
PD
Rooms
Family Room
Pets allowed
Yes
Interior features
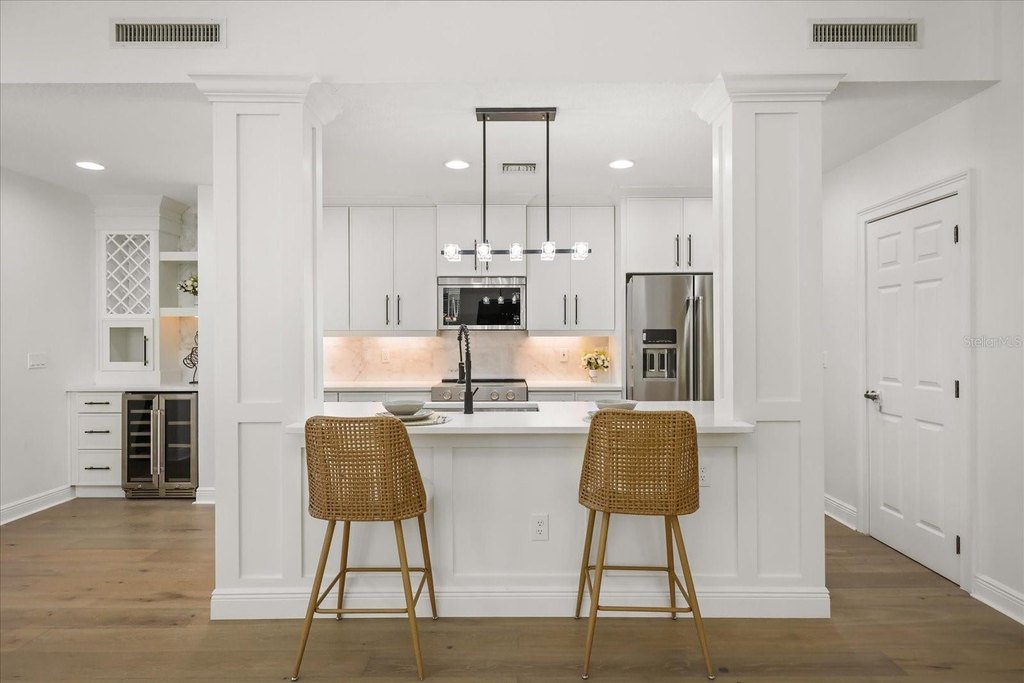
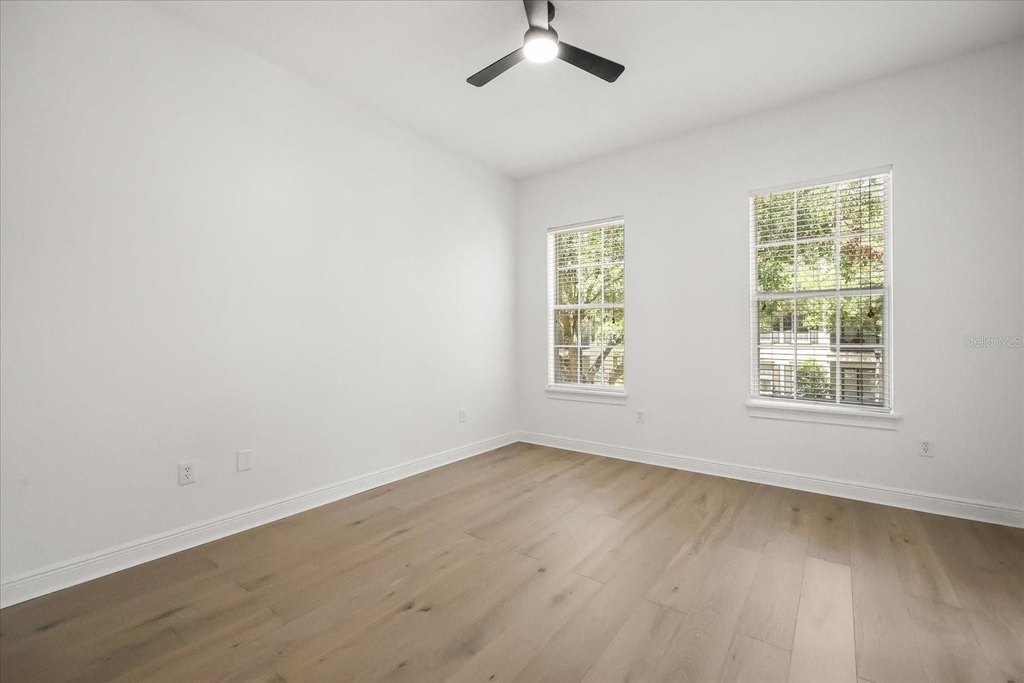
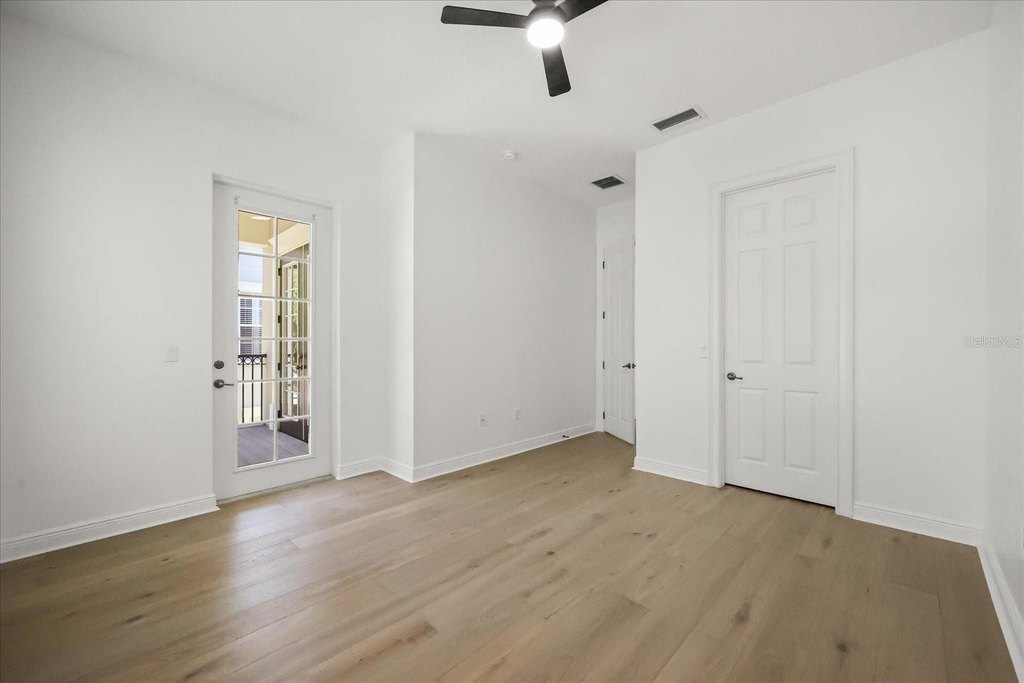
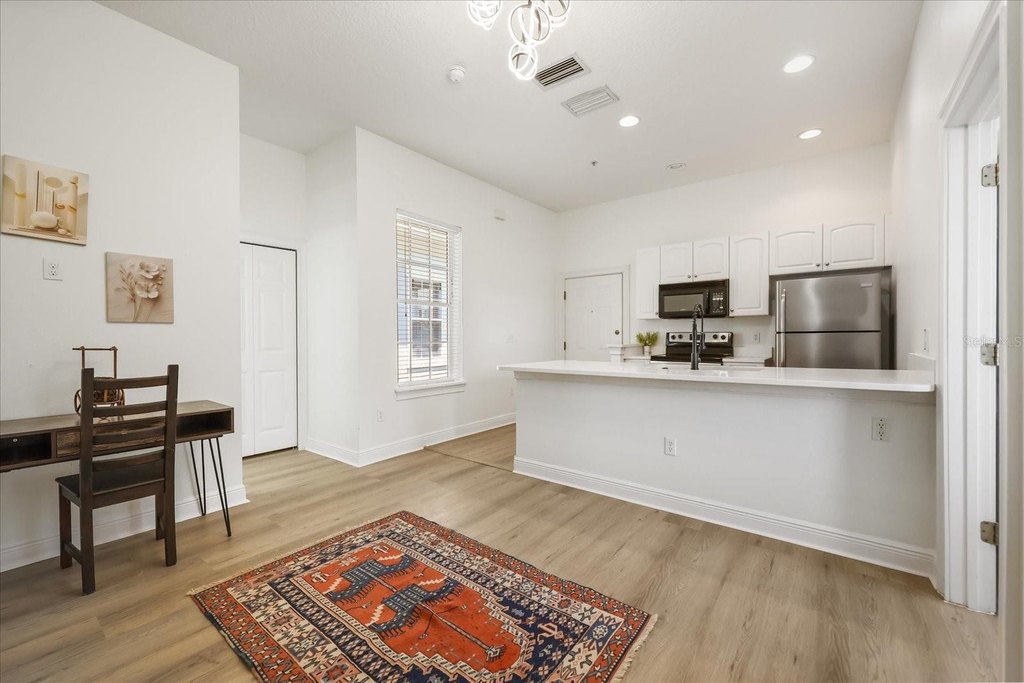
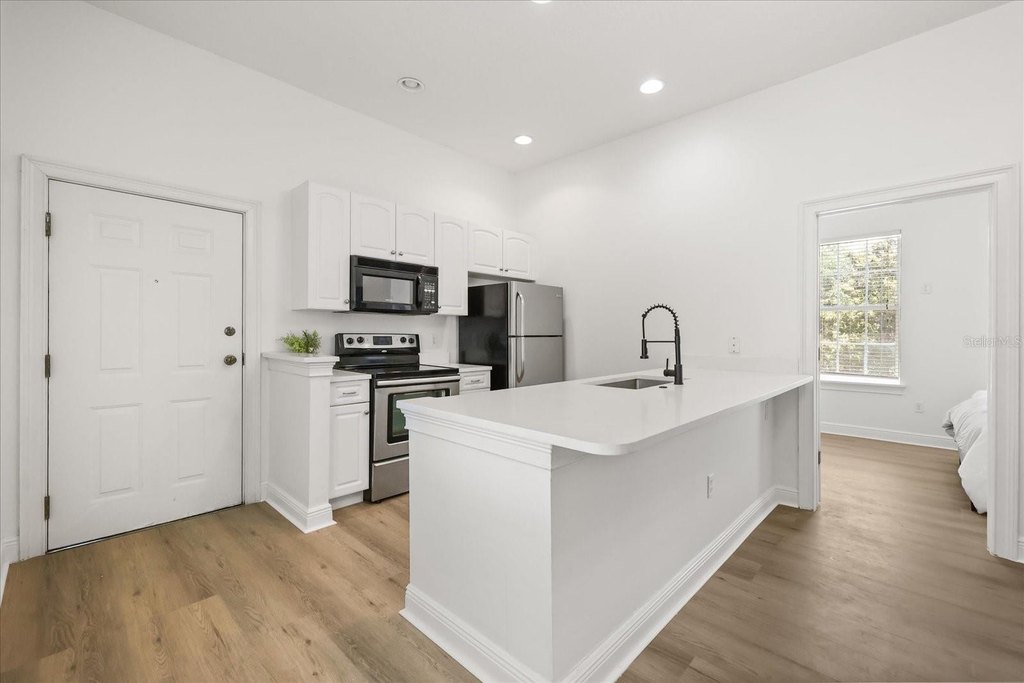
Ceiling Fans(s), Eat-in Kitchen, High Ceilings, Kitchen/Family Room Combo, Open Floorplan, Solid Surface Counters, Solid Wood Cabinets, Stone Counters, Walk-In Closet(s)
Exterior features
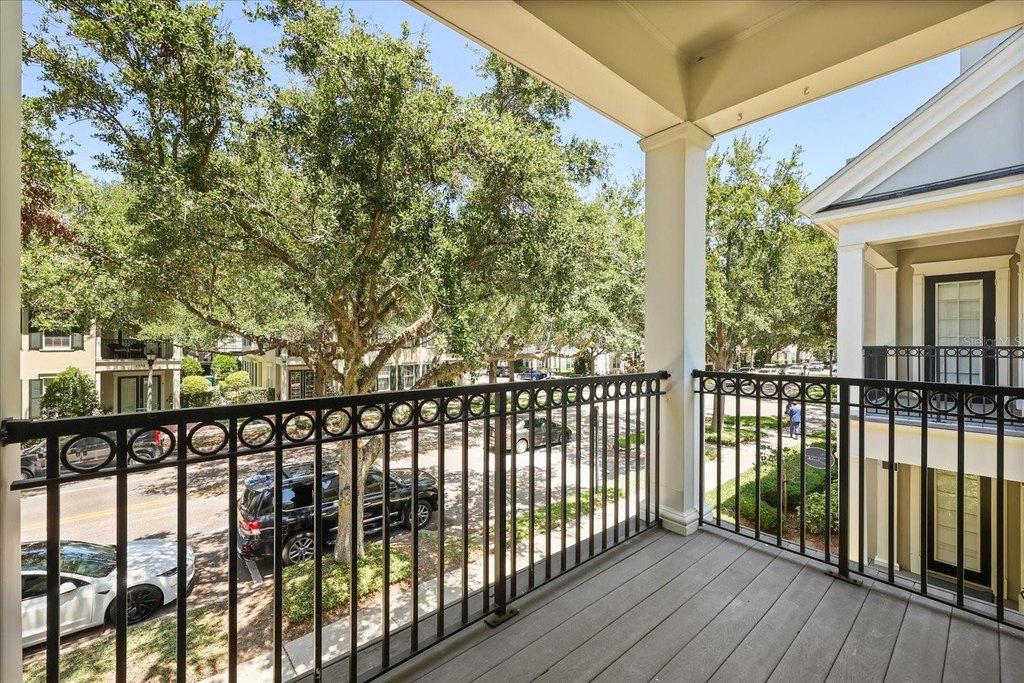
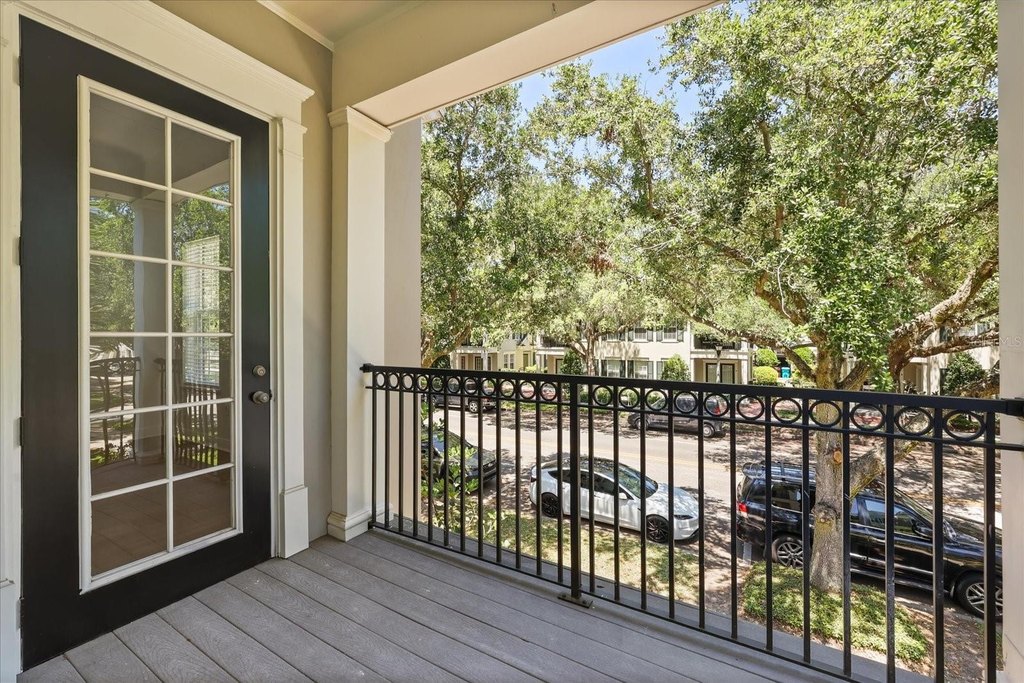
Balcony, Lighting, Rain Gutters, Sidewalk, Sprinkler Metered
Subdivision
BALDWIN PARKA
Elementary school
Baldwin Park Elementary
Middle school
Glenridge Middle
High school
Winter Park High
Directions
Head N on Bennet rd, turn right on New Broad st, turn right on Common way rd, turn left on Lake Baldwin ln, property will be on the right.
Standard status
Pending
APN
21-22-30-0531-01-470
Size
3,129 SF
Lot size
0.09 Acres
Taxes and HOA fees
Tax Year
2025
Tax Description
BALDWIN PARK UNIT 8A 61/77 LOT 1470
Tax Annual Amount
15030
Legal Description
BALDWIN PARK UNIT 8A 61/77 LOT 1470
Utilities
Sewer type
Public Sewer
Heating system
Central
Cooling system
Central Air
Water source
Public
Amenities
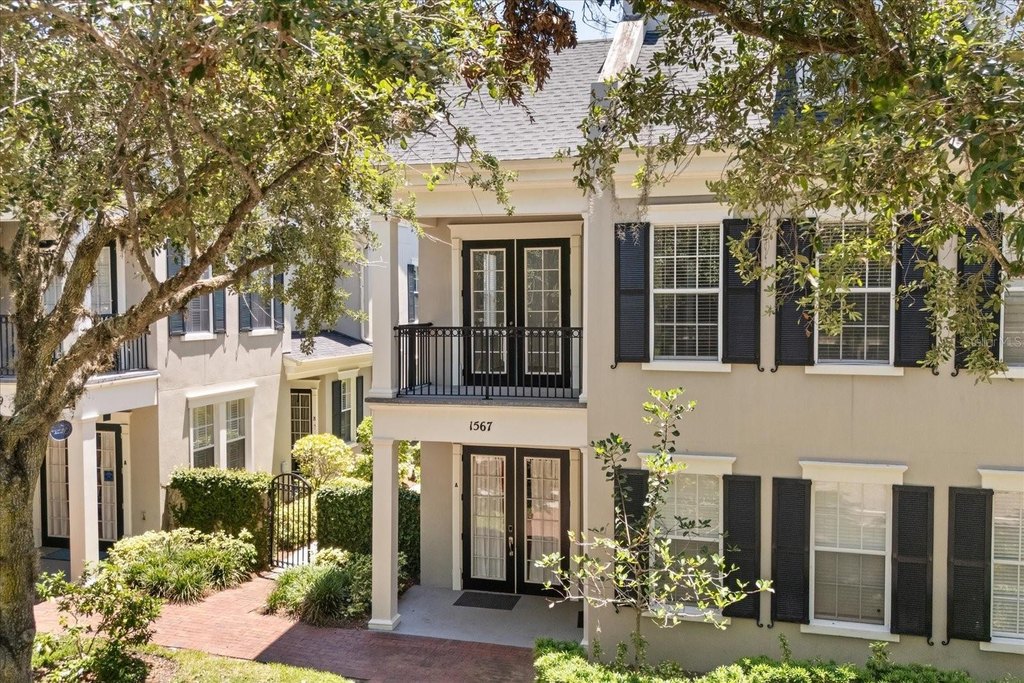
private balcony
in-unit laundry
Building Details
Year built
2006
Building materials
Block, Stucco
Roof type
Shingle
Listing Agency:
COMPASS FLORIDA LLC
(407) 203-9441
Listed By:
Ahmad Hassan, PA · License #3305257
(718) 641-9358
Added: May 8
Changed: Sep 23
Last Checked: Oct 6 at 9:06PM
MLS# O6406181
Copyright © 2026 Stellar MLS. All rights reserved. All information provided by the listing agent/broker is deemed reliable but is not guaranteed and should be independently verified.
Investment Insights
Based on property information with market context.
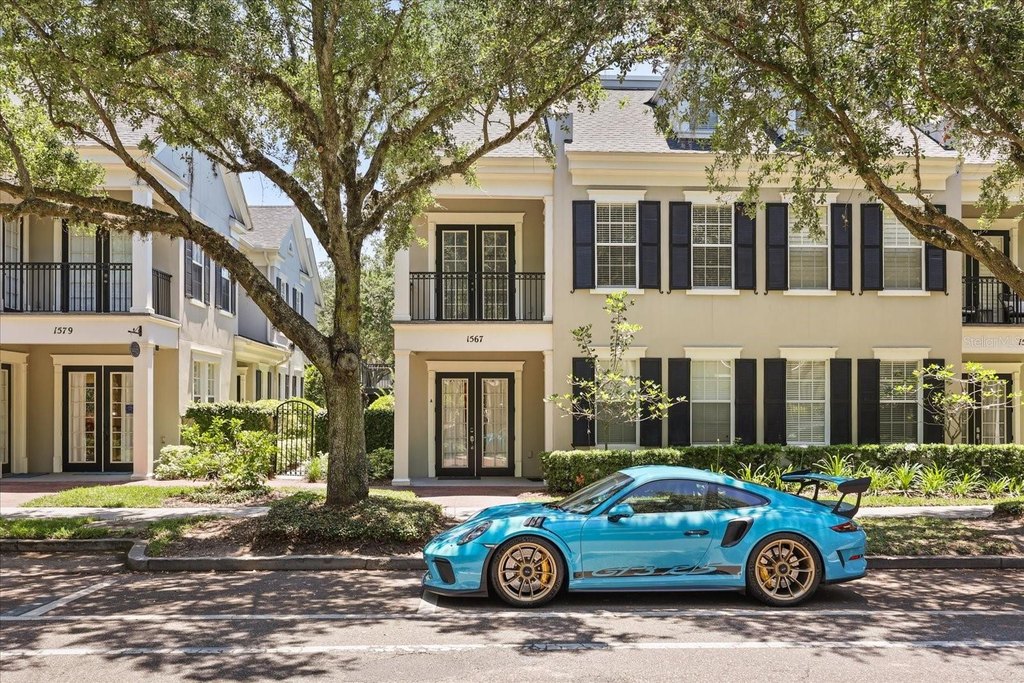
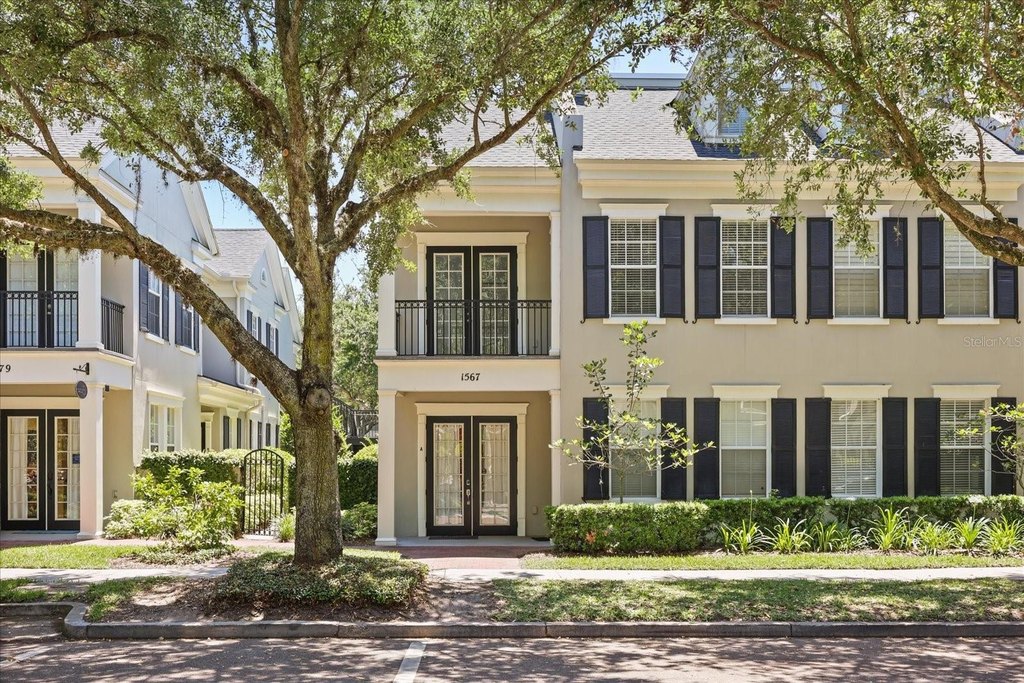
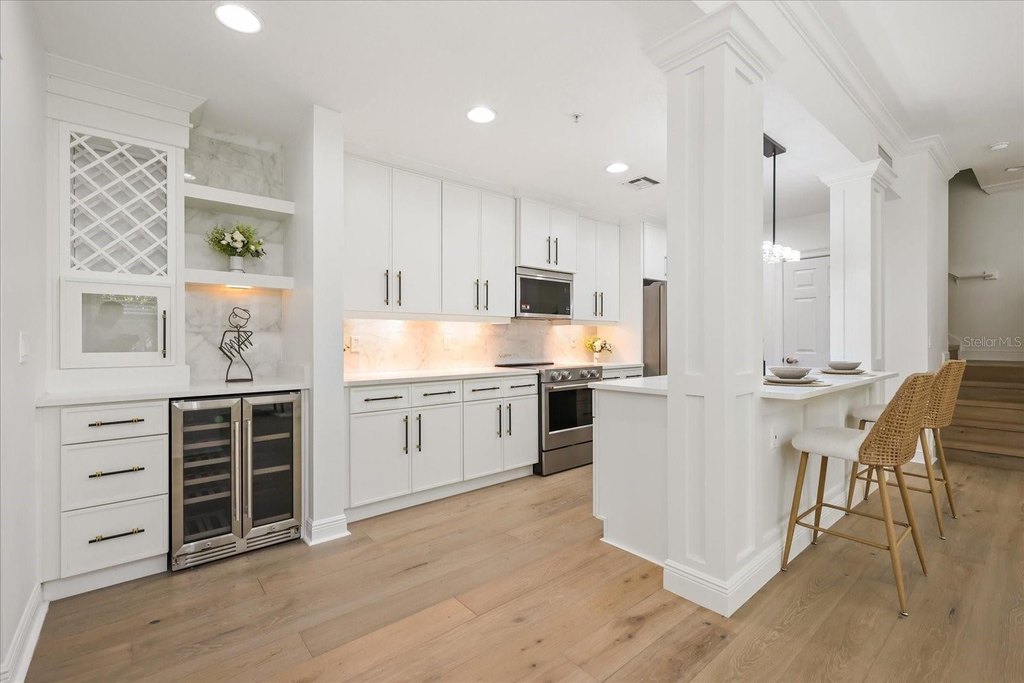
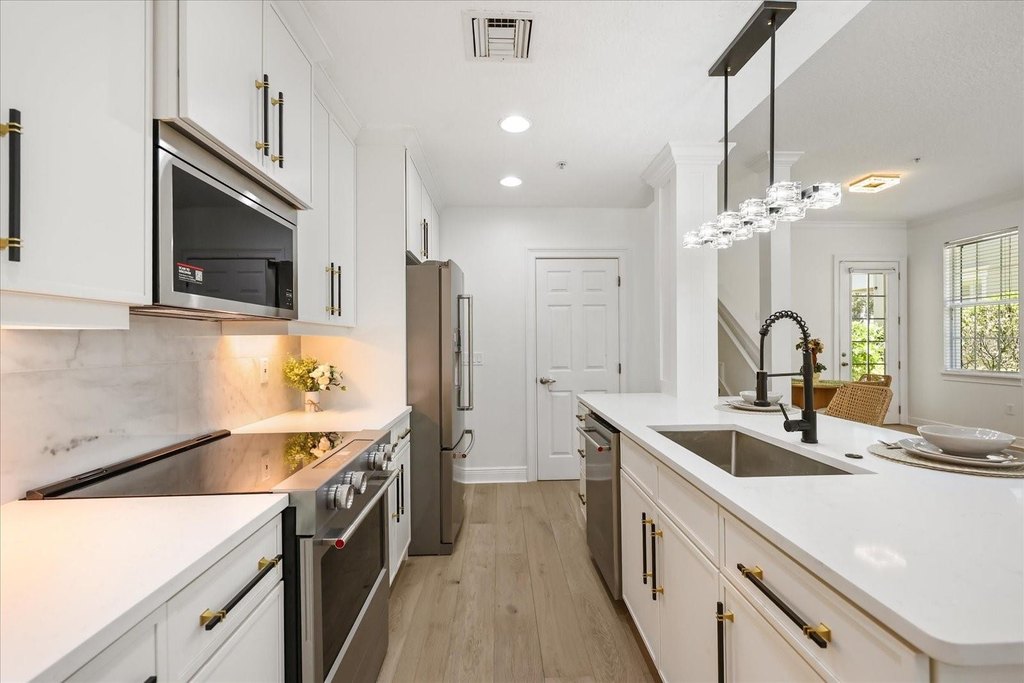
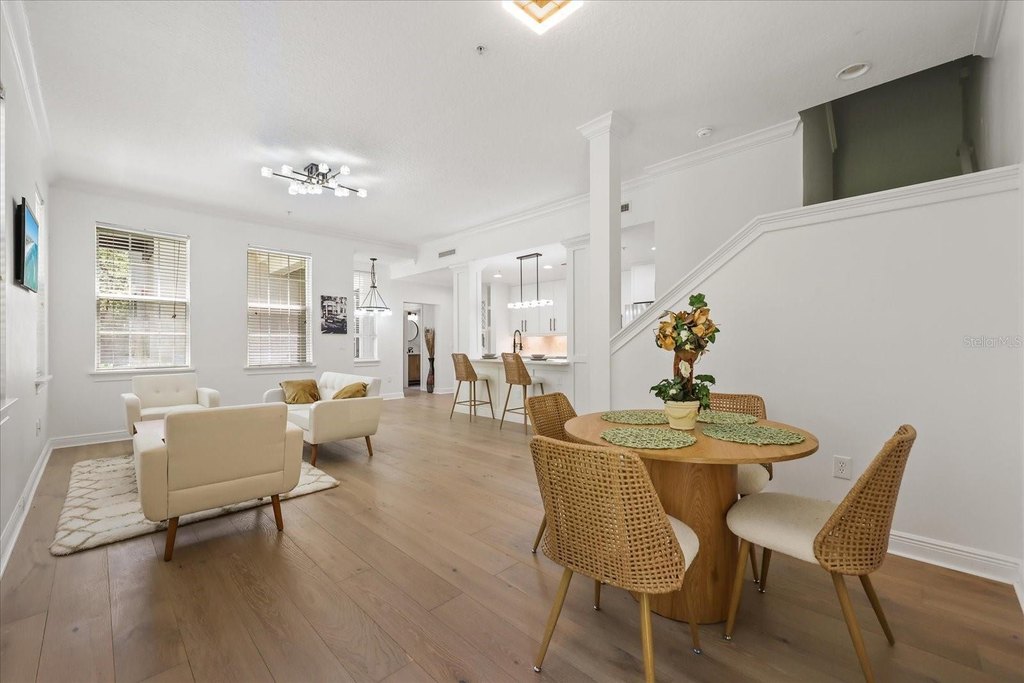
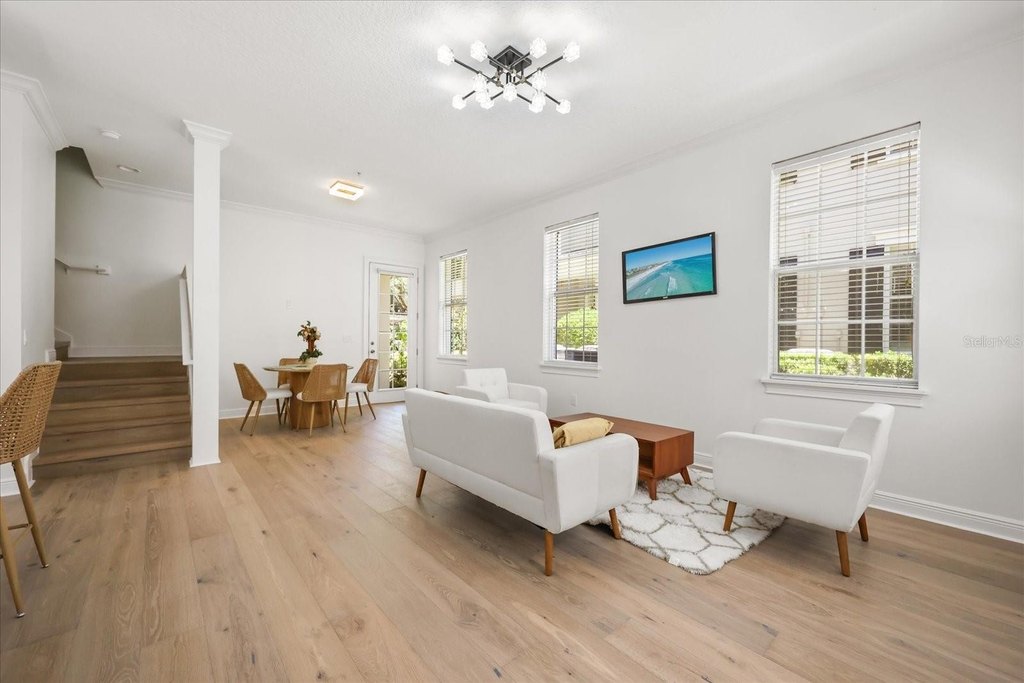
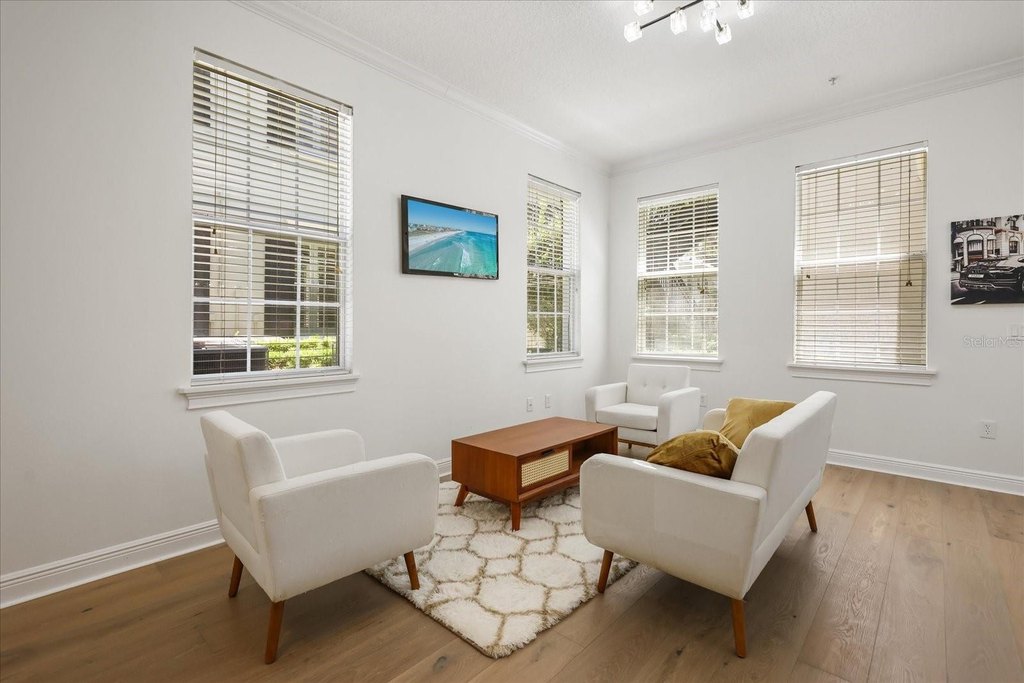
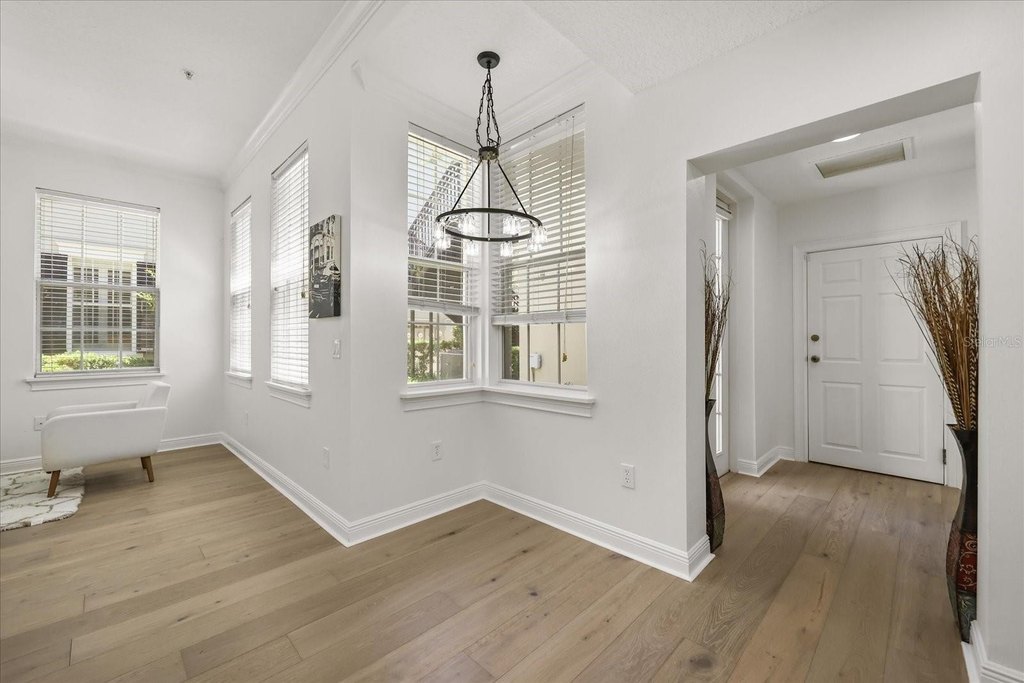
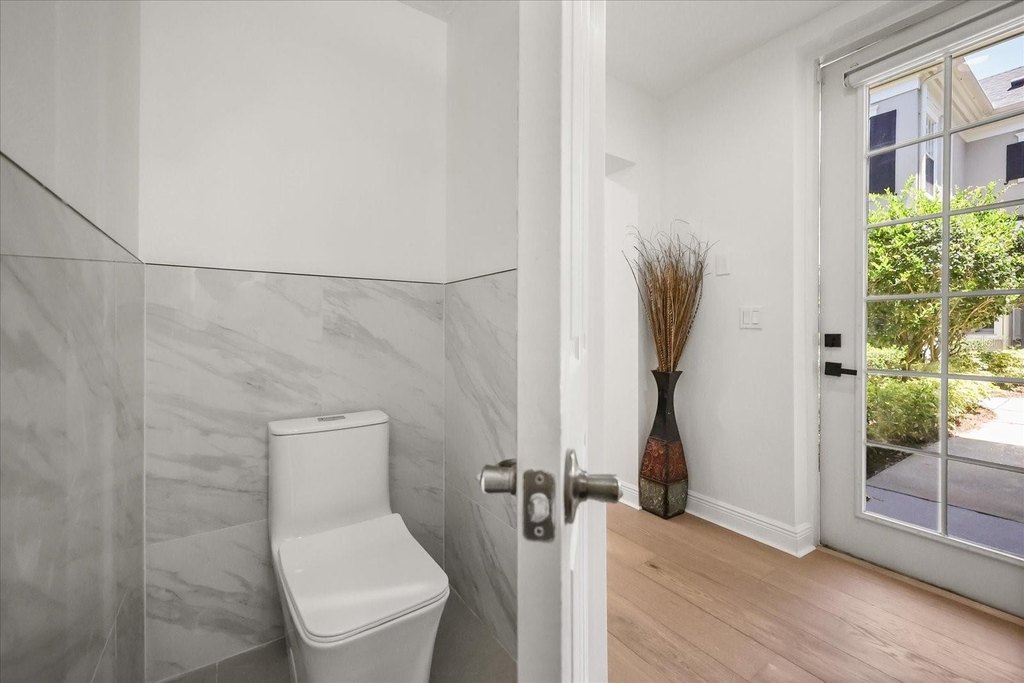
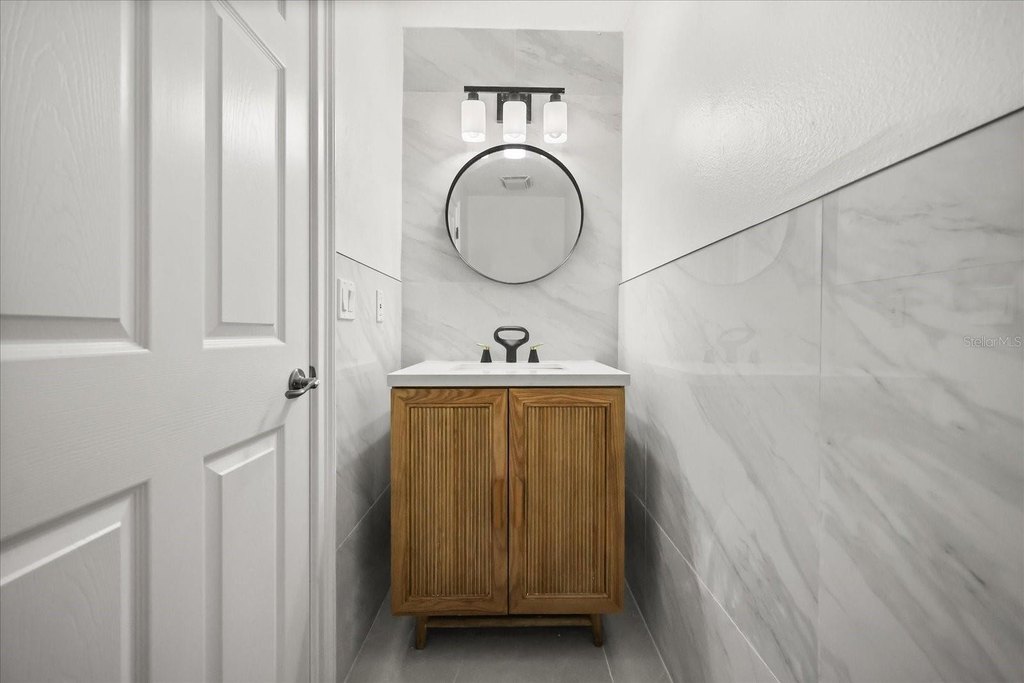
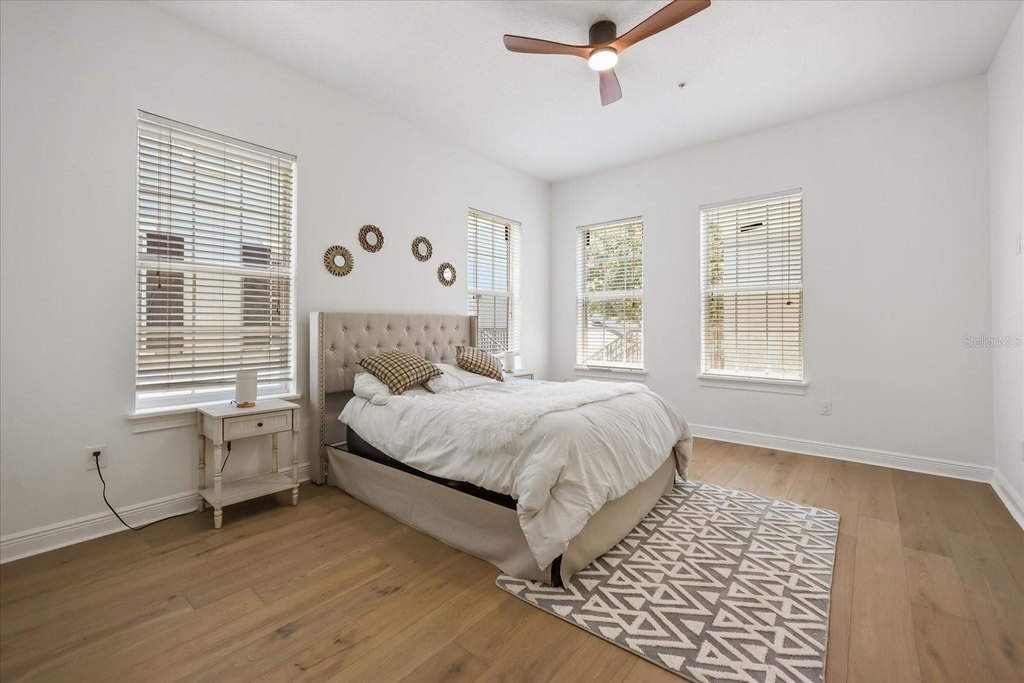
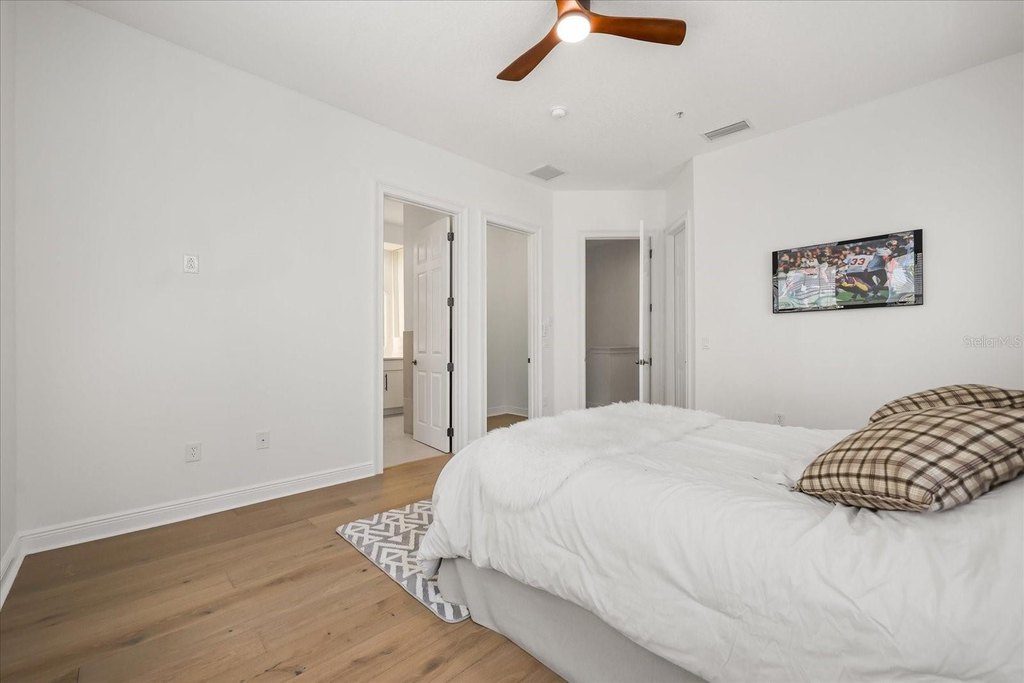
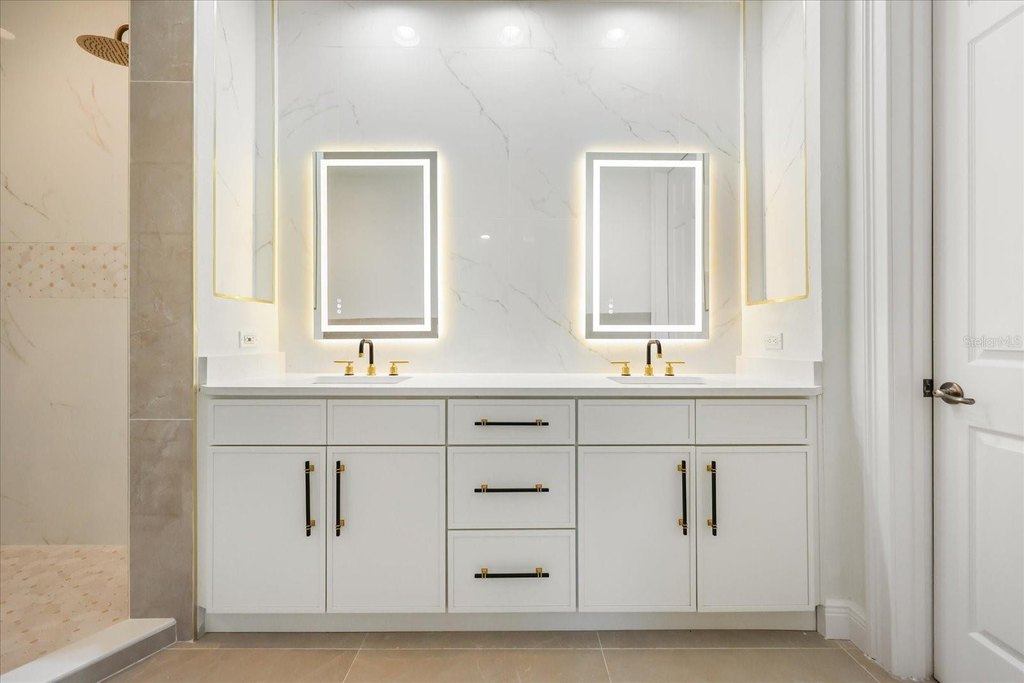
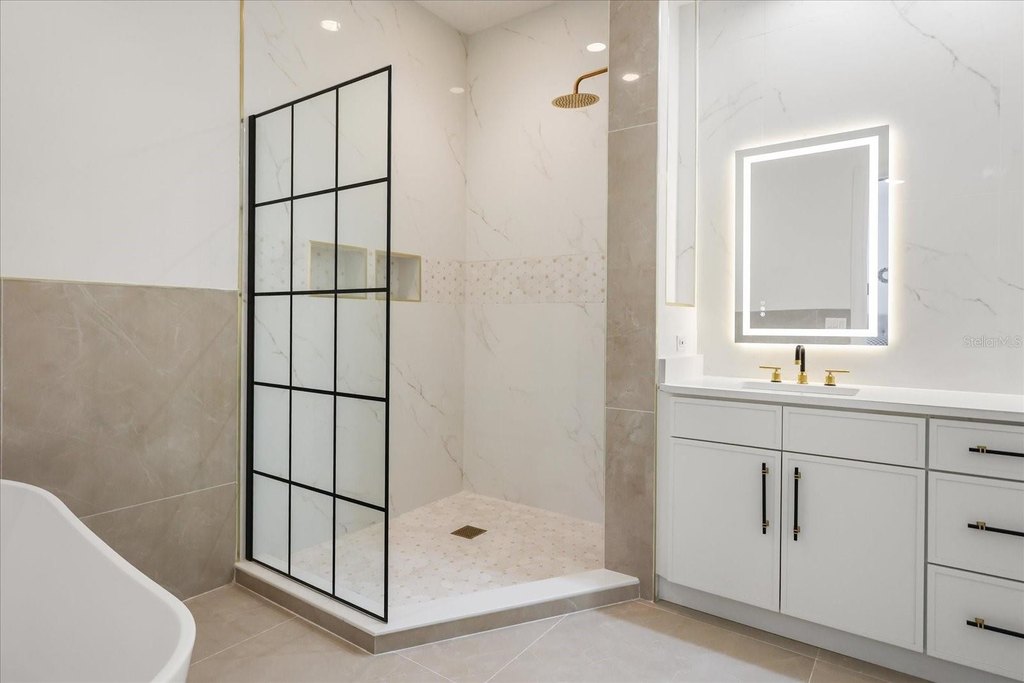
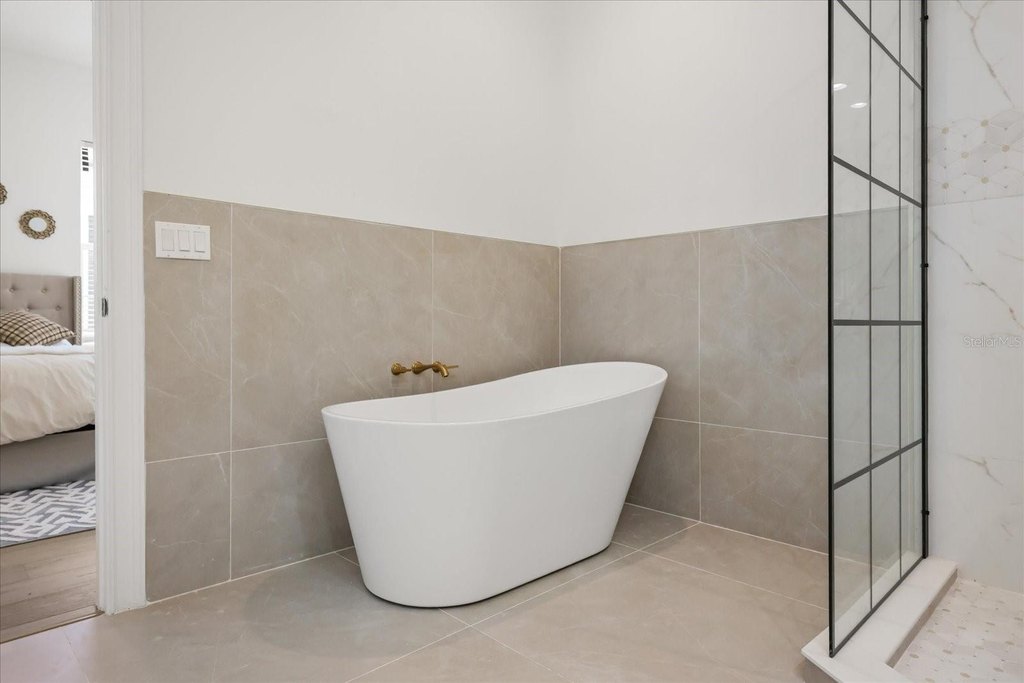
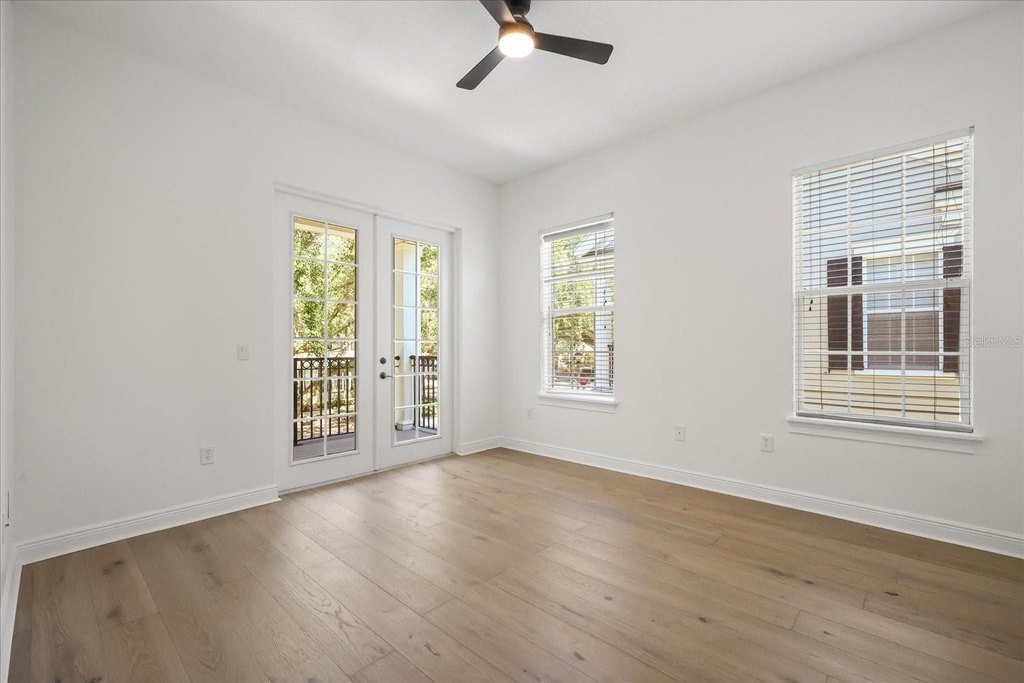
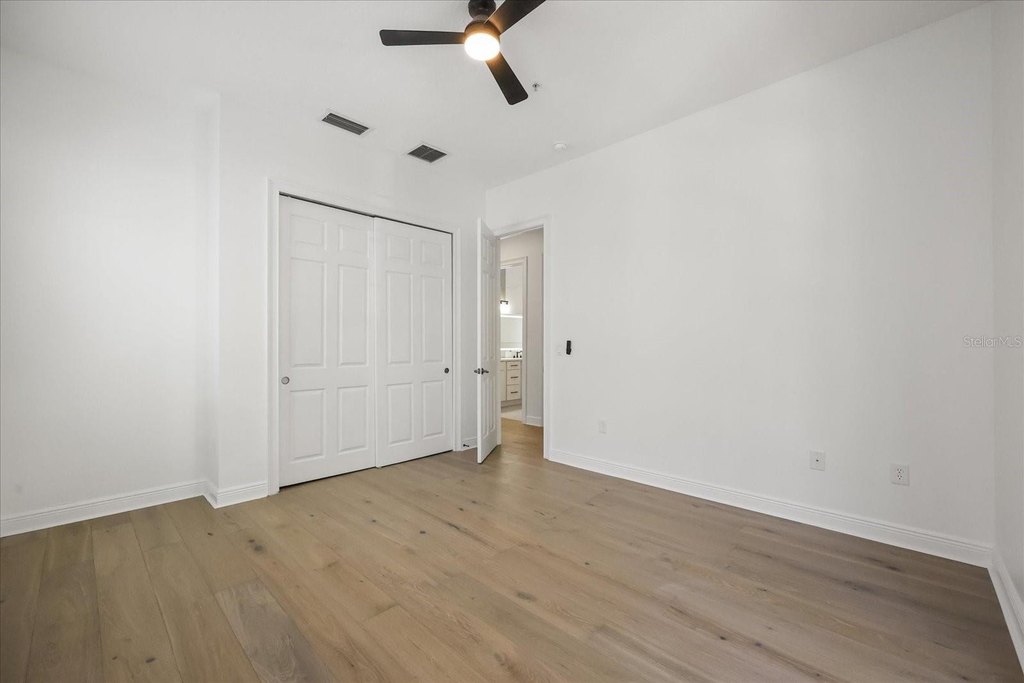
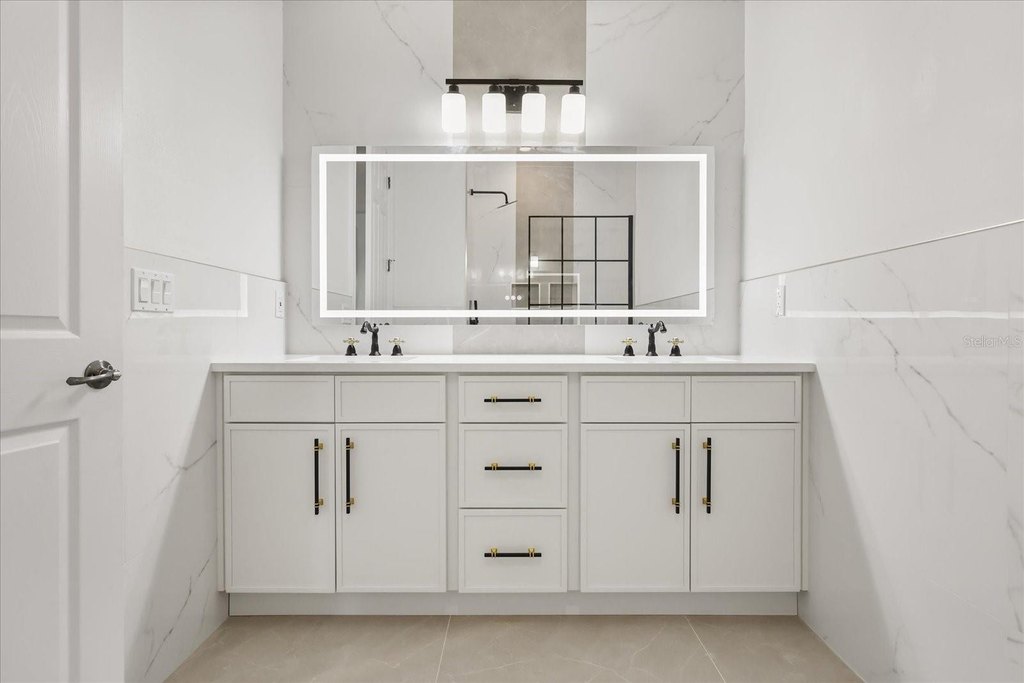
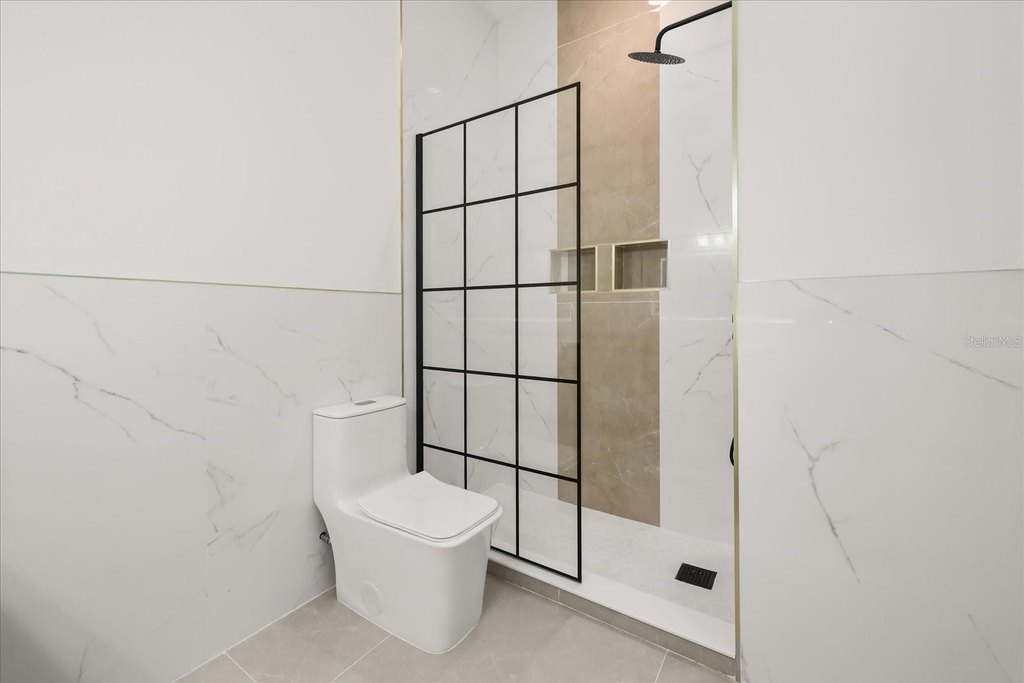
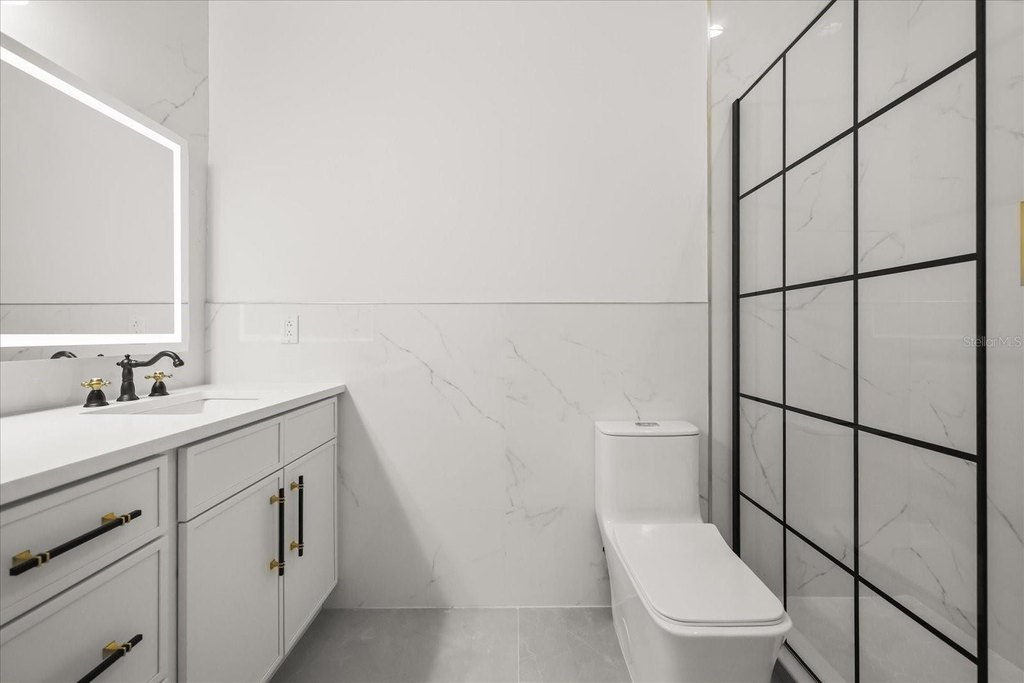
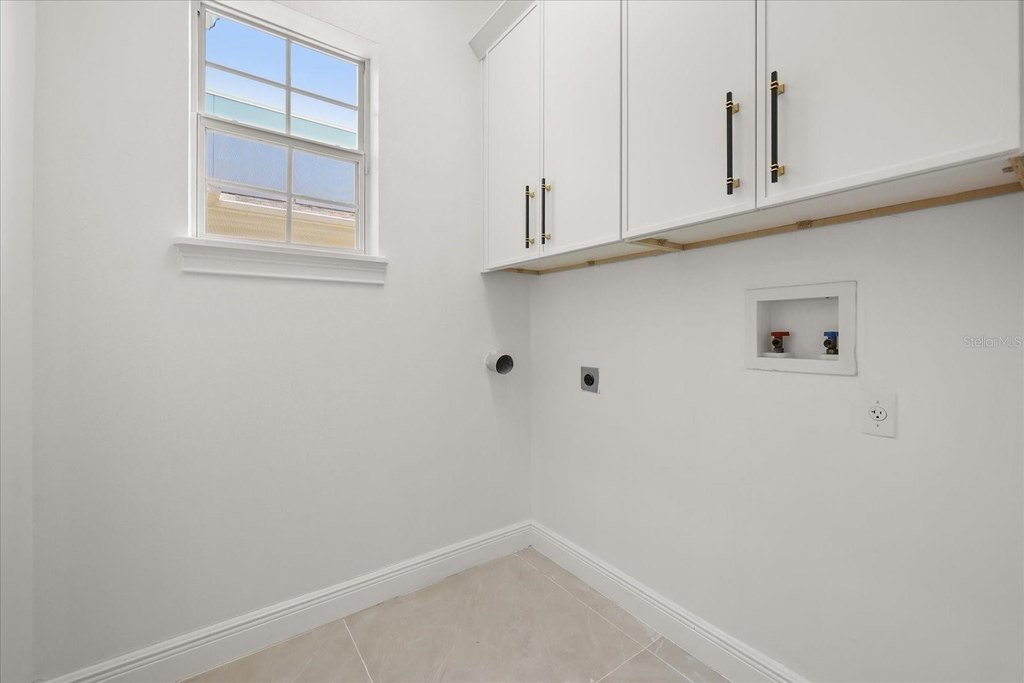
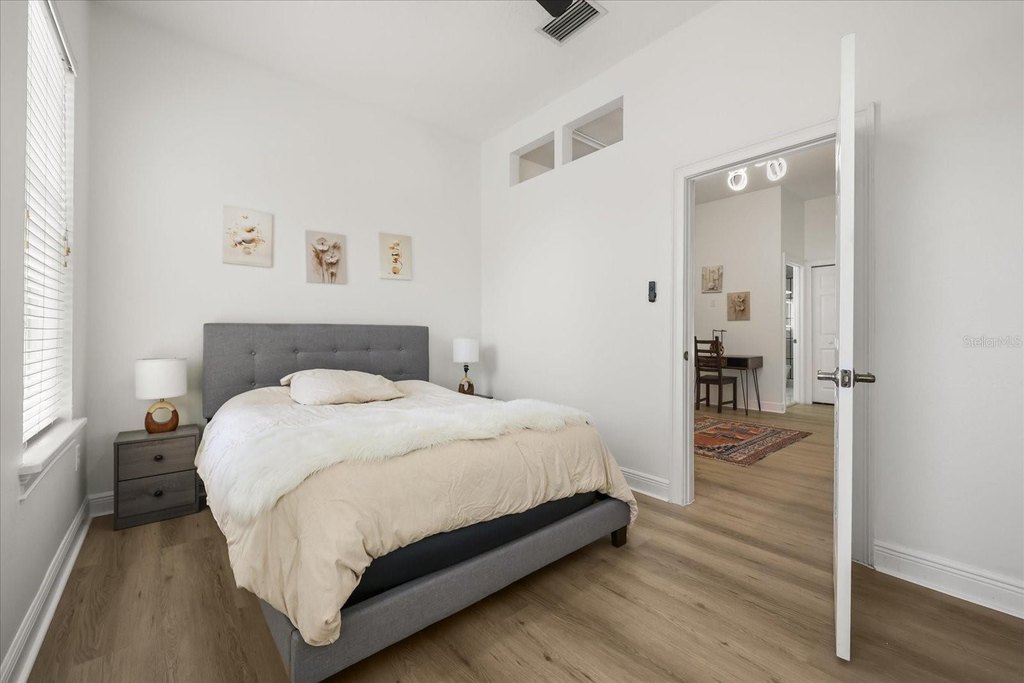
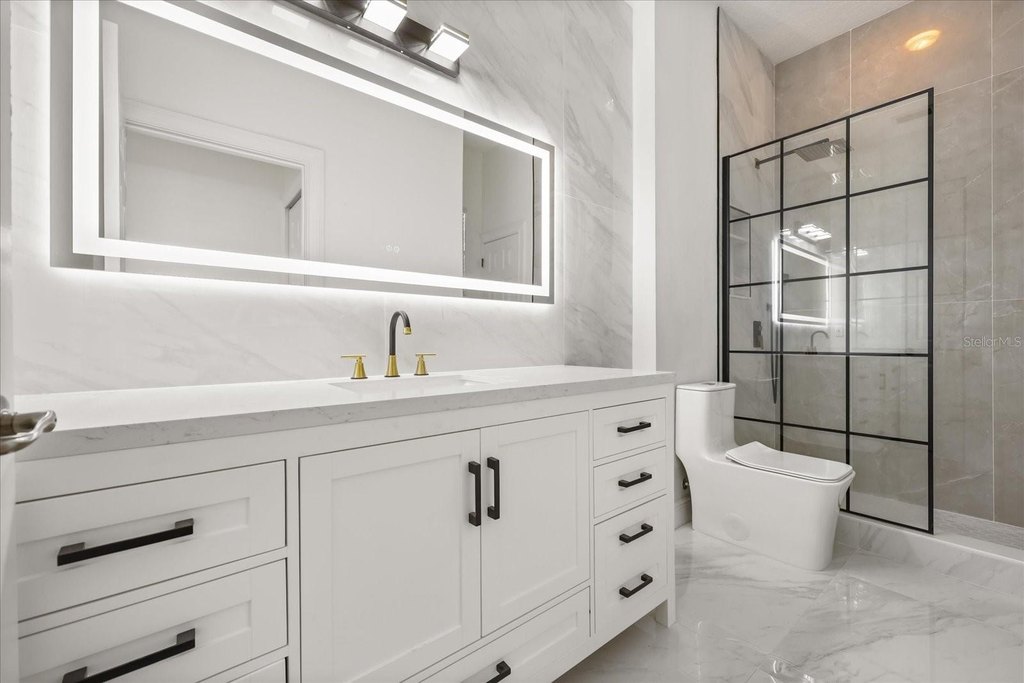
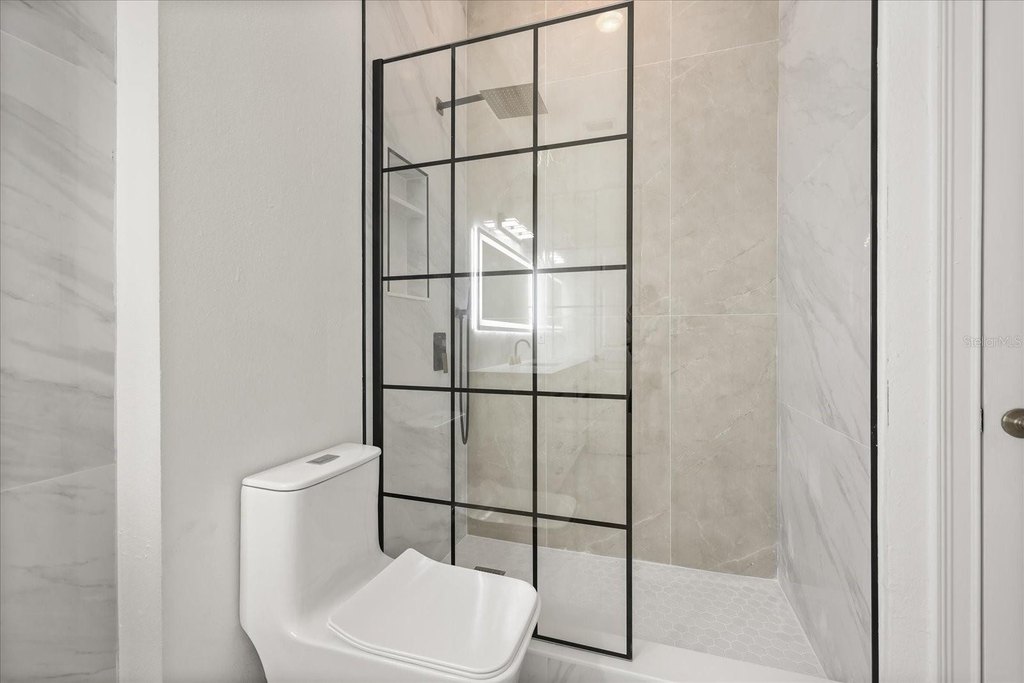
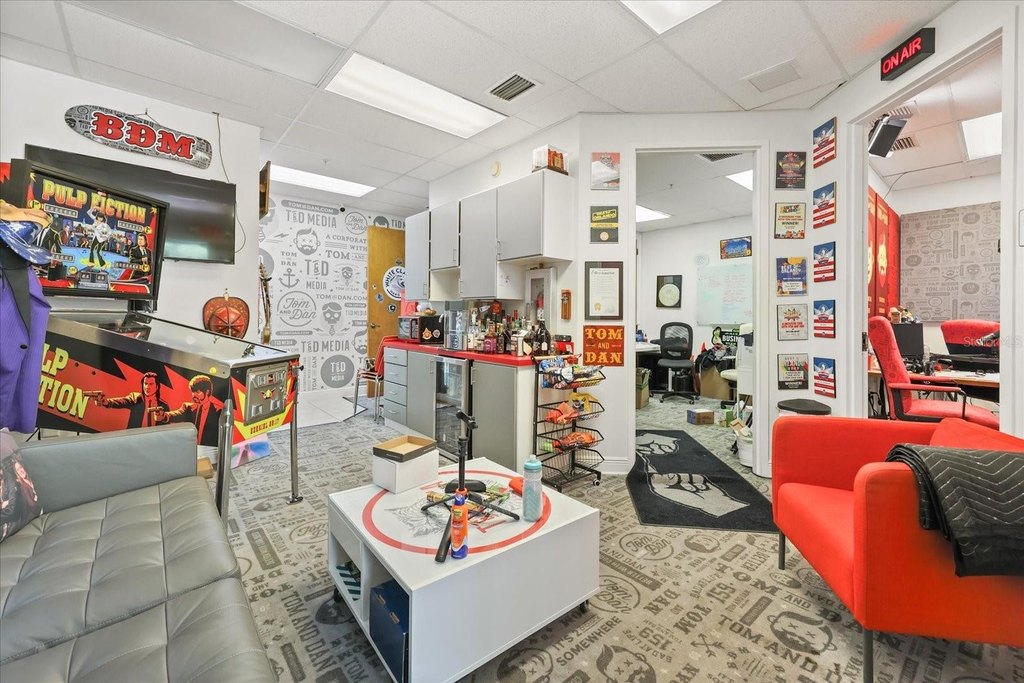
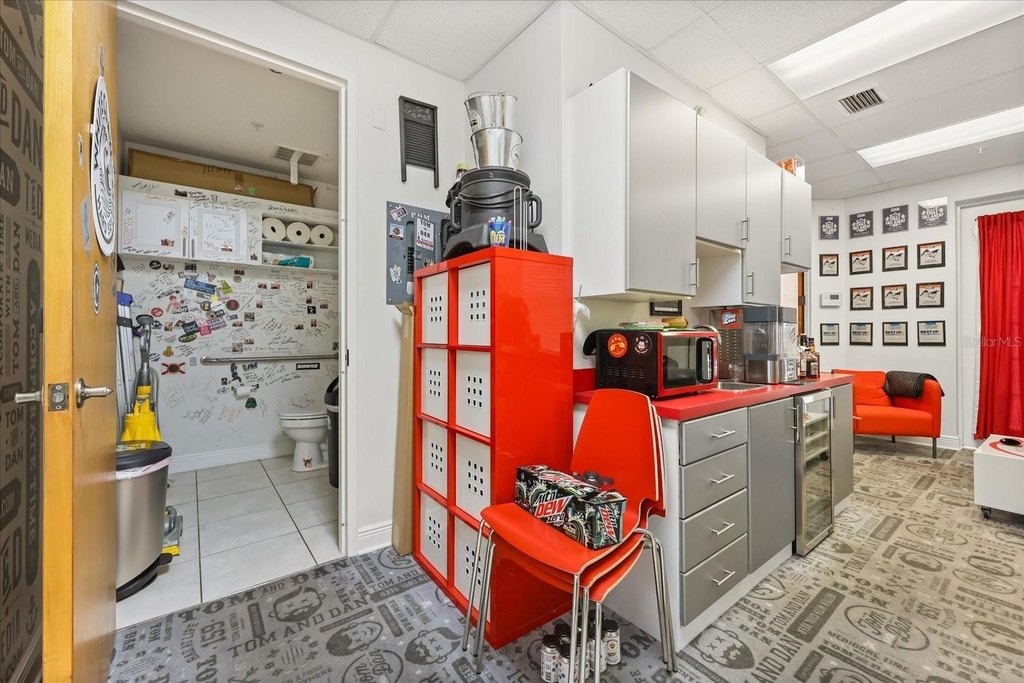
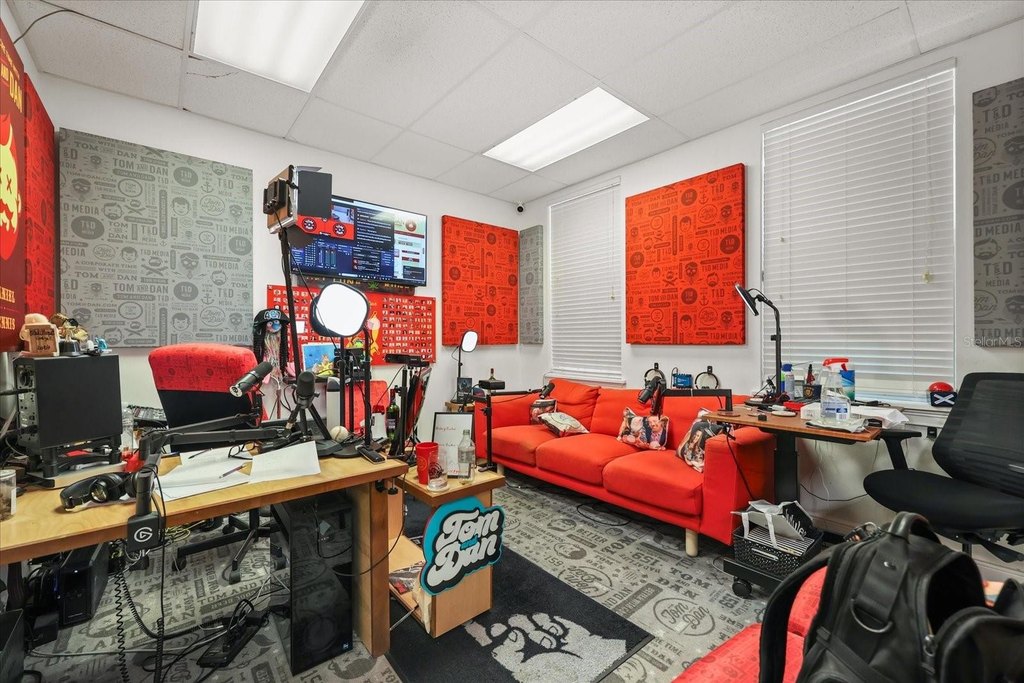
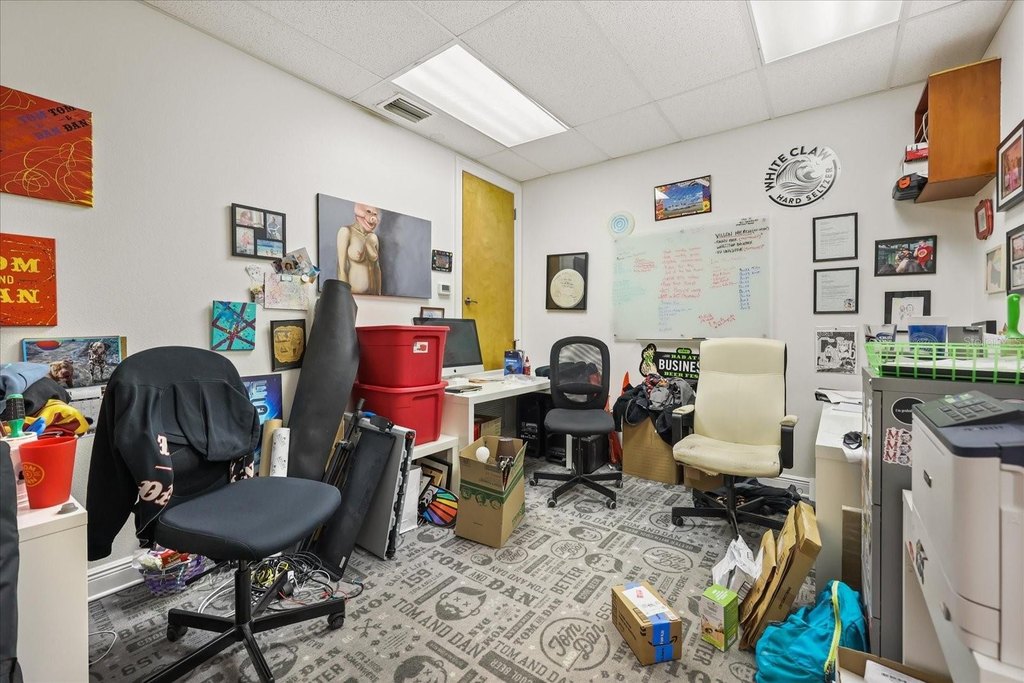
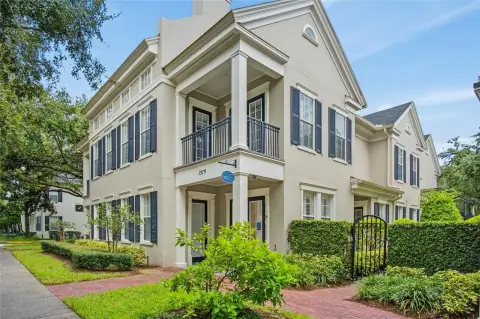
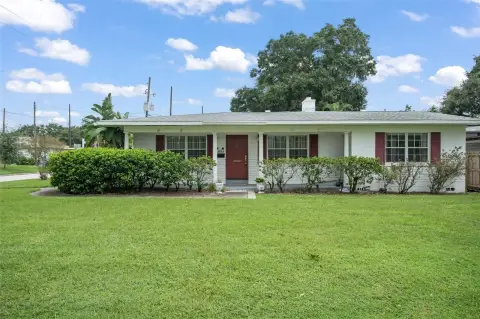
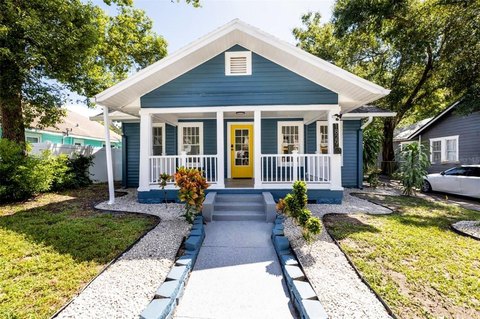
This 3,129-square-foot mixed-use property contains three distinct components: a townhome, a garage apartment, and a front commercial suite. The renovated improvements include a new roof, new HVAC units, engineered hardwood flooring, quartz countertops, custom cabinetry, premium appliances, and updated baths. The townhome offers an open kitchen and living arrangement, walk-in pantry, private balcony, laundry room, and a primary suite with dual closets and spa-style bath. The apartment has a separate entrance, open living and kitchen area, walk-in closet, and updated full bath. The commercial space includes a private entrance, two rooms, and a full bath.
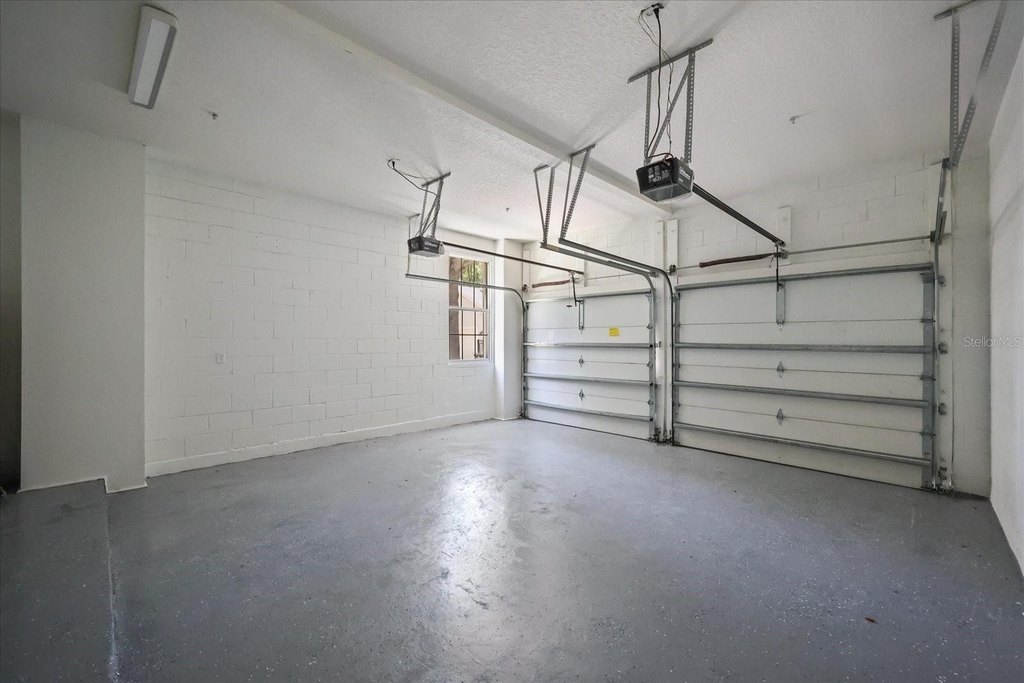
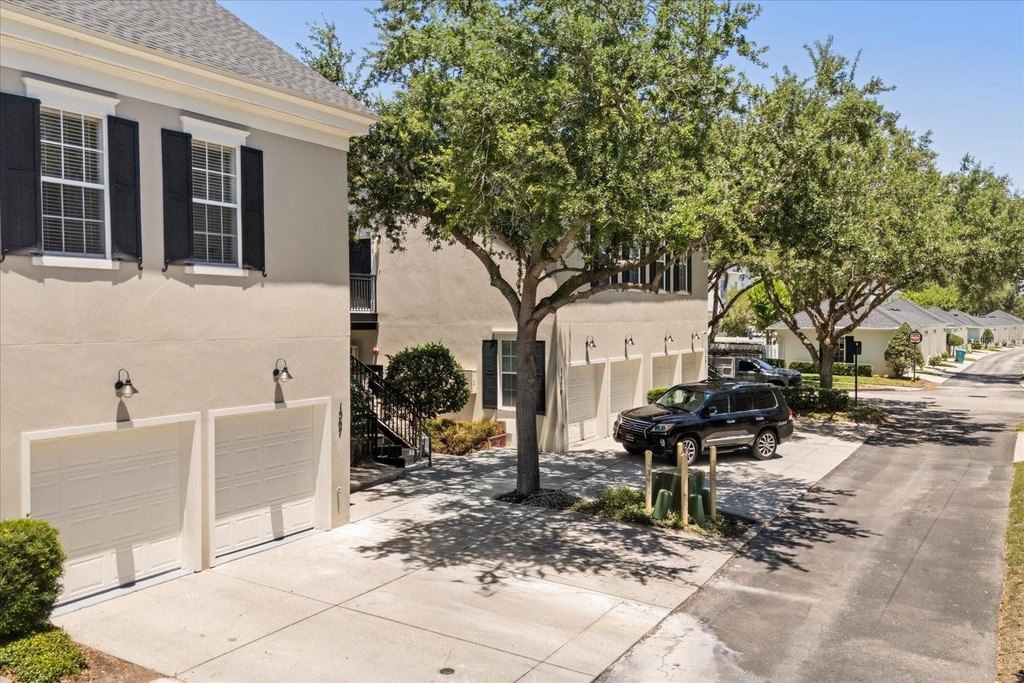
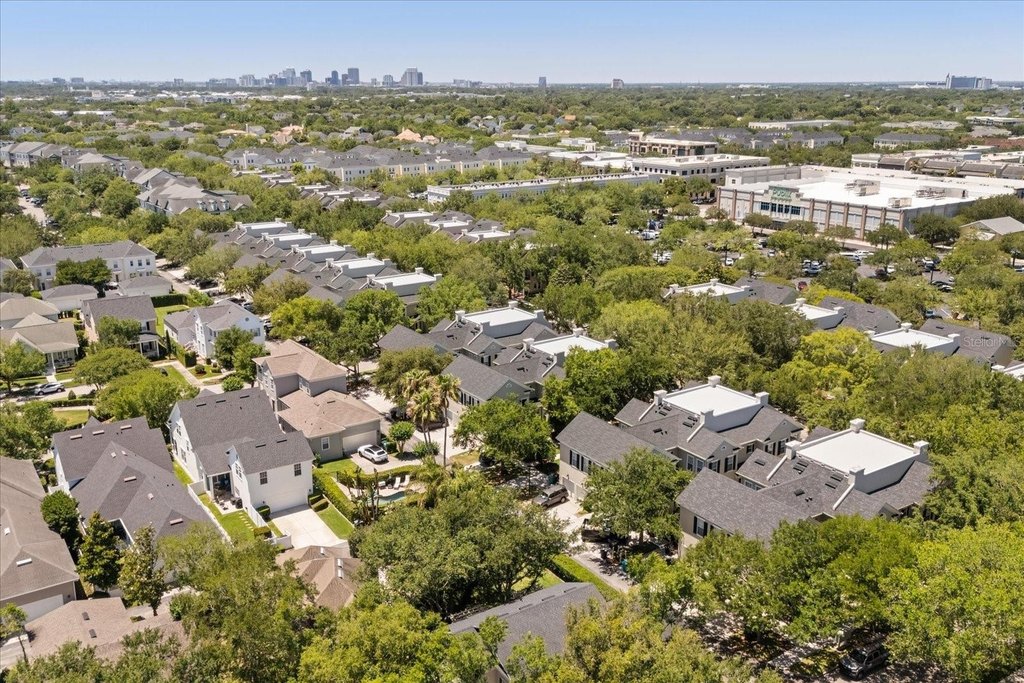
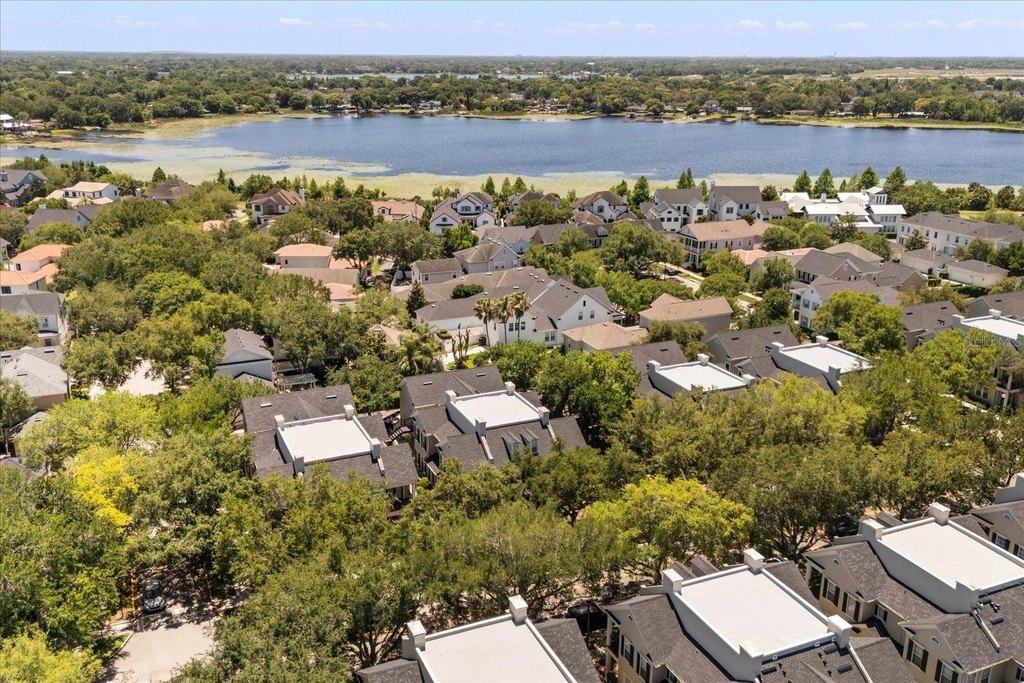
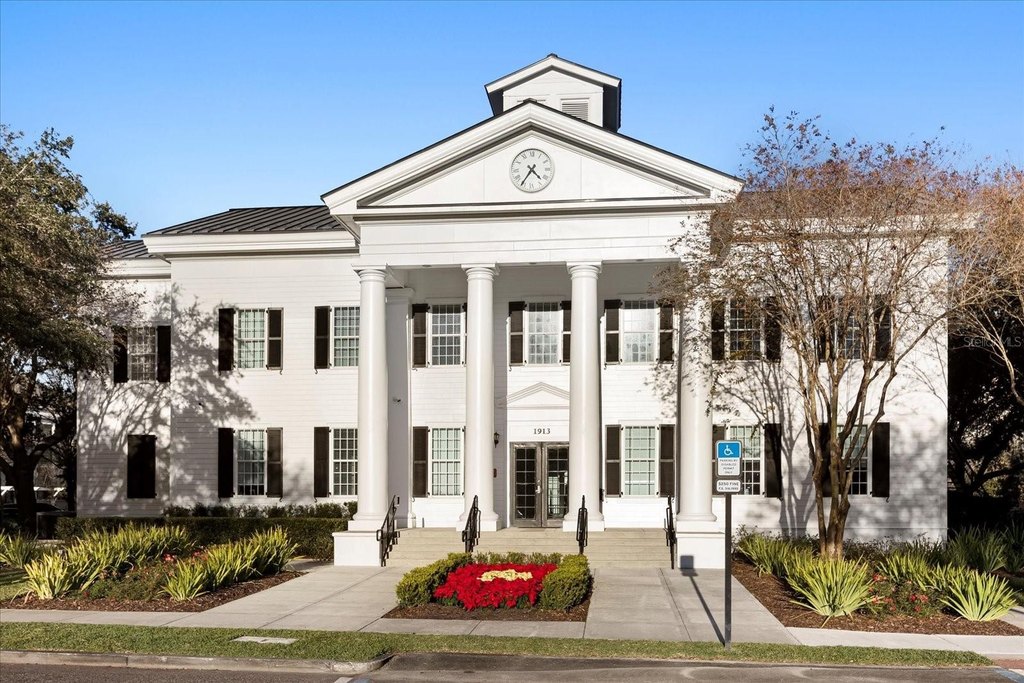
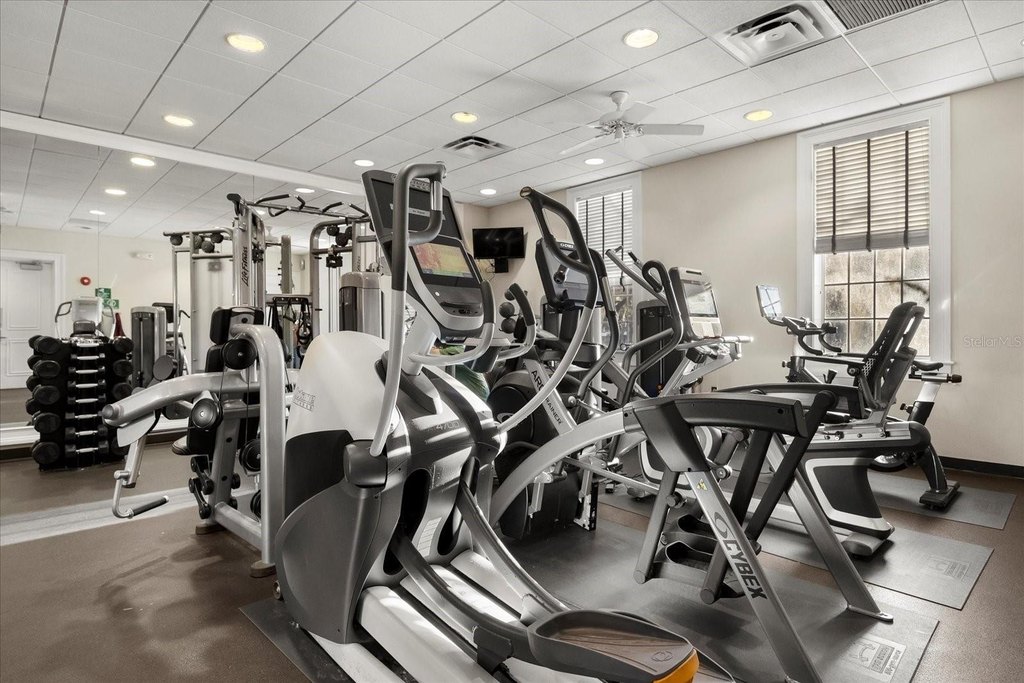
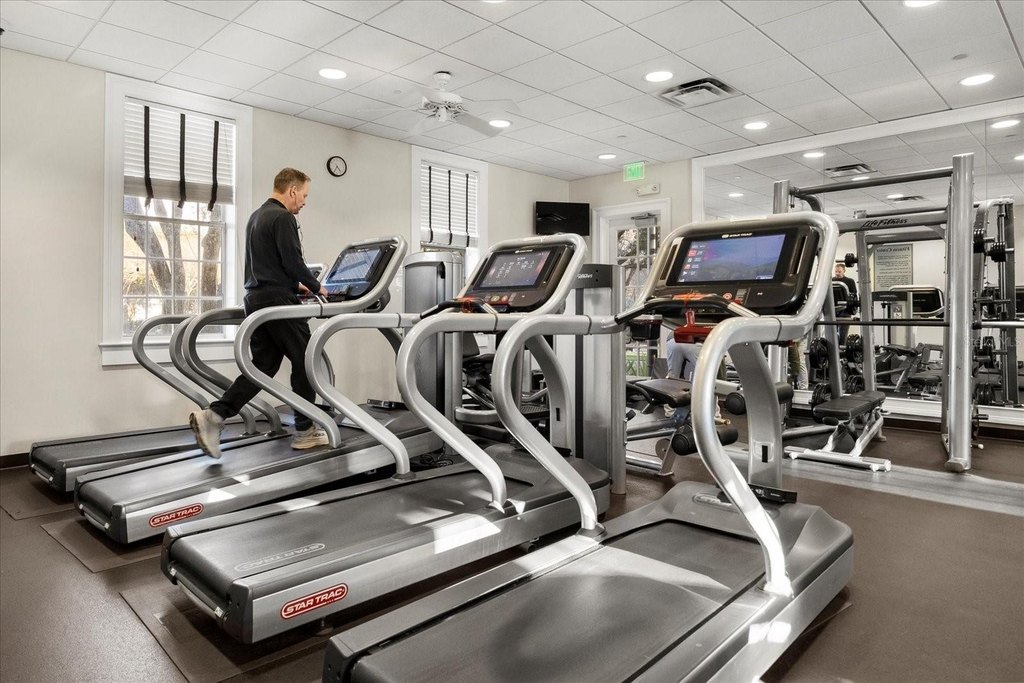
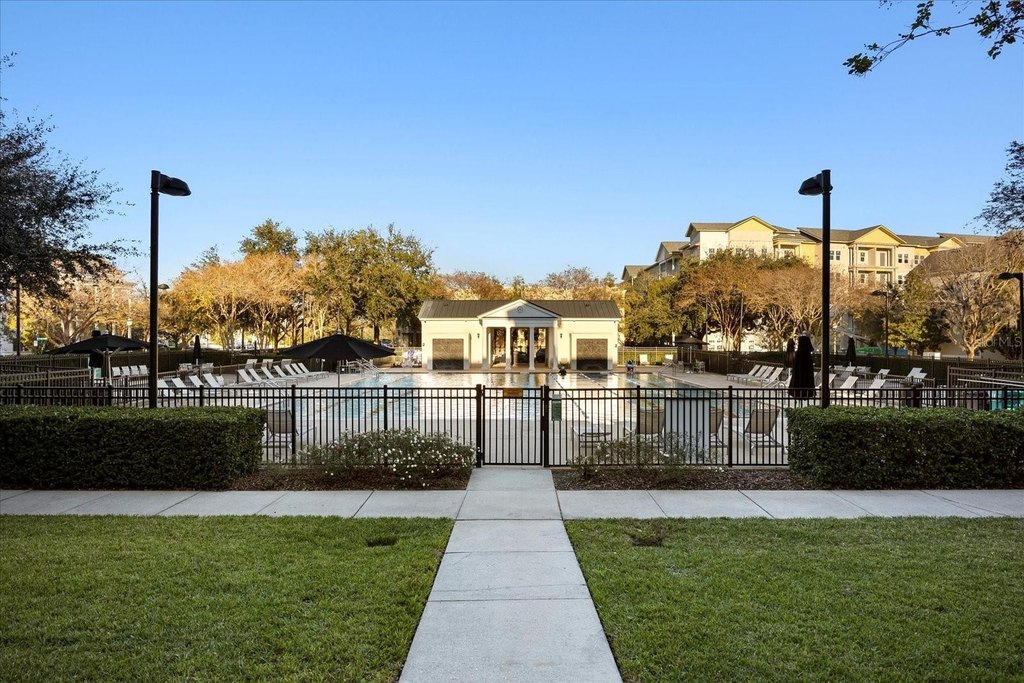
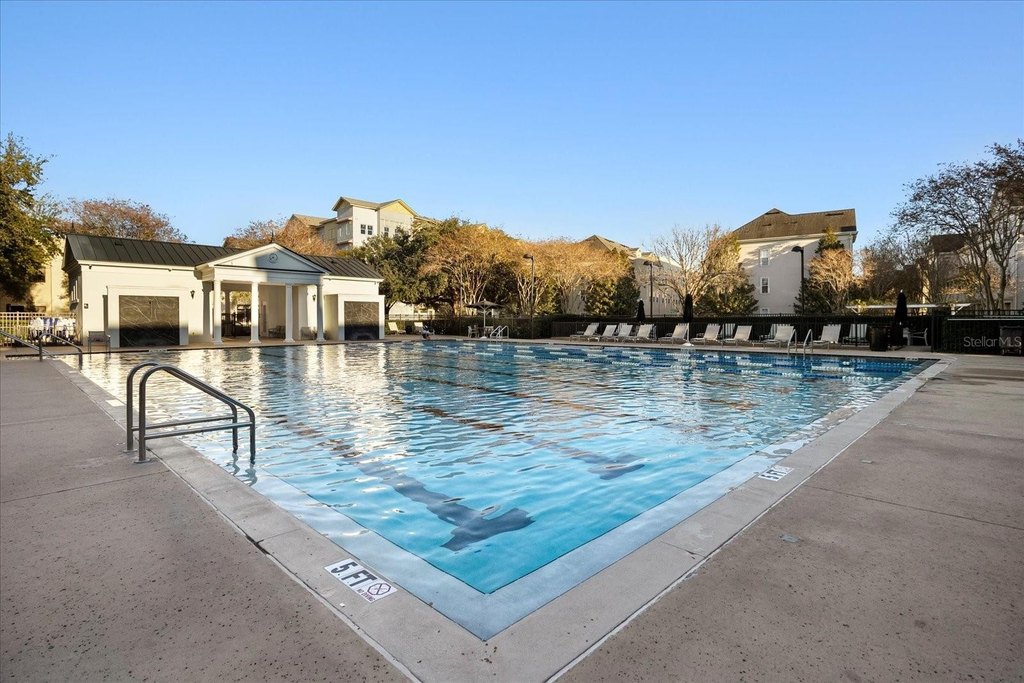
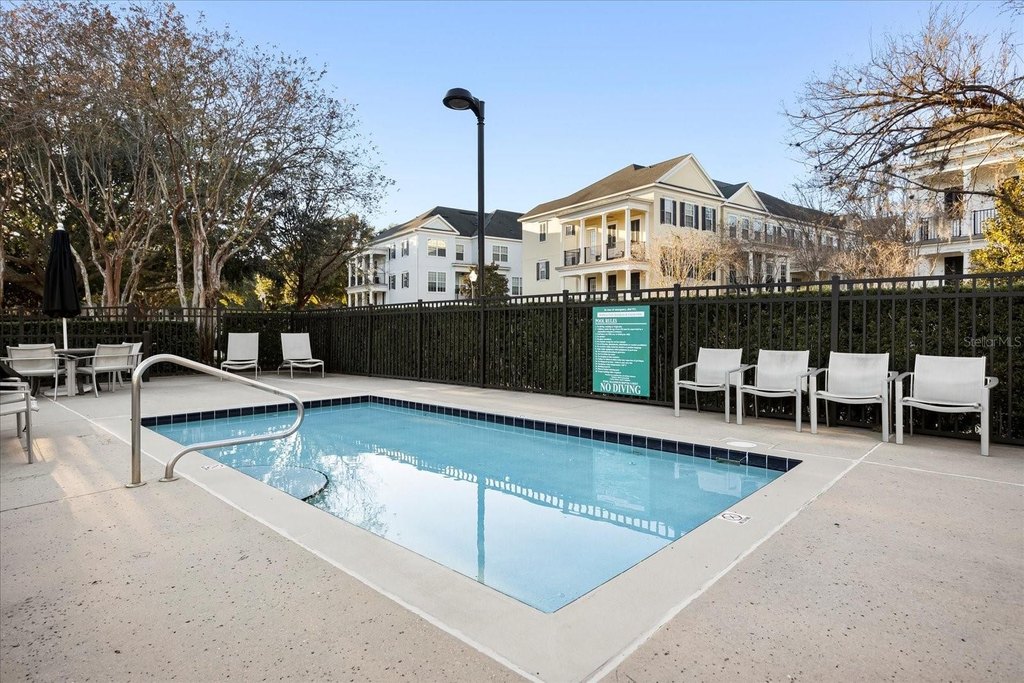
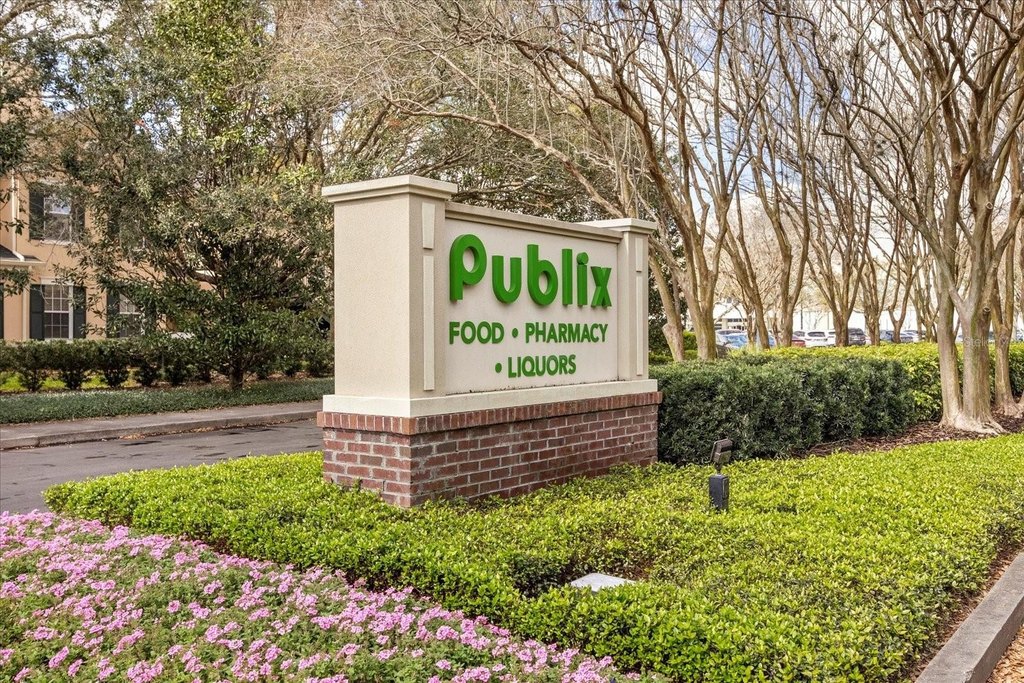
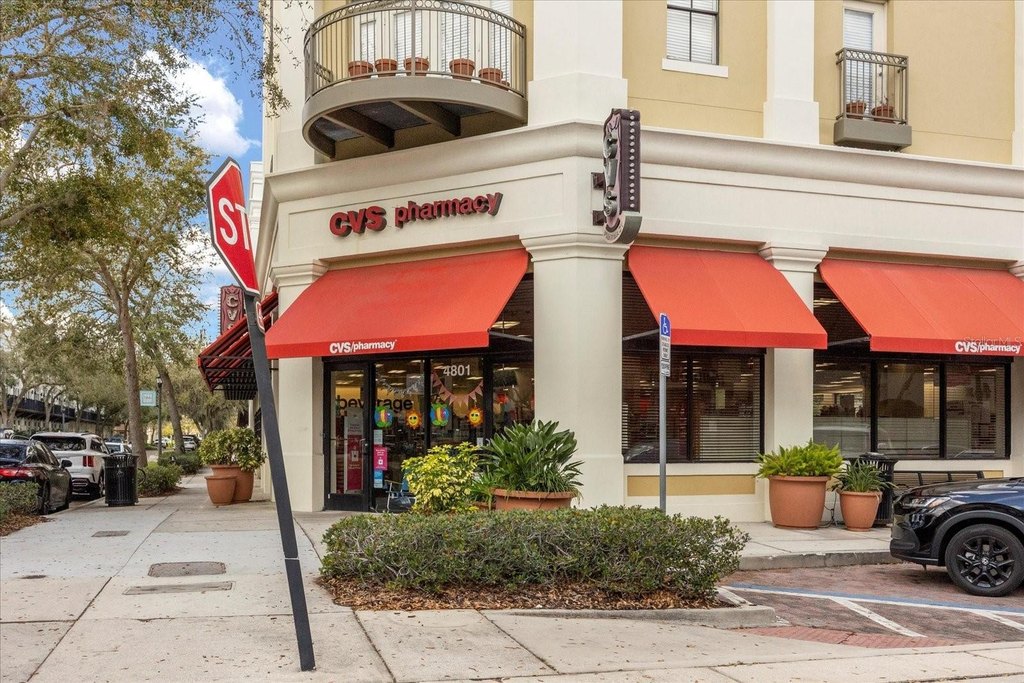
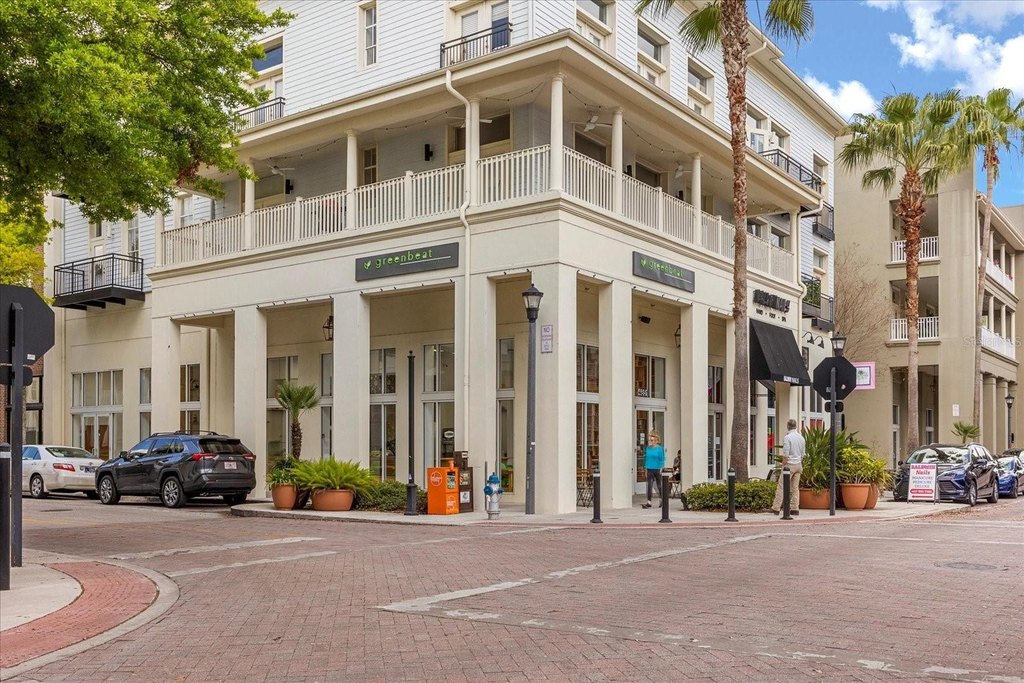
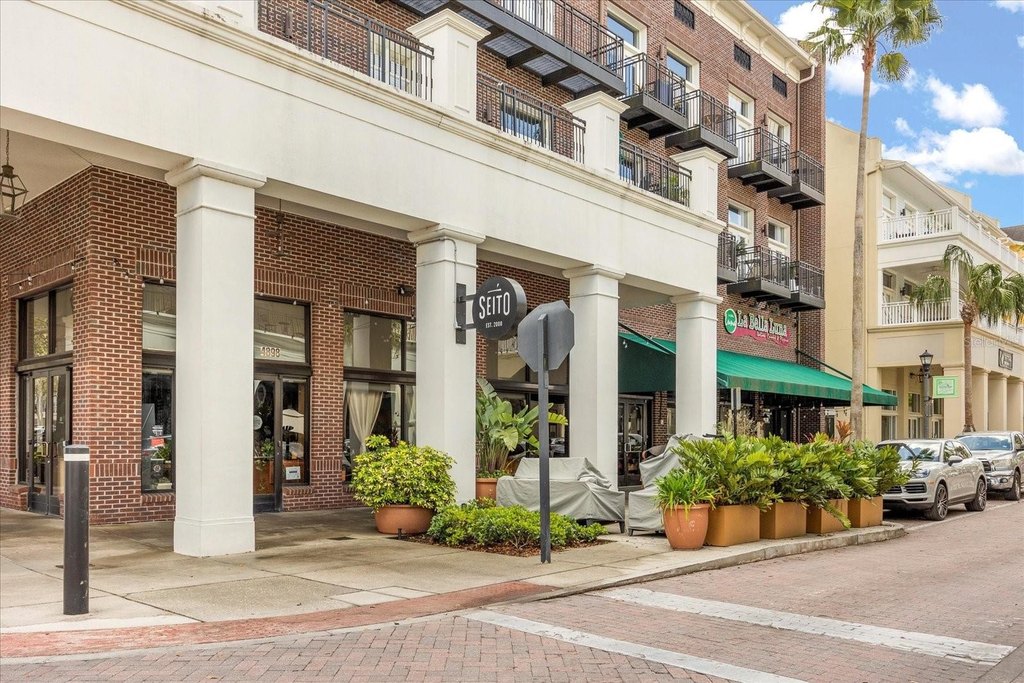
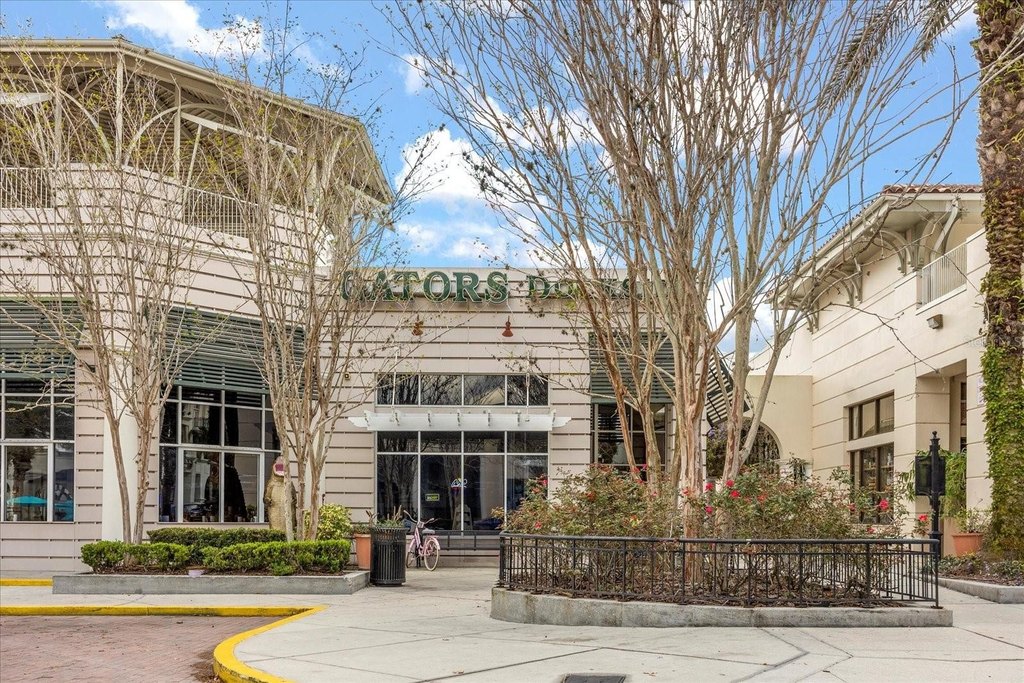
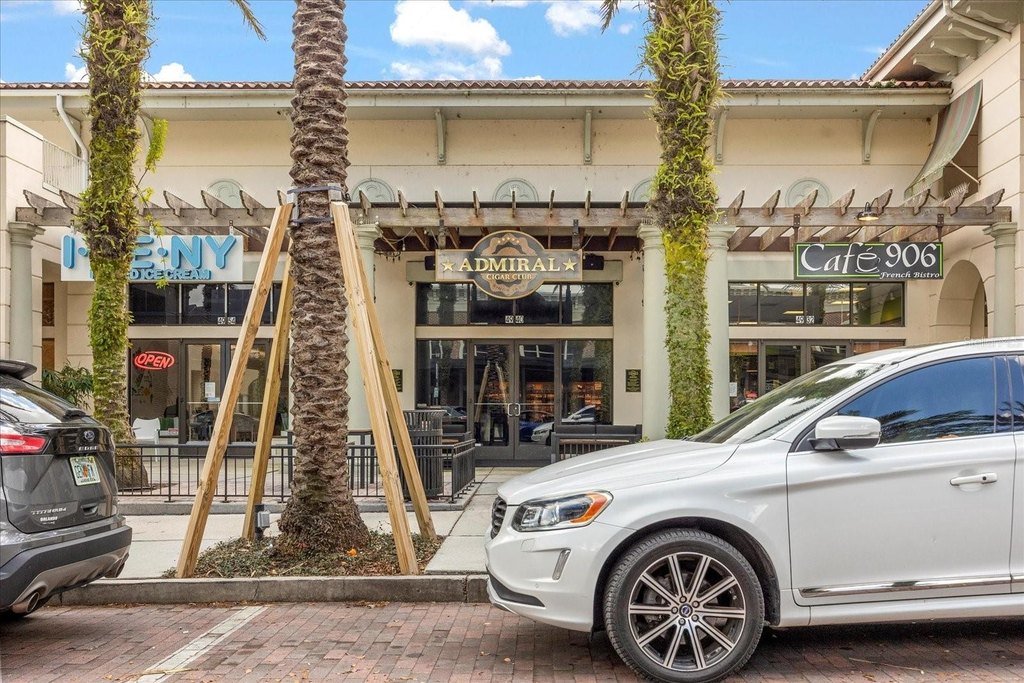
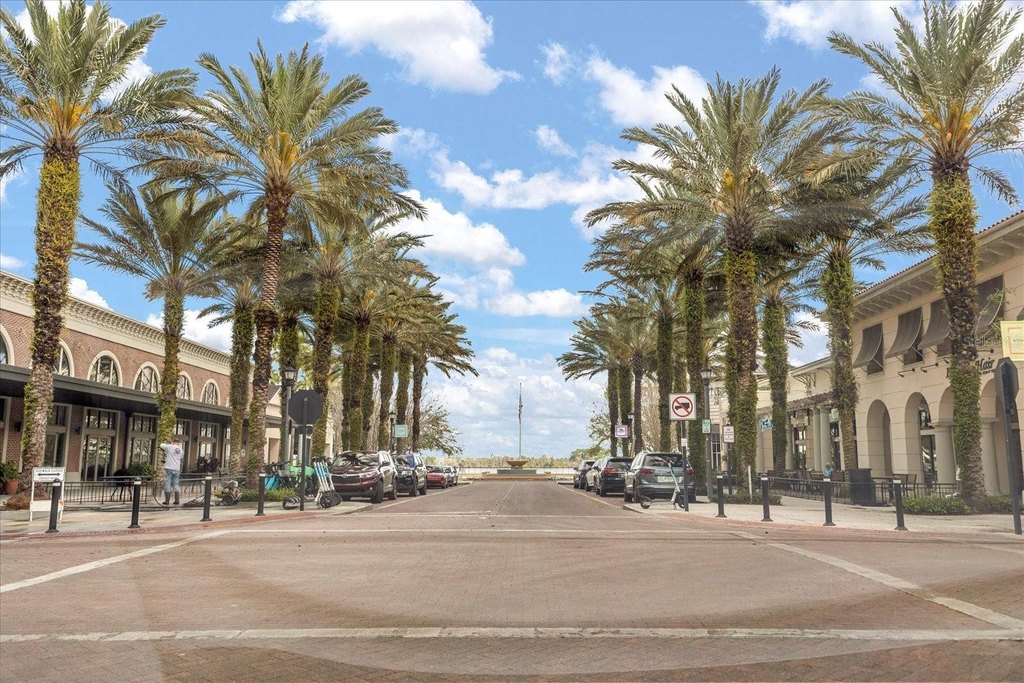
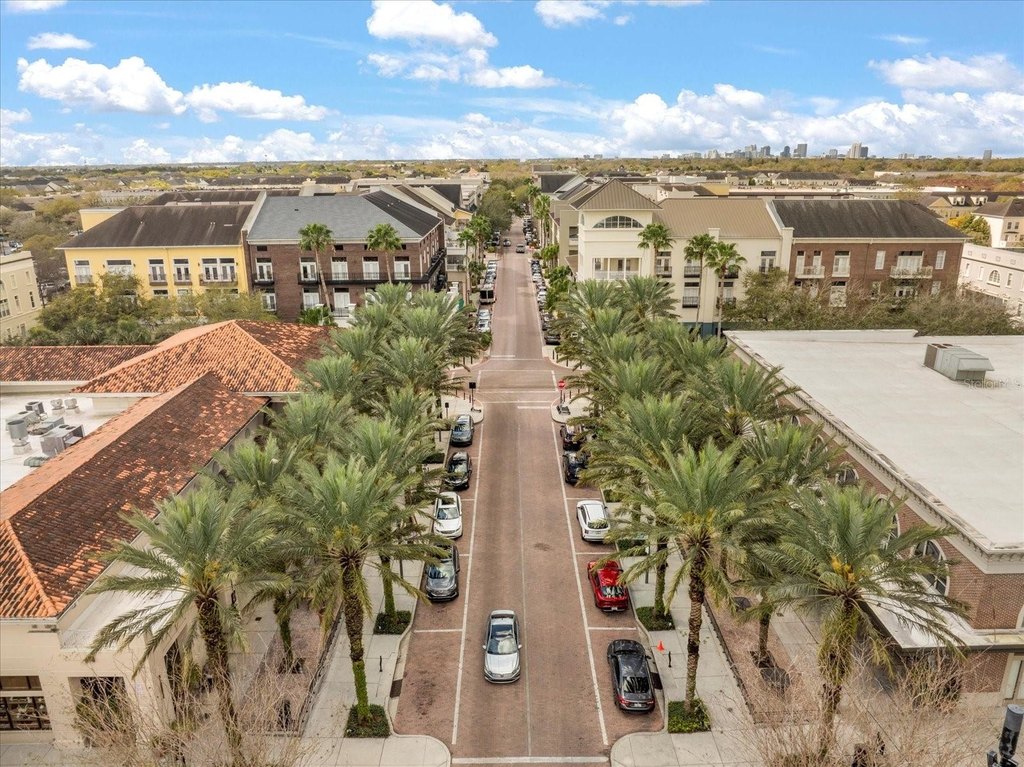
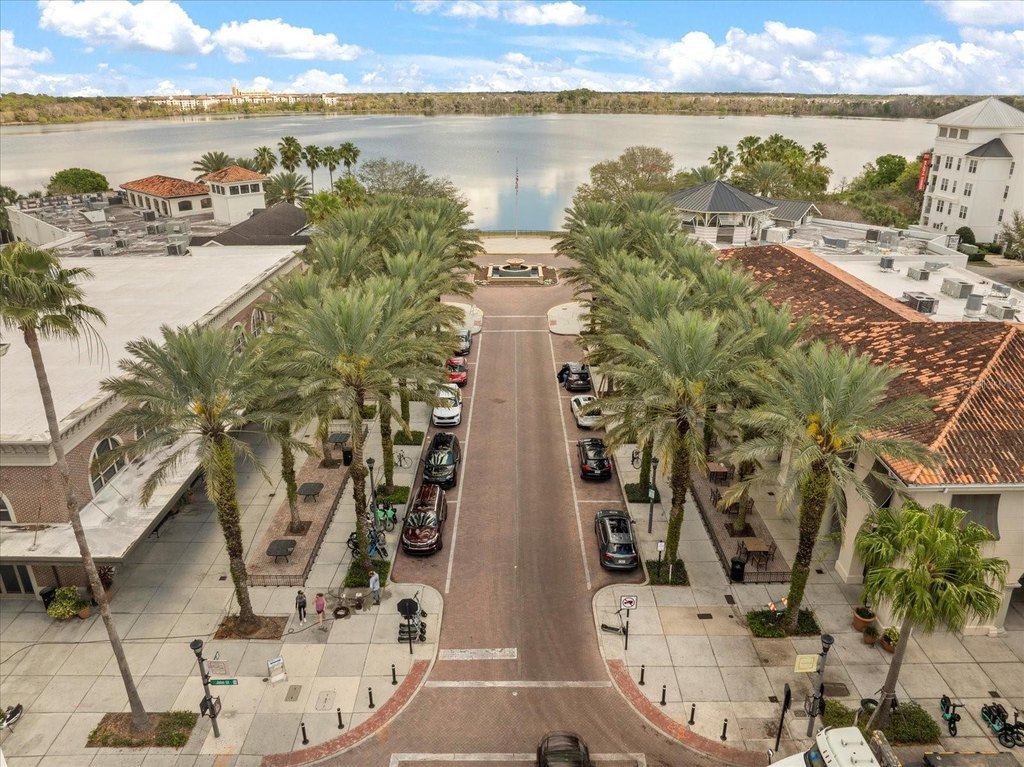
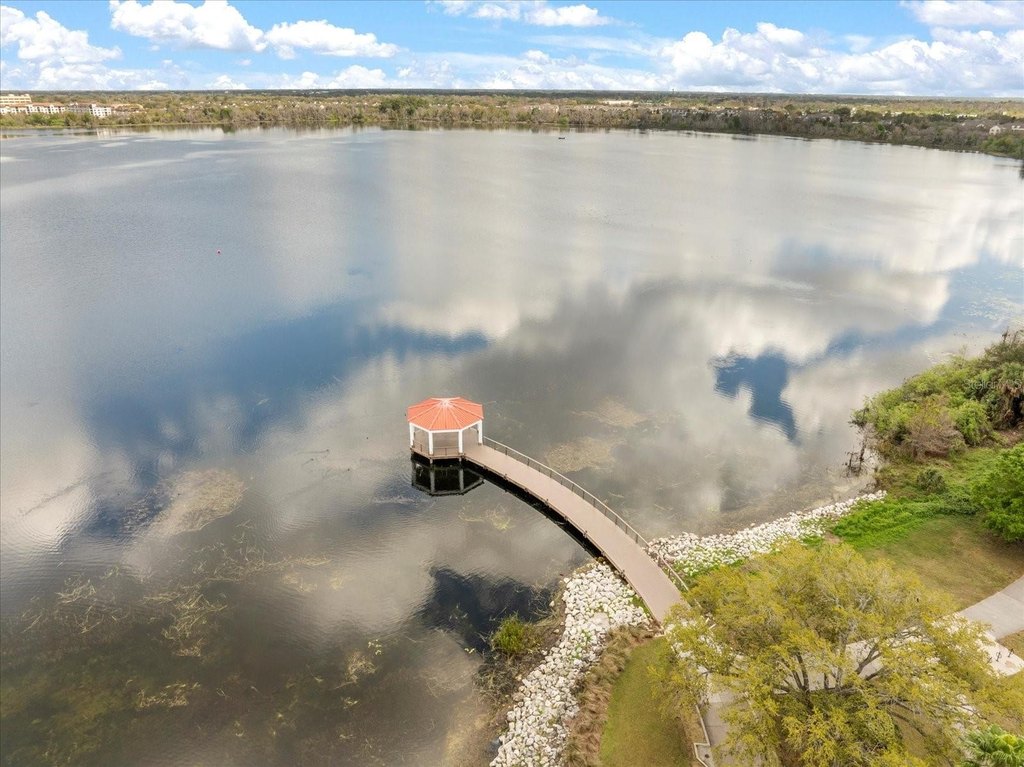
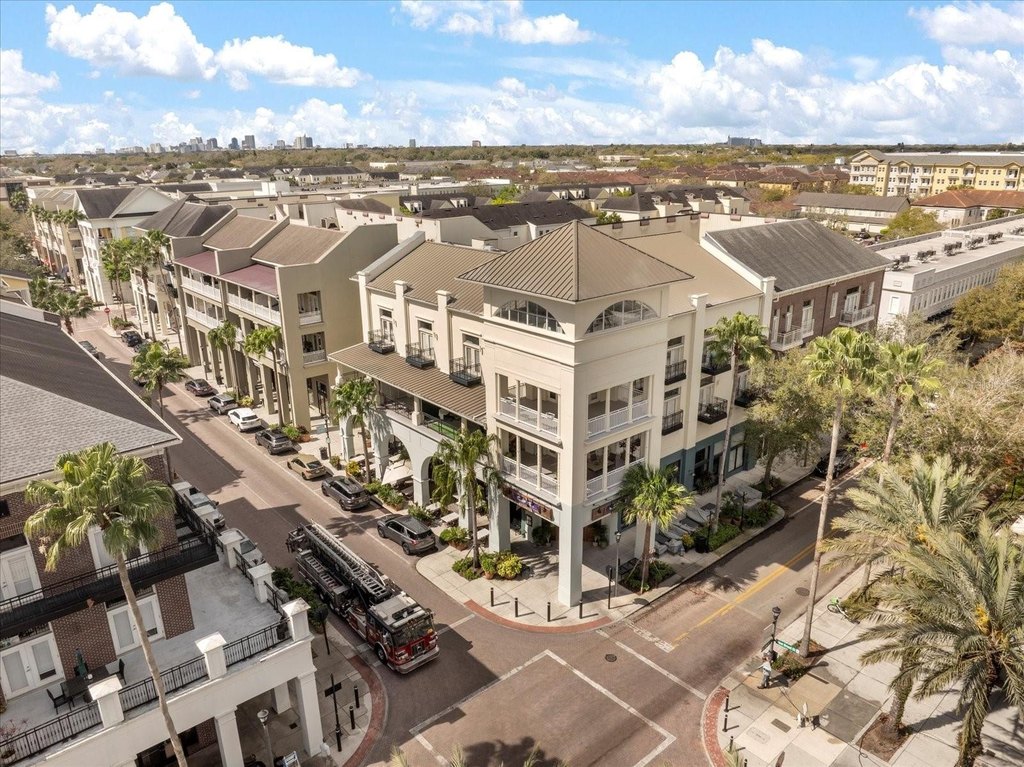
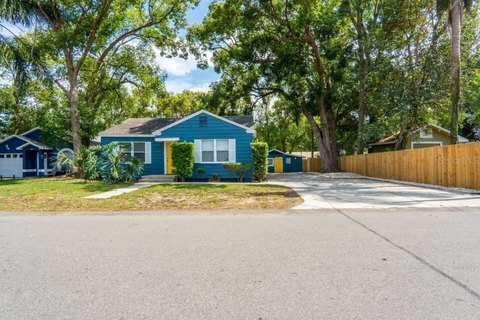
Situated at 1567 Lake Baldwin Lane in Orlando’s Baldwin Park, the property is near Lake Baldwin, Publix, boutique shopping, dining, parks, community pools, fitness centers, walking trails, and a dog park. The site also includes a rear two-car garage, additional parking, public water, and public sewer.
Situated at 1567 Lake Baldwin Lane in Orlando’s Baldwin Park, the property is near Lake Baldwin, Publix, boutique shopping, dining, parks, community pools, fitness centers, walking trails, and a dog park. The site also includes a rear two-car garage, additional parking, public water, and public sewer.
Key Highlights
- 3,129 SF mixed‑use property with three distinct units
- 0.09‑acre site in Baldwin Park at 1567 Lake Baldwin Lane, Orlando, FL 32814
- Configuration includes a townhome, garage apartment, and front commercial space
Financial Insights
Estimated NOI and Cap Rate
NOI / Yr
$44,391
Cap Rate
3.17%
Suggested Prices Based on Cap Rates
Cap Rate 5%
$887,820
$887.8K
Cap Rate 7%
$634,157
$634.2K
Cap Rate 9%
$493,233
$493.2K
Market Conditions
NOI Build-Up for 3,129 SF
Gross rent
$67.6K $21.60/SF
− Vacancy
−$4.2K −$1.33/SF
EGI
$63.4K $20.27/SF
− OpEx
−$19.0K −$6.08/SF
NOI
$44.4K $14.19/SF
Area
Orlando, FL
Vacancy
6.17%
Lease Rate
$21.60 /SF/Yr
Expense Ratio
30.00%
Simulate Cap Rate and NOI
Suggested Prices Based on Cap Rates
Cap Rate 5%
$887,820
Cap Rate 7%
$634,157
Cap Rate 9%
$493,233
Alternative Uses
Best Use
Multifamily LT 5
$634.2K
$554.9K – $739.9K
NOI $44,391 @ 7.0% cap · market cap 3.17%
Second Best
Mixed Use
$590.0K
$516.3K – $688.4K
NOI $41,303 @ 7.0% cap · market cap 2.95%
Theoretical Best
Office A
$1.01M
$882.0K – $1.18M
NOI $70,557 @ 7.0% cap · market cap 5.04%
Zoning and permitted uses should be independently verified with authorities.
Property Analytics
Unlock full access to Insights
Subscribe to Realmo Intelligence
Open Analytics
Current Use
Lease Details
2
Residential units
Location Intelligence
Trade Area within ½ mile
956
Businesses Nearby
Explore this area
Business Placement
Demographics for 32814, FL
9,218
Population
4,533
Households
2
Avg Household Size
35
Median Age
81%
College-Educated
100%
High-School Grad
1.2 sq mi
ZIP Area
7,682
Density / Sq Mi
$129,712
Median Household Income
$67,578
Median Earnings
$2,224
Median Rent
$751,400
Median Home Value
Check the figures for this property
Cap Rate, Value Estimation, Potential NOI and more
View Realmo Analytics
Market
Vacancy Rate% for Multifamily in South region

Questions? Ask Rey
Realmo’s AI knows this listing — price, zoning, demand, history. Ask anything.





Frequently Asked Questions
What type of property is this?
Mixed-use property - Three-unit configuration combines residential living, a garage apartment, and a street-facing commercial suite.
Where is this mixed-use property located?
The property is located at 1567 LAKE BALDWIN Lane Orlando, FL.
What is the asking price?
The asking price for this property is $1,399,000.
What are key features of this property?
This property features: 3,129 SF mixed‑use property with three distinct units; 0.09‑acre site in Baldwin Park at 1567 Lake Baldwin Lane, Orlando, FL 32814; Configuration includes a townhome, garage apartment, and front commercial space


