Renovated Student Housing
For Sale
$6,250,000
1516 W 4th Ave & 808 N Monroe St, Stillwater, OK
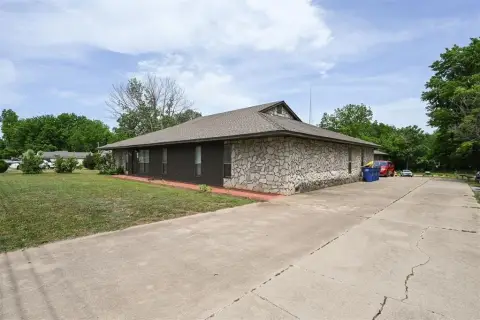
62-unit student housing near Oklahoma State University. Fully leased.
Property Size44,554 SF
Price / SF$140.28
Days on Market314
Property Features for 1516 W 4th Ave & 808 N Monroe St
General Information
Standard status
Active
Size
44,554 SF
Class
C
Property subtype
Multifamily
Building Details
Building Size
44,554 SF
Units
62
Listed By:
Matthew Snyder
(513) 633-2926
Source:
Lee-associates
Added: Nov 26, 2025
Changed: Oct 3
Last Checked: Oct 5 at 4:14PM
Displayed information is deemed reliable but is not guaranteed and should be independently verified. All listing content including descriptions, pricing, images are the copyrighted material of Matthew Snyder
Investment Insights
Based on property information with market context.
The Village & The Tower is a 62-unit, 105-bed student housing community serving Oklahoma State University in Stillwater, Oklahoma. The portfolio, with a property size of 44554 square feet, was comprehensively renovated between 2019 and 2020, providing modern unit finishes and upgraded community infrastructure. The unit mix includes 21 one-bedroom/one-bath units, 40 two-bedroom/one-bath units, and 1 four-bedroom/two-bath unit, offering a diverse range of options for students. The property has demonstrated consistent leasing performance, with 100% occupancy for the 2024–25 academic year and 100% pre-leased for 2025–26. Its proximity to OSU’s core campus and athletic facilities positions the asset as a reliable performer in the Stillwater student housing market.
Key Highlights
- 100% occupancy for the 2024–25 academic year and 100% pre‑leased for 2025–26.
- Recently renovated (2019‑2020) with modern unit finishes and upgraded community infrastructure.
- Located near Oklahoma State University's core campus and athletic facilities.
Financial Insights
Estimated NOI and Cap Rate
NOI / Yr
$317,737
Cap Rate
5.08%
Suggested Prices Based on Cap Rates
Cap Rate 5%
$6,354,740
$6.4M
Cap Rate 7%
$4,539,100
$4.5M
Cap Rate 9%
$3,530,411
$3.5M
Market Conditions
NOI Build-Up for 44,554 SF
Gross rent
$646.9K $14.52/SF
− Vacancy
−$69.2K −$1.55/SF
EGI
$577.7K $12.97/SF
− OpEx
−$260.0K −$5.83/SF
NOI
$317.7K $7.13/SF
Area
Payne County, OK
Vacancy
10.70%
Lease Rate
$14.52 /SF/Yr
Expense Ratio
45.00%
Simulate Cap Rate and NOI
Suggested Prices Based on Cap Rates
Cap Rate 5%
$6,354,740
Cap Rate 7%
$4,539,100
Cap Rate 9%
$3,530,411
Alternative Uses
Best Use
Apartment 5plus
$4.54M
$3.97M – $5.30M
NOI $317,737 @ 7.0% cap · market cap 5.08%
Second Best
—
—
no second resolved use
Theoretical Best
Office A
$10.96M
$9.59M – $12.78M
NOI $766,942 @ 7.0% cap · market cap 12.27%
Zoning and permitted uses should be independently verified with authorities.
Property Analytics
Unlock full access to Insights
Subscribe to Realmo Intelligence
Open Analytics
Current Use
Location Intelligence
Trade Area within ½ mile
275
Businesses Nearby
Explore this area
Business Placement
Check the figures for this property
Cap Rate, Value Estimation, Potential NOI and more
View Realmo Analytics
Market
Vacancy Rate% for Multifamily in South region

Questions? Ask Rey
Realmo’s AI knows this listing — price, zoning, demand, history. Ask anything.




Frequently Asked Questions
What type of property is this?
Apartment building - 62-unit student housing near Oklahoma State University. Fully leased.
Where is this apartment building located?
The property is located at 1516 W 4th Ave & 808 N Monroe St Stillwater, OK.
What is the asking price?
The asking price for this property is $6,250,000.
What are key features of this property?
This property features: 100% occupancy for the 2024–25 academic year and 100% pre‑leased for 2025–26.; Recently renovated (2019‑2020) with modern unit finishes and upgraded community infrastructure.; Located near Oklahoma State University's core campus and athletic facilities.



