Stabilized Multifamily Investment
For Sale
Contact for pricing
Pending
1512 South Corona Avenue, Colorado Springs, CO 80905
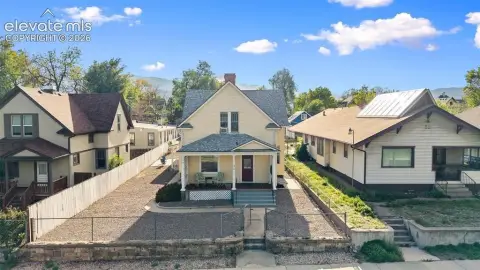
Renovated multifamily property with strong income and growth potential.
Property Size3,140 SF
Days on Market236
Property Features for 1512 South Corona Avenue
General Information
Standard status
Pending
Size
3,140 SF
Class
B
Property subtype
Multifamily
Zoning
MX-M
Occupancy
100%
Investment Type
Stabilized
Net Operating Income
$110,460
Site & Location
Neighborhood
Stratton Meadows
Building Details
Year Built
1956
Year Renovated
2025
Stories
1
Units
8
Listing Agency:
Kenney and Company
Listed By:
Aaron Moore · License #CO FA.100045037
Source:
Crexi
Added: Mar 4
Changed: Aug 8
Last Checked: Aug 8 at 3:12PM
Displayed information is deemed reliable but is not guaranteed and should be independently verified. All listing content including descriptions, pricing, images are the copyrighted material of Kenney and Company

Ask AI about this property
Review the available facts, identify missing information and prepare questions for the agent.
Investment Insights
Based on property information with market context.
The property at 1512 S Corona Ave presents an opportunity to acquire a stabilized multifamily investment in Colorado Springs, Colorado. The property generates $10,320 in current monthly rents, producing approximately $131,500 in annual gross income and $110,460 in net operating income. This represents an 8.8% in-place cap rate at the $1,250,000 list price. The property consists of eight renovated one-bedroom units positioned to serve the workforce housing demand in Colorado Springs. Units average approximately 420–450 square feet and have undergone improvements within the last 24 months, including new appliances, flooring, windows, doors, and electrical upgrades. Operational efficiency is enhanced through a RUB utility reimbursement system, which offsets utility costs and supports a low operating expense ratio of approximately 16%. Colorado Springs continues to experience population and employment growth driven by major regional employers including Fort Carson, Peterson Space Force Base, and Schriever Space Force Base. With average market rents approaching $1,800 across the metro area, the property offers both immediate cash flow and long-term rent growth potential. This offering is suited for cash-flow investors, owner-operators, and 1031 exchange buyers seeking stabilized income with embedded upside in one of Colorado’s fastest-growing markets. The property size is 3,140 square feet.
Key Highlights
- 8. 8% in‑place cap rate at the $1,250,000 list price, generating $110,460 net operating income.
- Eight renovated one‑bedroom units with substantial improvements in the last 24 months.
- Strong workforce housing demand in Colorado Springs.
Financial Insights
Estimated NOI and Cap Rate
NOI / Yr
$38,114
Cap Rate
3.05%
Suggested Prices Based on Cap Rates
Cap Rate 5%
$762,280
$762.3K
Cap Rate 7%
$544,486
$544.5K
Cap Rate 9%
$423,489
$423.5K
Market Conditions
NOI Build-Up for 3,140 SF
Gross rent
$73.1K $23.28/SF
− Vacancy
−$3.8K −$1.21/SF
EGI
$69.3K $22.07/SF
− OpEx
−$31.2K −$9.93/SF
NOI
$38.1K $12.14/SF
Area
Colorado Springs, CO
Vacancy
5.20%
Lease Rate
$23.28 /SF/Yr
Expense Ratio
45.00%
Simulate Cap Rate and NOI
Suggested Prices Based on Cap Rates
Cap Rate 5%
$762,280
Cap Rate 7%
$544,486
Cap Rate 9%
$423,489
Alternative Uses
Best Use
Apartment 5plus
$544.5K
$476.4K – $635.2K
NOI $38,114 @ 7.0% cap · market cap 3.05%
Second Best
—
—
no second resolved use
Theoretical Best
Specialty Retail
$620.1K
$542.6K – $723.5K
NOI $43,407 @ 7.0% cap · market cap 3.47%
Zoning and permitted uses should be independently verified with authorities.
How Realmo checks its estimates
Property Analytics
Who owns this building?
See the owner, sales and loan history
Open Analytics
Location Intelligence
Trade Area within ½ mile
812
Businesses Nearby
Explore this area
Business Placement
Demographics for 80905, CO
17,592
Population
8,933
Households
2
Avg Household Size
38
Median Age
39%
College-Educated
92%
High-School Grad
5.1 sq mi
ZIP Area
3,449
Density / Sq Mi
$64,496
Median Household Income
$40,876
Median Earnings
$1,449
Median Rent
$349,500
Median Home Value
Check the figures for this property
Cap Rate, Value Estimation, Potential NOI and more
View Realmo Analytics
Market
Vacancy Rate% for Multifamily in West region



Frequently Asked Questions
What type of property is this?
Apartment building - Renovated multifamily property with strong income and growth potential.
Where is this apartment building located?
The property is located at 1512 South Corona Avenue Colorado Springs, CO.
What is the asking price?
The asking price for this property is $1,250,000.
What are key features of this property?
This property features: 8. 8% in‑place cap rate at the $1,250,000 list price, generating $110,460 net operating income.; Eight renovated one‑bedroom units with substantial improvements in the last 24 months.; Strong workforce housing demand in Colorado Springs.



