Freestanding Flex
For Sale
$275,000
1502 S Lipscomb Street, Amarillo, TX 79102
Commercial Sale, Amarillo, TX
Property Size3,916 SF
Price / SF$70.22
Days on Market147
Property Features for 1502 S Lipscomb Street
General Information
Property type
Commercial Sale
Property subtype
Other
Zoning description
0100 - NW Amarillo in City Limits
Parking
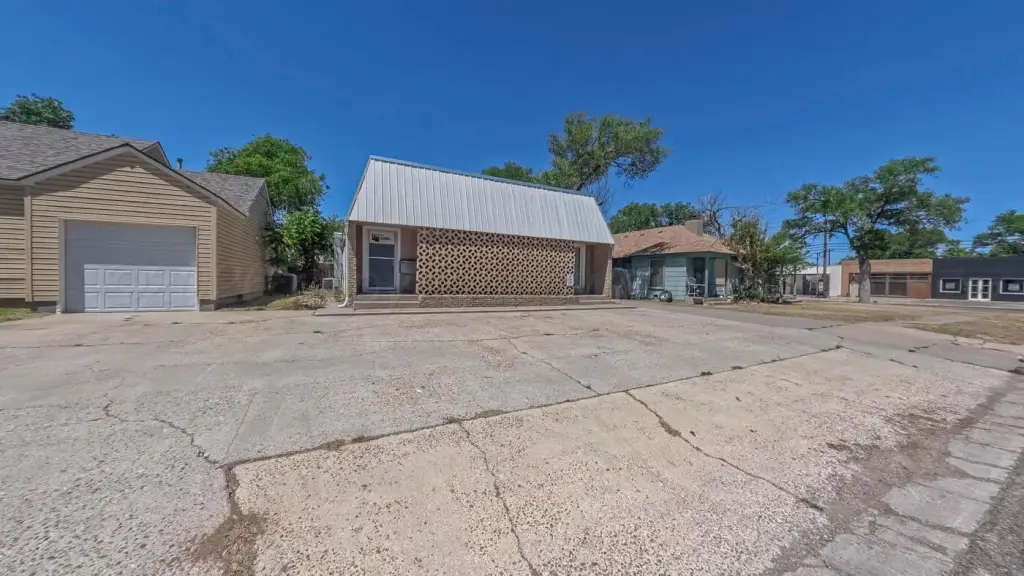
5
Directions
Heading north on Georgia, turn right onto 15th Avenue and continue almost to Washington Street. Turn right onto Lipscomb Street; the building will be on the right-hand side.
Subdivision
0101 - Bivins
Standard status
Active
APN
214583
Size
3,916 SF
Taxes and HOA fees
Tax Description
CENTRAL SQUARE ADDN, LOT 002, BLK 0002
Legal Description
CENTRAL SQUARE ADDN, LOT 002, BLK 0002
Utilities
Cooling system
Central Air
Amenities
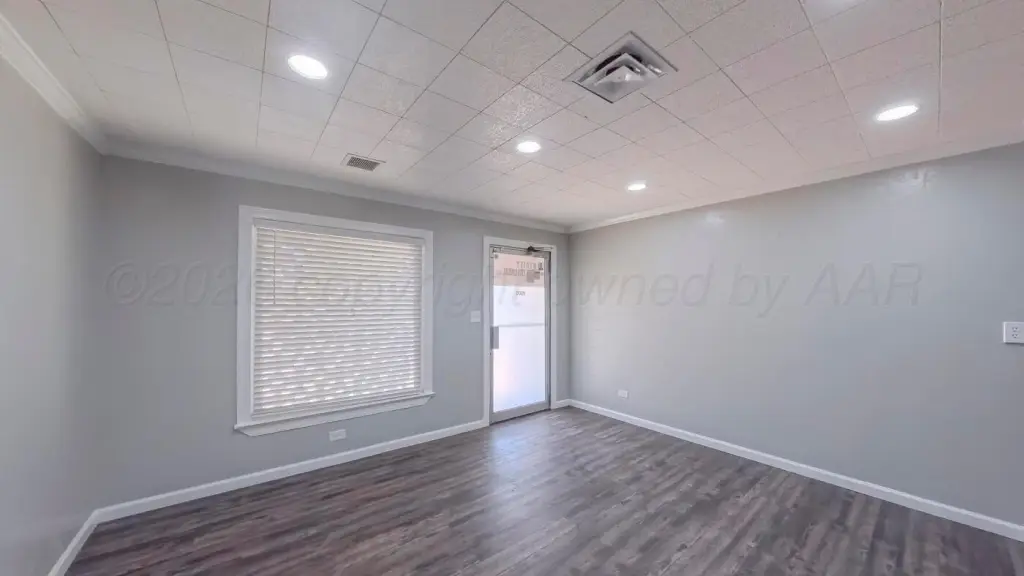
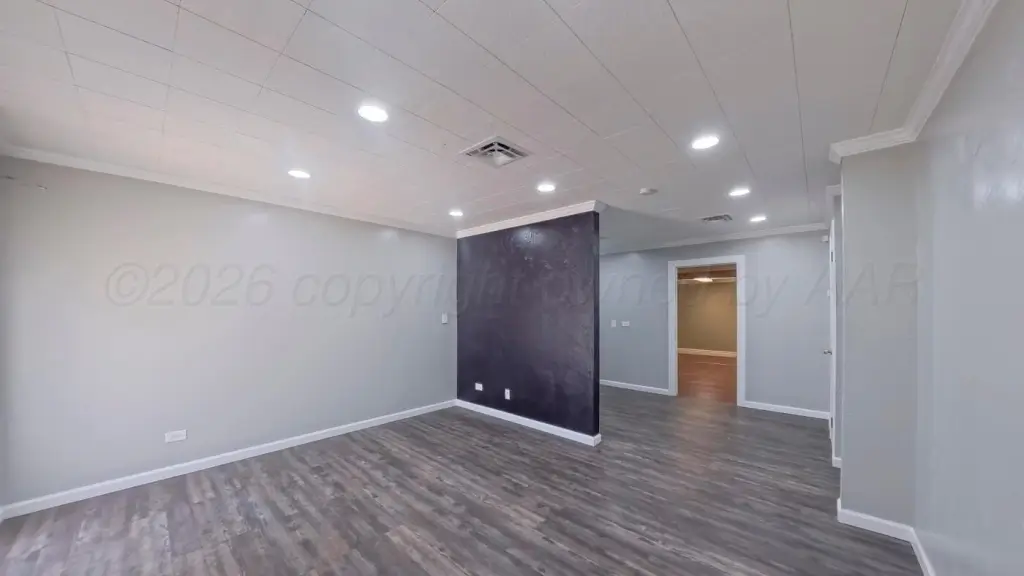
reception area
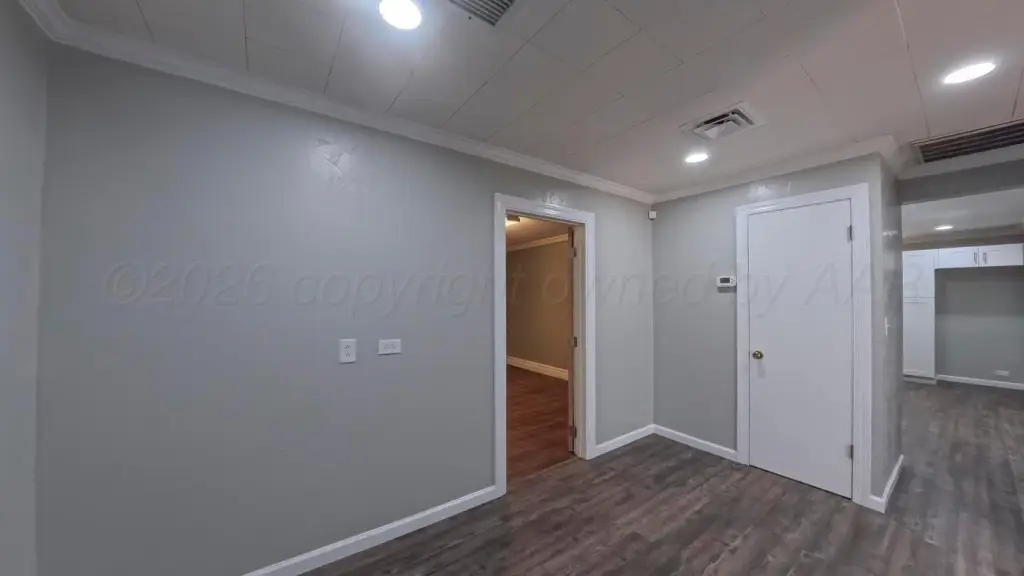
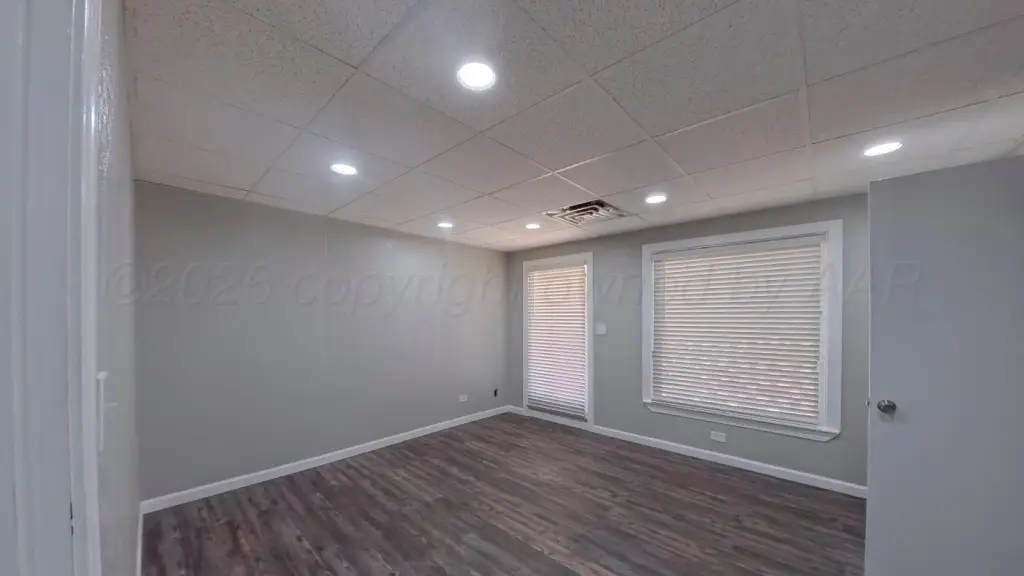
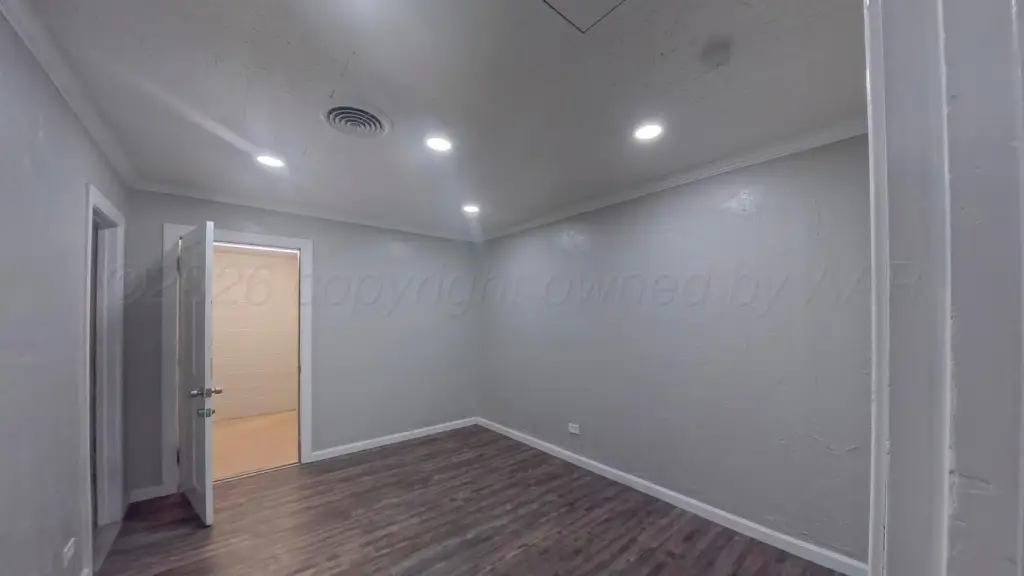
private offices
conference room
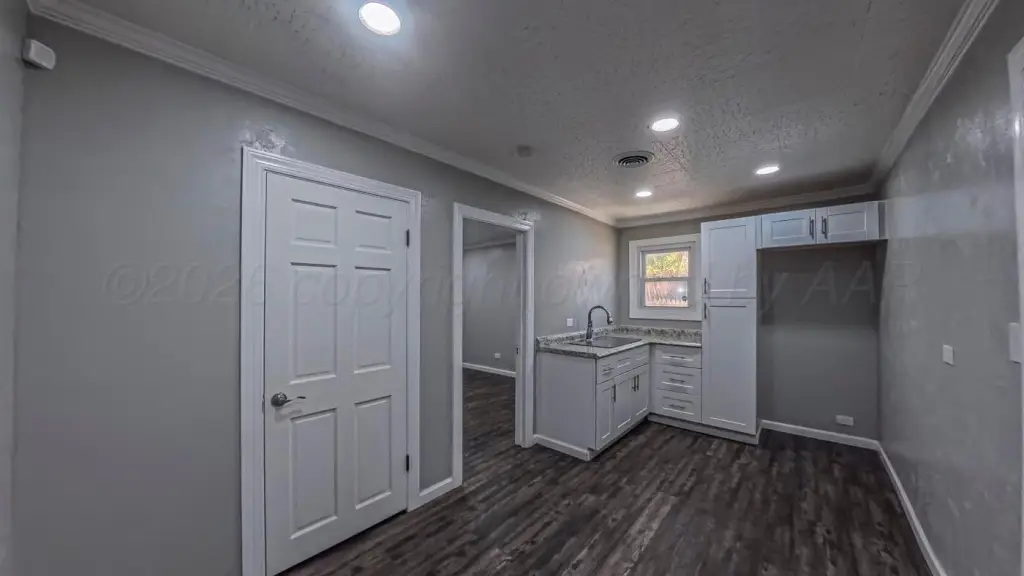
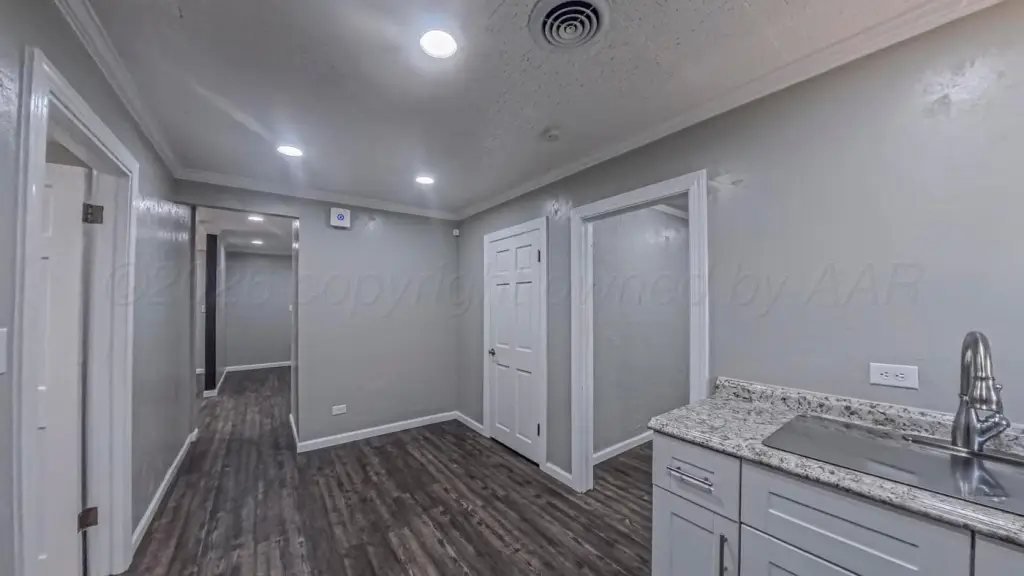
kitchen/break area
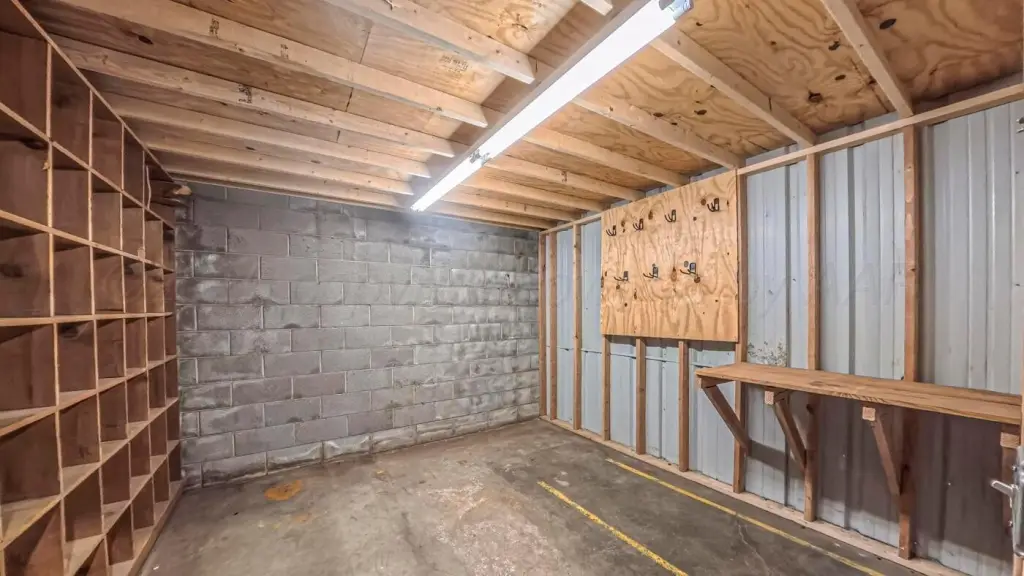
ample storage
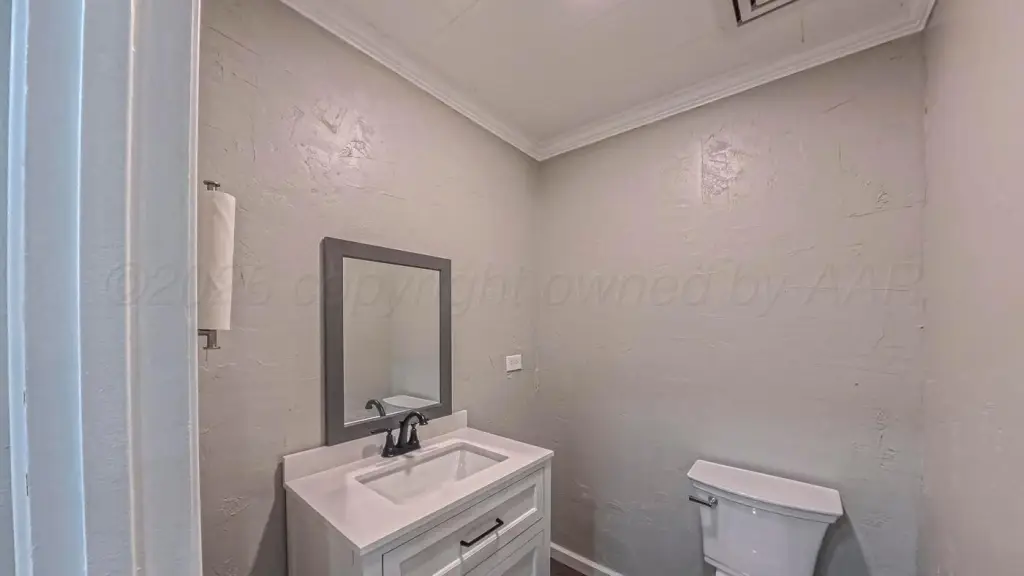
two restrooms
Building Details
Year built
1941
Listing Agency:
Gaut Whittenburg Emerson Commercial Real Estate, LLC
Listed By:
Meagan Brown · License ##800118
(806) 373-3111
Added: May 14
Changed: Sep 5
Last Checked: Oct 7 at 8:06PM
MLS# 26-3913
Copyright © 2026 Amarillo Association of REALTORS. All rights reserved. All information provided by the listing agent/broker is deemed reliable but is not guaranteed and should be independently verified.
Investment Insights
Based on property information with market context.
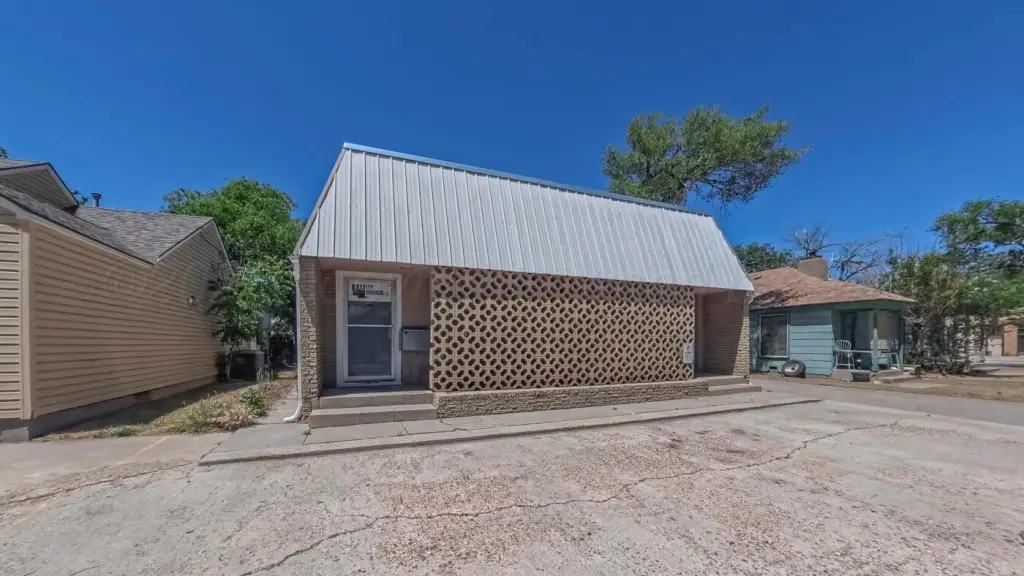
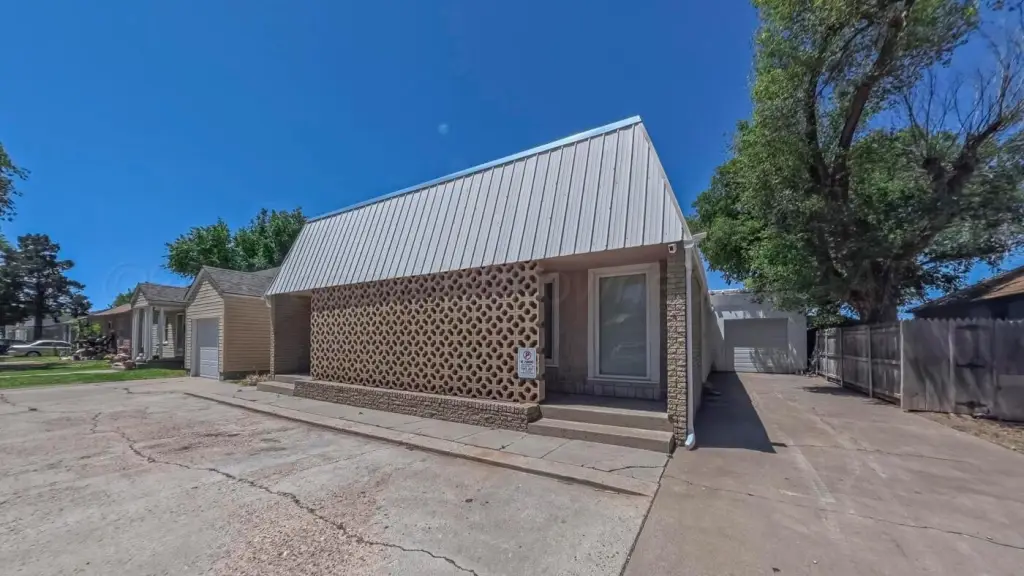
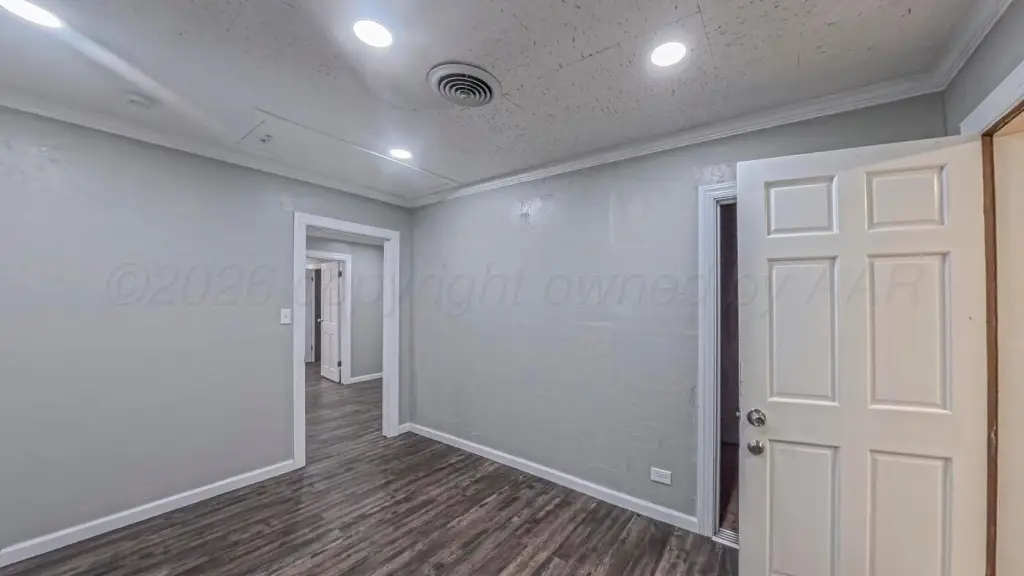
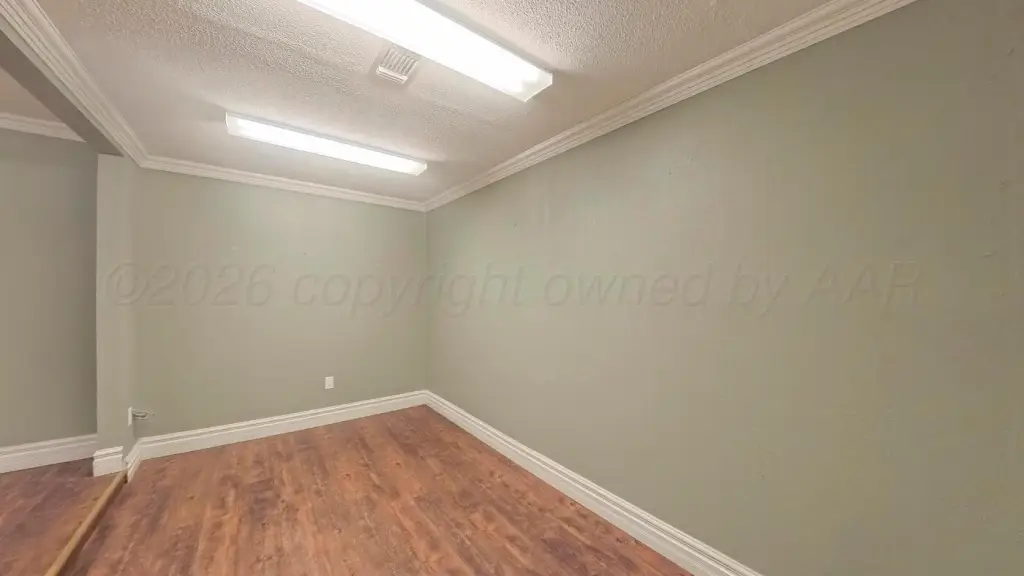
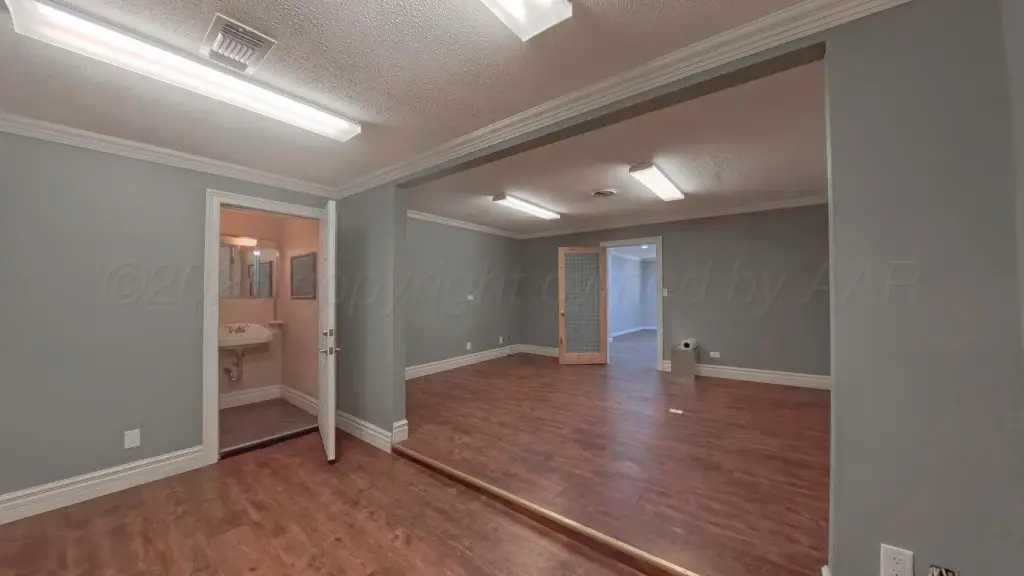
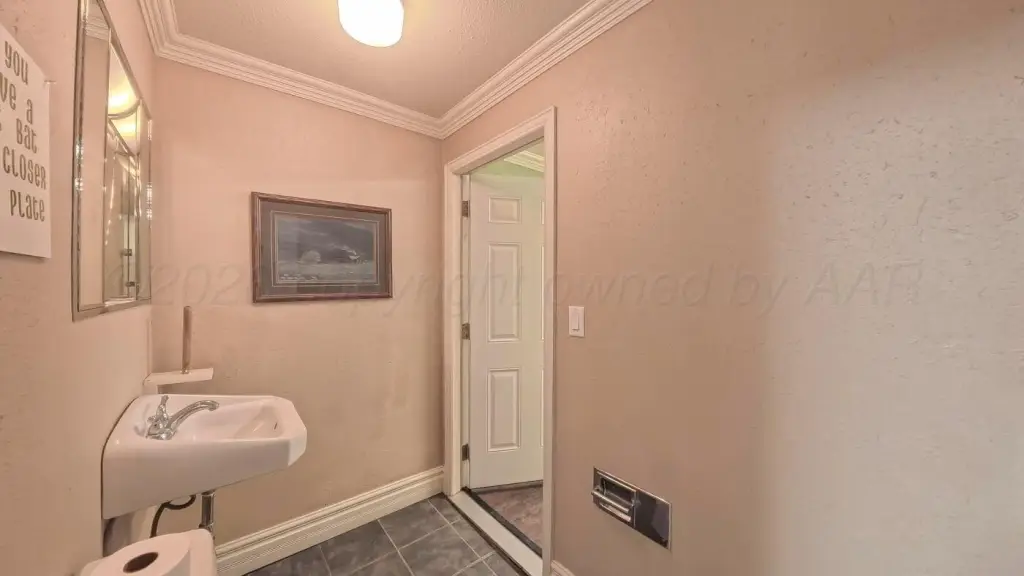
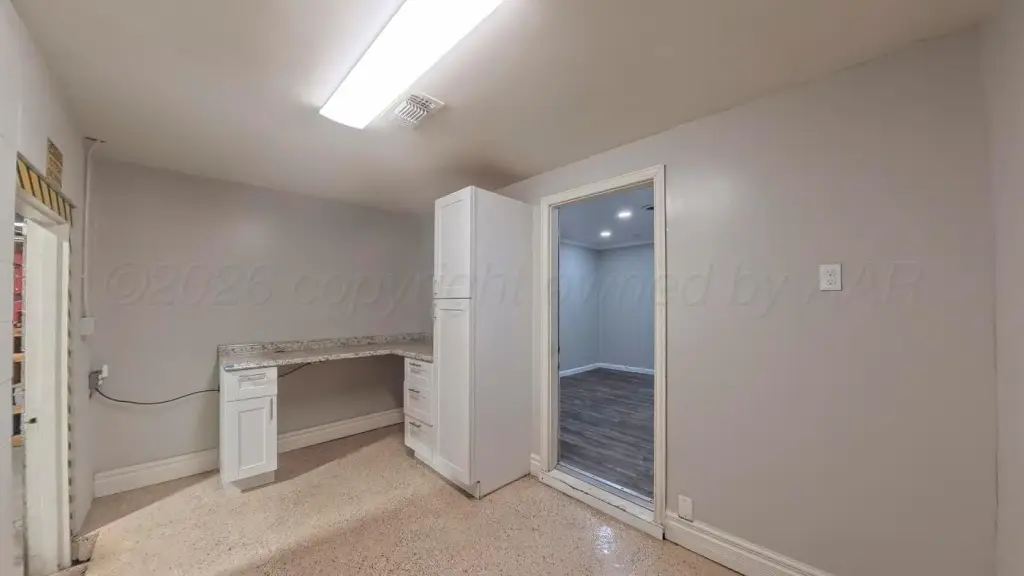
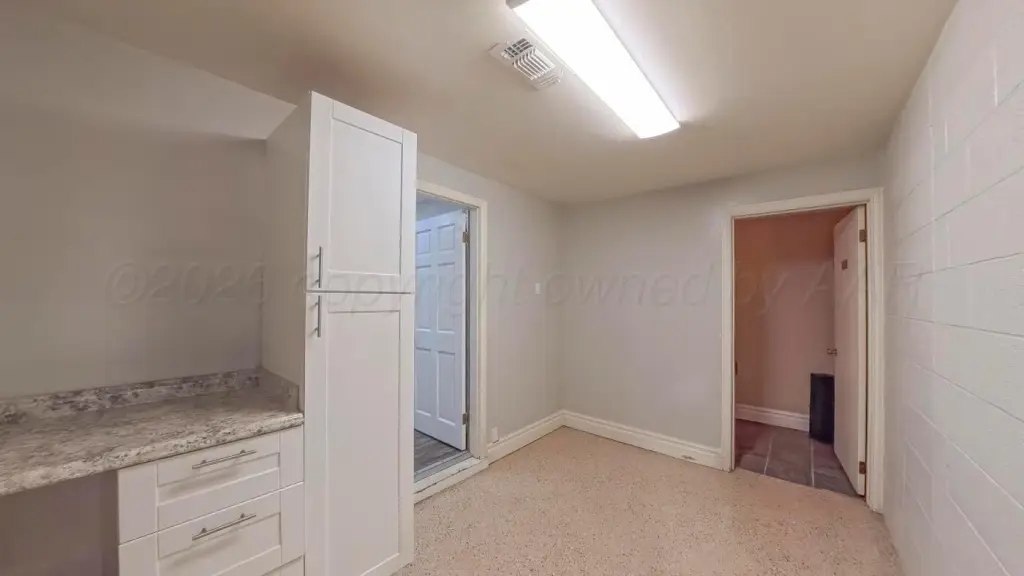
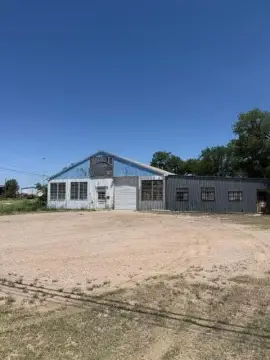
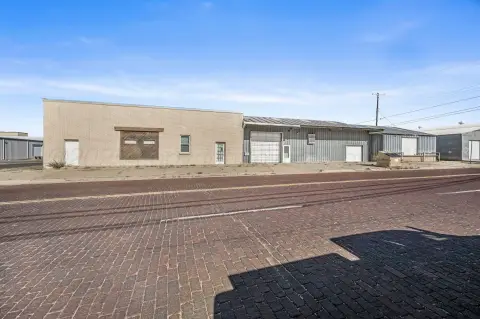
This 3,916-square-foot freestanding flex property, built in 1941, combines a front office component with rear warehouse and storage space. The office area includes reception space, private offices, a conference room, kitchen and break area, storage, and two restrooms. Recent upgrades include the roof, HVAC systems, LED lighting, and gutters.
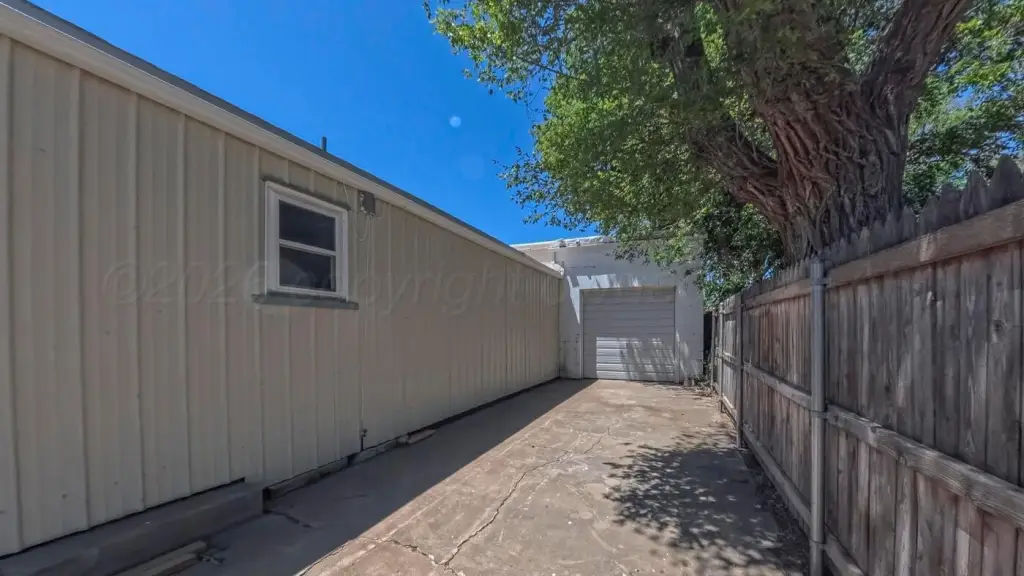
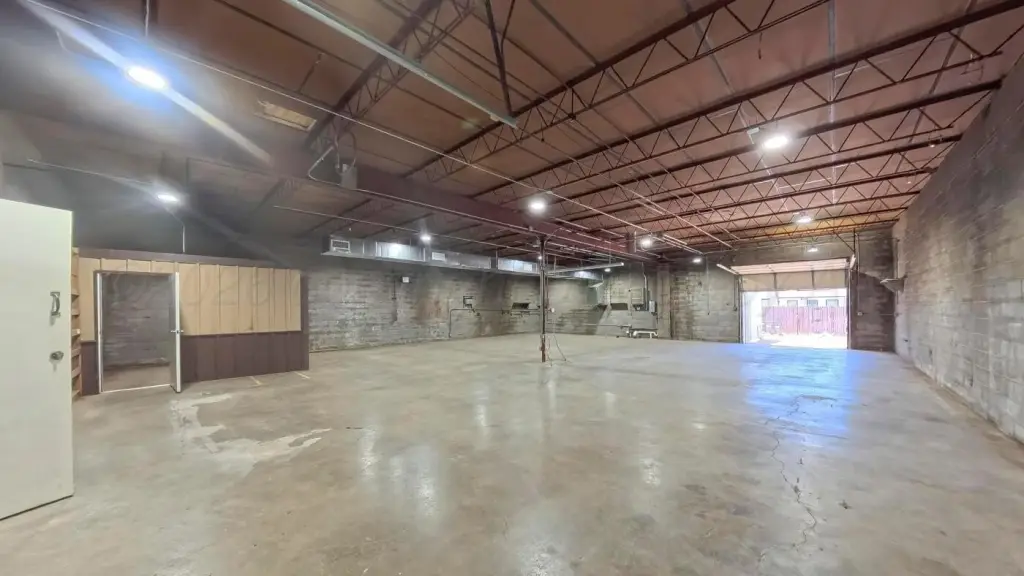
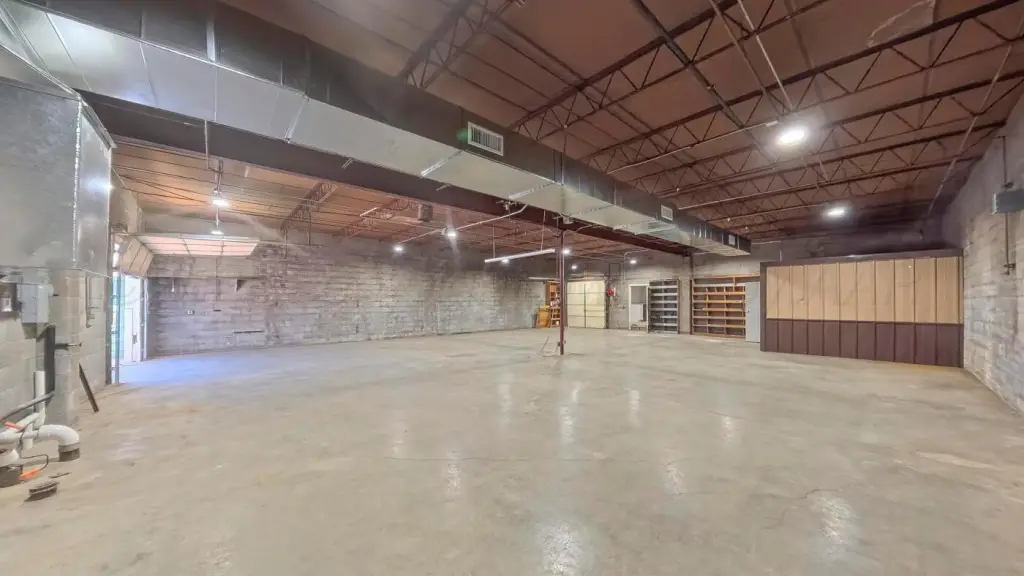
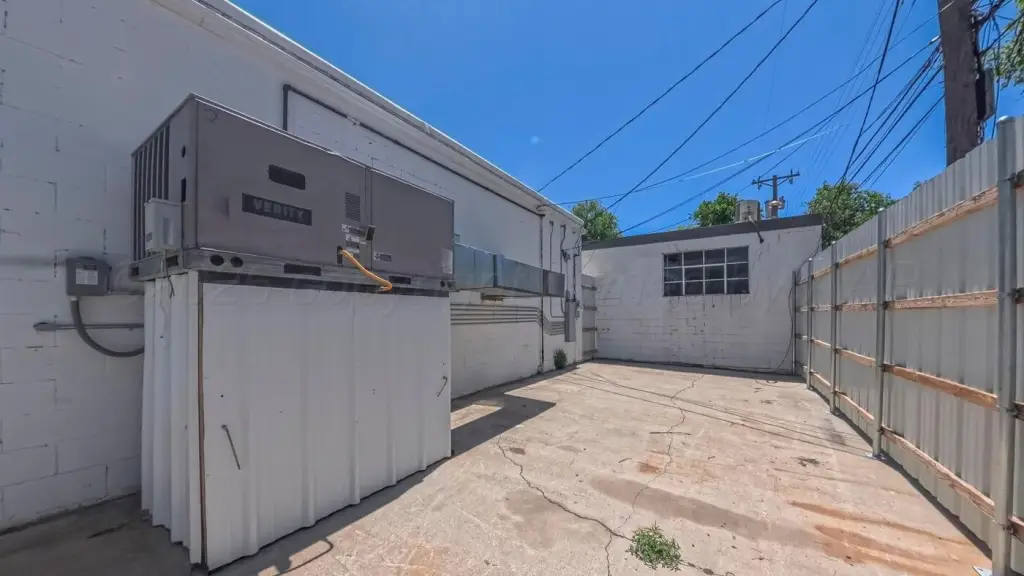
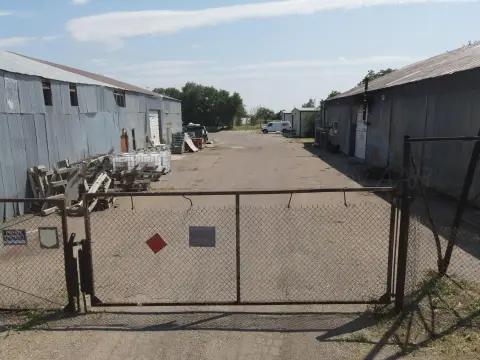
The warehouse provides pull-through functionality through two 8-foot overhead doors, along with three-phase electrical service and compressed air lines. A fenced side yard adds secured exterior storage. Located just off I-40 near downtown Amarillo and major supply vendors, the property is configured for office-warehouse operations including roofing, plumbing, wholesale, and retail sales.
The warehouse provides pull-through functionality through two 8-foot overhead doors, along with three-phase electrical service and compressed air lines. A fenced side yard adds secured exterior storage. Located just off I-40 near downtown Amarillo and major supply vendors, the property is configured for office-warehouse operations including roofing, plumbing, wholesale, and retail sales.
Key Highlights
- 3,916 SF freestanding flex property built in 1941
- Updated office area with reception, private offices, conference room, kitchen, storage, and two restrooms
- Warehouse includes two 8‑foot overhead doors with pull‑through access
Financial Insights
Estimated NOI and Cap Rate
NOI / Yr
$23,561
Cap Rate
8.57%
Suggested Prices Based on Cap Rates
Cap Rate 5%
$471,220
$471.2K
Cap Rate 7%
$336,586
$336.6K
Cap Rate 9%
$261,789
$261.8K
Market Conditions
NOI Build-Up for 3,916 SF
Gross rent
$35.2K $9.00/SF
− Vacancy
−$1.6K −$0.41/SF
EGI
$33.7K $8.59/SF
− OpEx
−$10.1K −$2.58/SF
NOI
$23.6K $6.02/SF
Area
Amarillo, TX
Vacancy
4.50%
Lease Rate
$9.00 /SF/Yr
Expense Ratio
30.00%
Simulate Cap Rate and NOI
Suggested Prices Based on Cap Rates
Cap Rate 5%
$471,220
Cap Rate 7%
$336,586
Cap Rate 9%
$261,789
Alternative Uses
Best Use
Office B
$641.9K
$561.7K – $748.9K
NOI $44,936 @ 7.0% cap · market cap 16.34%
Second Best
Warehouse
$438.2K
$383.5K – $511.3K
NOI $30,676 @ 7.0% cap · market cap 11.15%
Theoretical Best
Office A
$874.3K
$765.0K – $1.02M
NOI $61,202 @ 7.0% cap · market cap 22.26%
Zoning and permitted uses should be independently verified with authorities.
Property Analytics
Unlock full access to Insights
Subscribe to Realmo Intelligence
Open Analytics
Current Use
Lease Details
2
Drive-in doors
Yes
Fenced yard
Yes
Highway access
Location Intelligence
Trade Area within ½ mile
929
Businesses Nearby
Under-served
Demand for This Use
Explore this area
Business Placement
Demographics for 79102, TX
9,252
Population
4,695
Households
2
Avg Household Size
35
Median Age
20%
College-Educated
78%
High-School Grad
2.7 sq mi
ZIP Area
3,427
Density / Sq Mi
$48,551
Median Household Income
$34,911
Median Earnings
$891
Median Rent
$146,500
Median Home Value
Check the figures for this property
Cap Rate, Value Estimation, Potential NOI and more
View Realmo Analytics
Market
Vacancy Rate% for Office in South region

Questions? Ask Rey
Realmo’s AI knows this listing — price, zoning, demand, history. Ask anything.






Similar Off Market Nearby
- Best Amarillo Catering — 2400 sw 7th ave #251, amarillo, tx 79106
Frequently Asked Questions
What type of property is this?
Flex space - Office and warehouse areas combine with updated systems, pull-through access, and fenced outdoor storage.
Where is this flex space located?
The property is located at 1502 S Lipscomb Street Amarillo, TX.
What is the asking price?
The asking price for this property is $275,000.
What are key features of this property?
This property features: 3,916 SF freestanding flex property built in 1941; Updated office area with reception, private offices, conference room, kitchen, storage, and two restrooms; Warehouse includes two 8‑foot overhead doors with pull‑through access



