Historic Mixed-Use
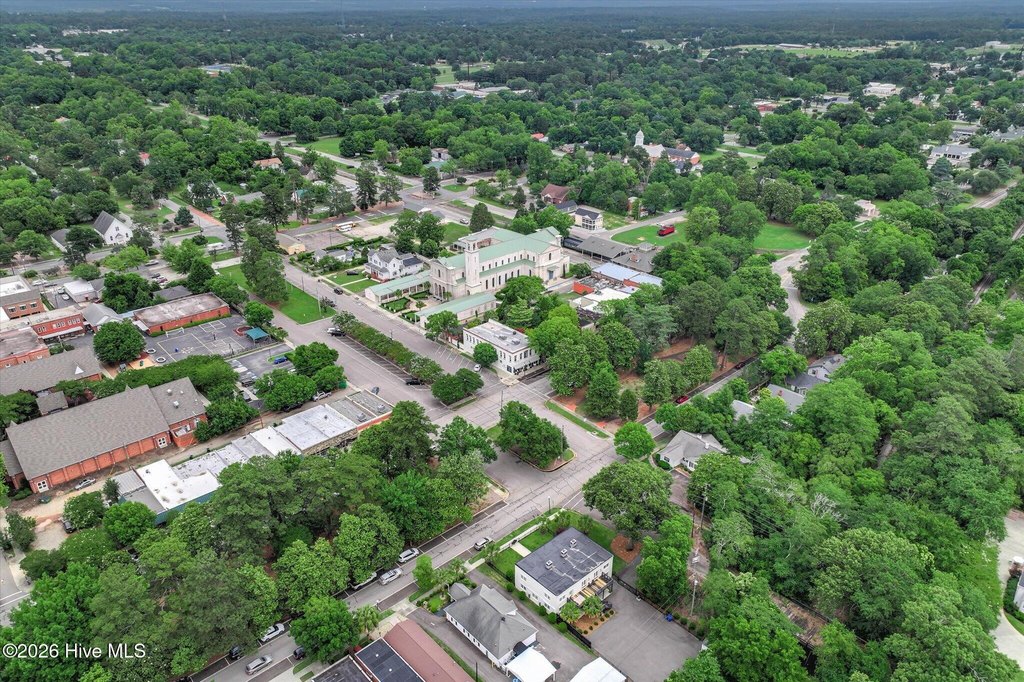
For Sale
$2,500,000
150 Fairfield Street SE, Aiken, SC 29801
Commercial Sale, Aiken, SC
Property Size8,070 SF
Lot Size0.14 Acres
Price / SF$309.79
Days on Market145
Property Features for 150 Fairfield Street SE
General Information
Property type
Commercial Sale
Property subtype
Office
Zoning
DB
Parking features
On Street, Off Street
Fireplace
1
Lot features
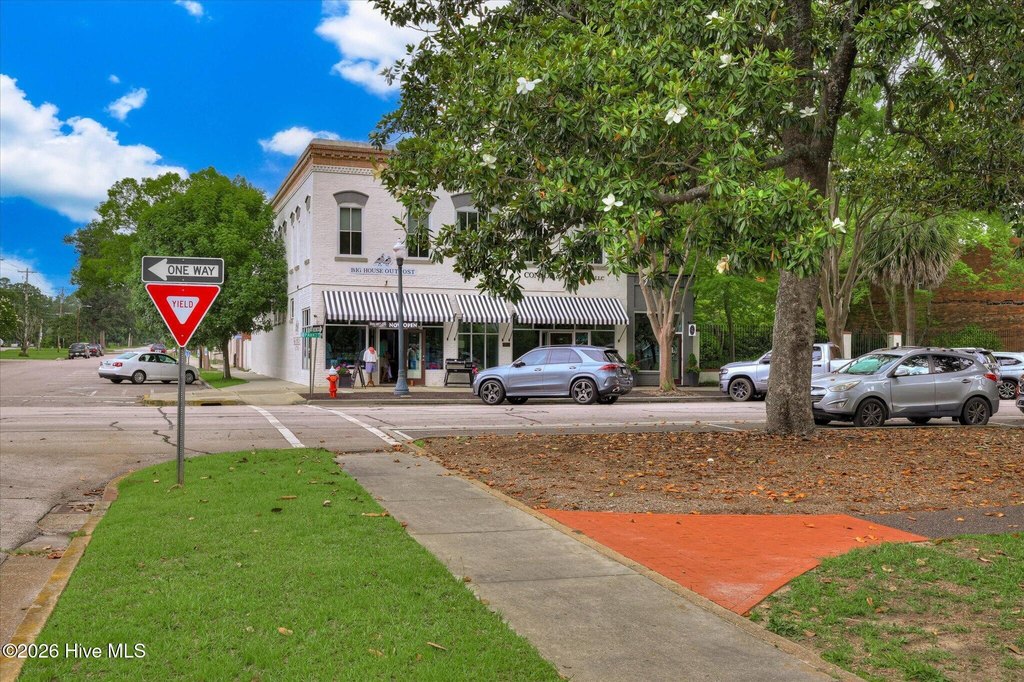
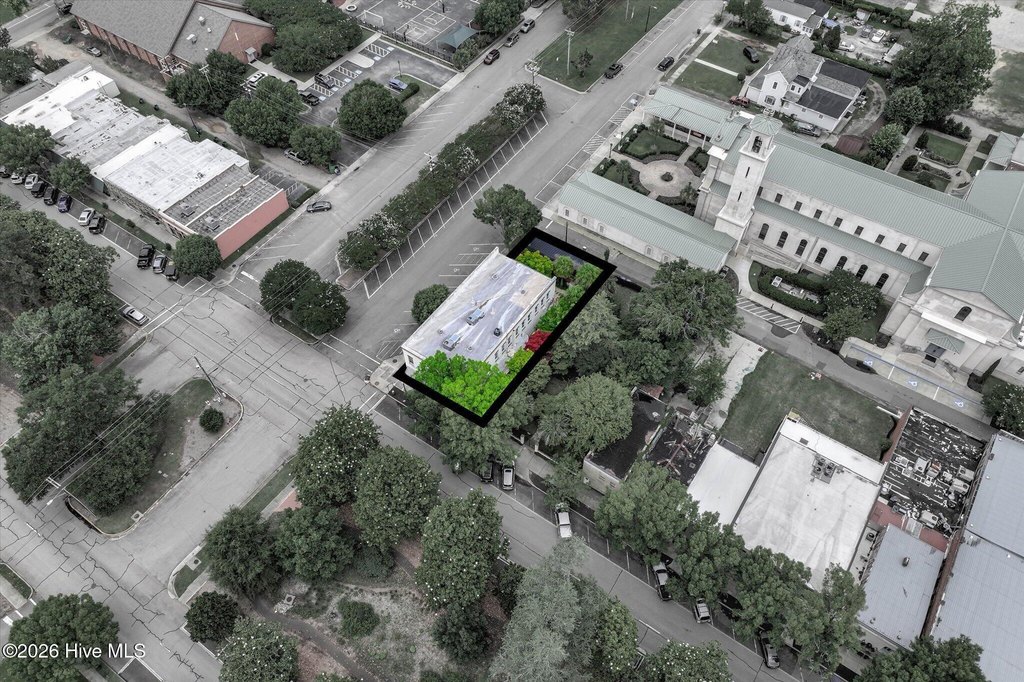
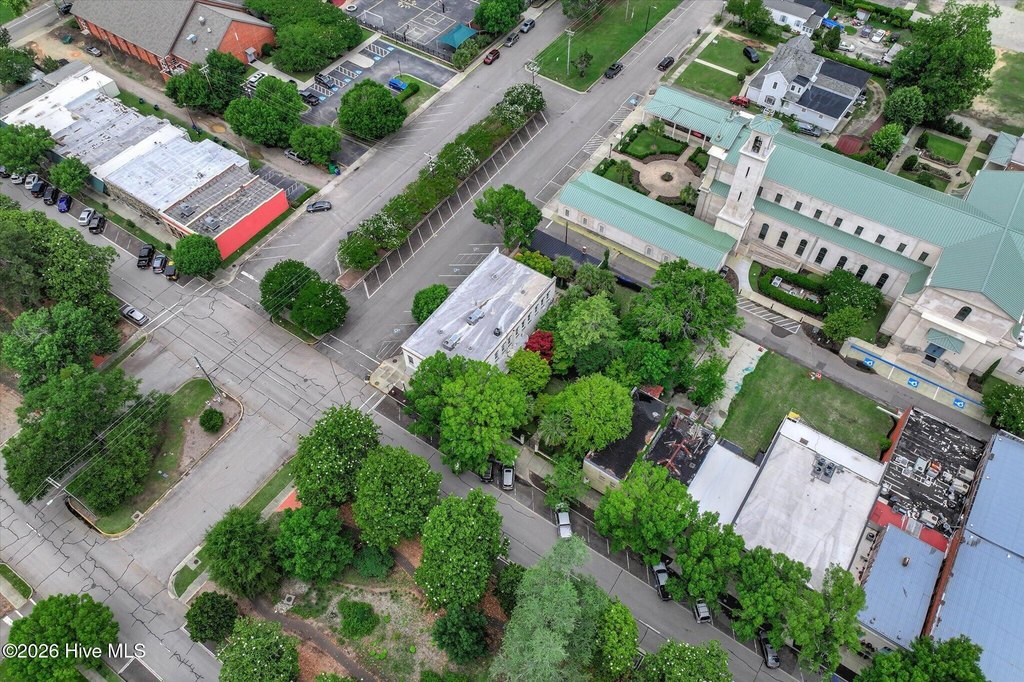
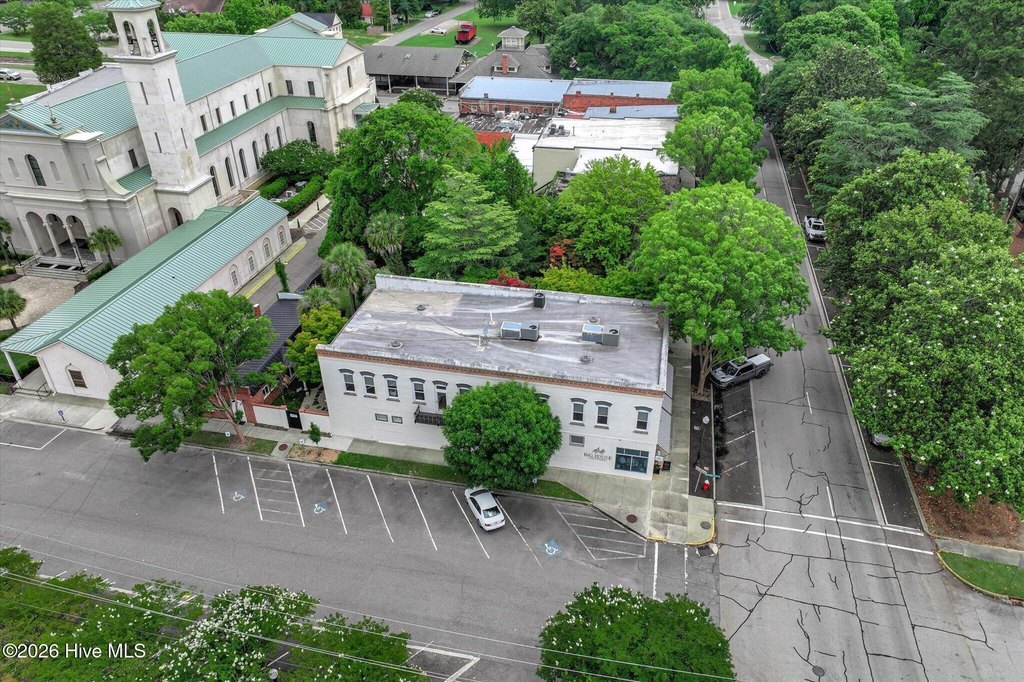
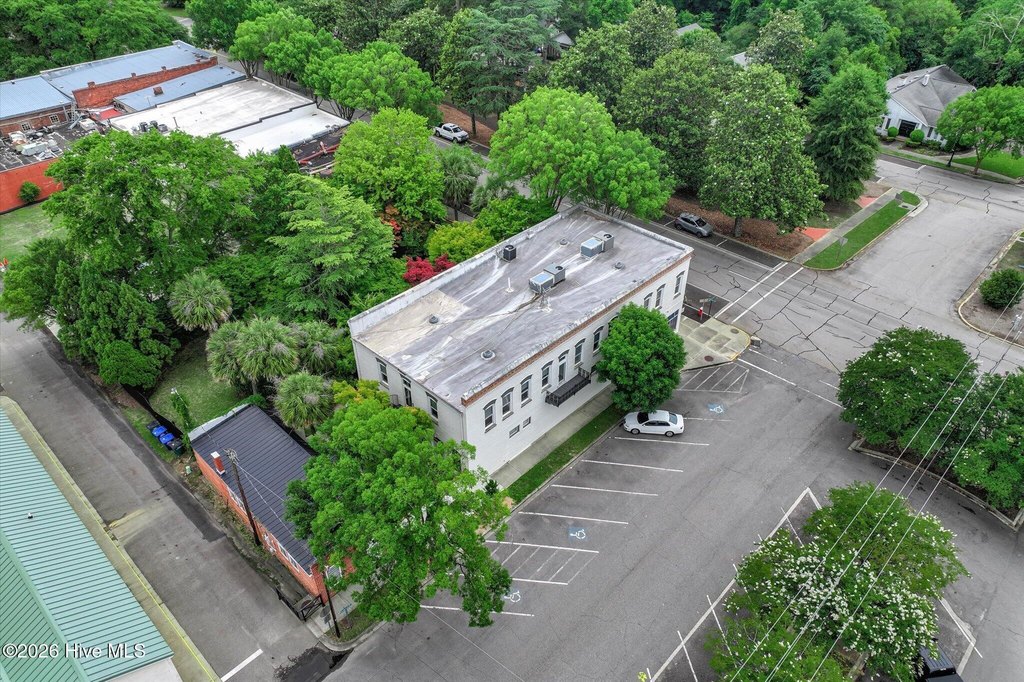
Corner Lot, Landscaped
Directions
From Augusta, head east on Hwy 78 for 15 miles. Bear right on Hayne Ave for 1.5 miles to Fairfield St. Building will be on your left.
Standard status
Active
APN
1213014001
Size
8,070 SF
Lot size
0.14 Acres
Taxes and HOA fees
Tax Year
2025
Tax Description
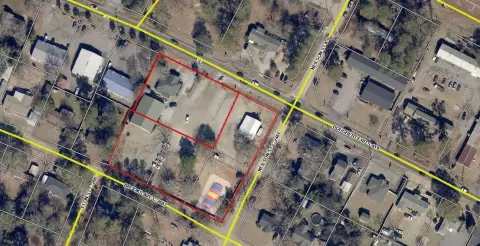
BLK 92 CRNR OF PARK & FAIRFIELD
Tax Annual Amount
21108
Legal Description
BLK 92 CRNR OF PARK & FAIRFIELD
Utilities
Utilities
Water Available
Sewer type
Public Sewer
Heating system
Electric (Heating), Heat Pump (Heating), Zoned
Cooling system
Central Air, Zoned, Heat Pump
Water source
Public
Amenities
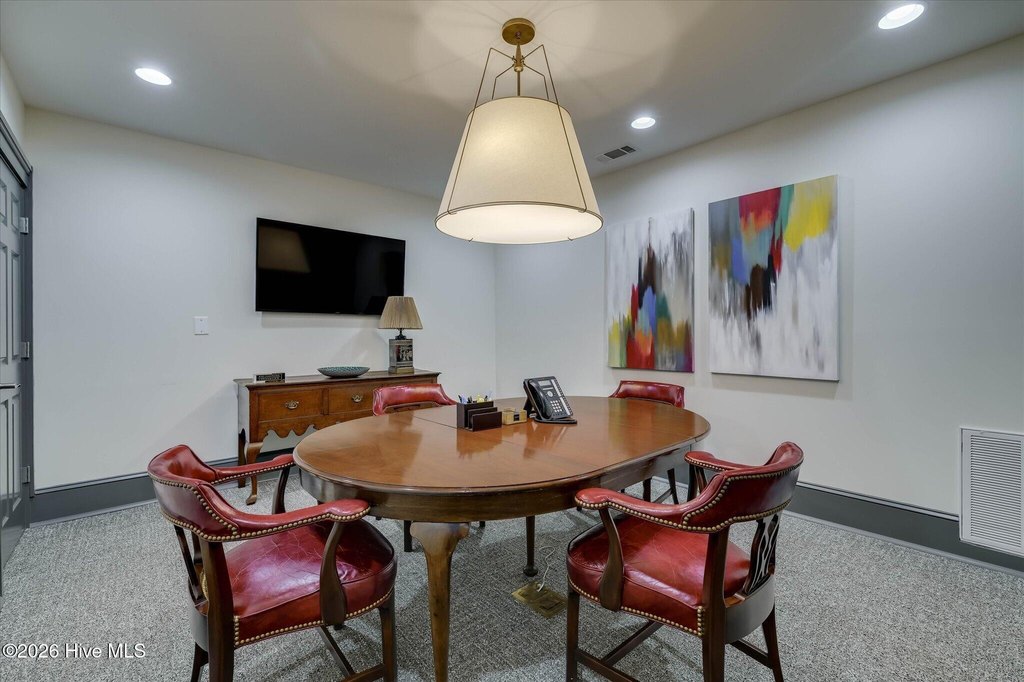
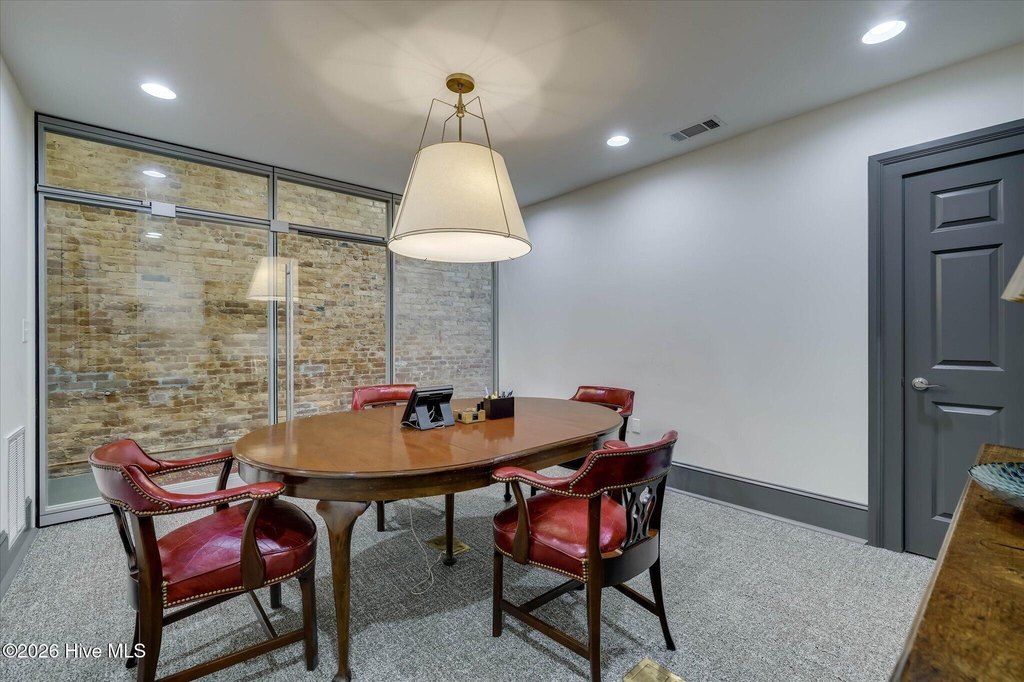
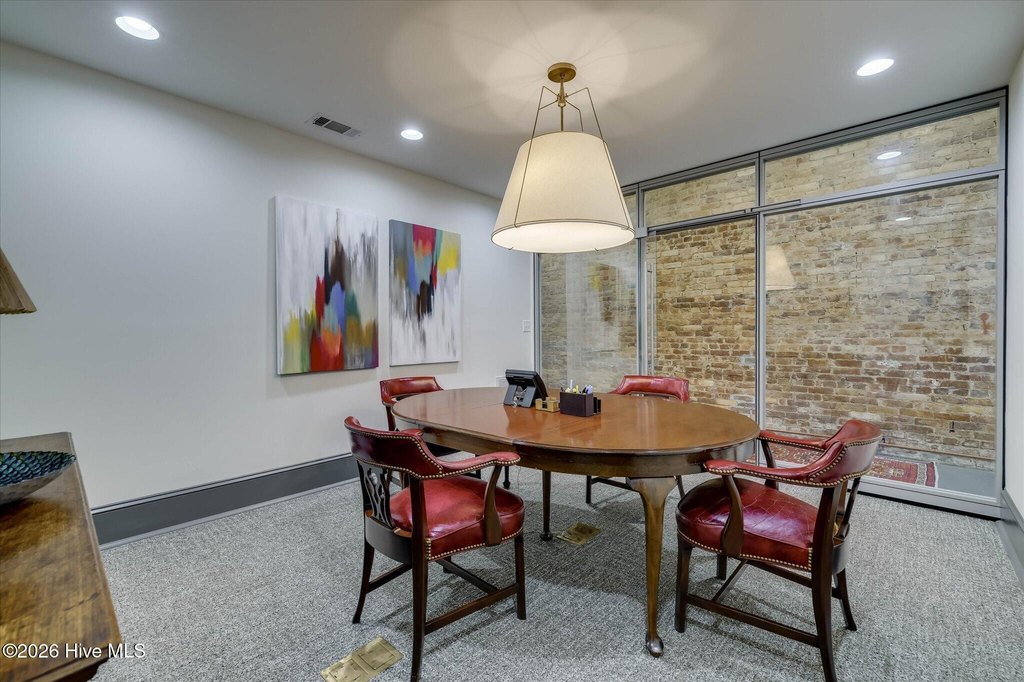
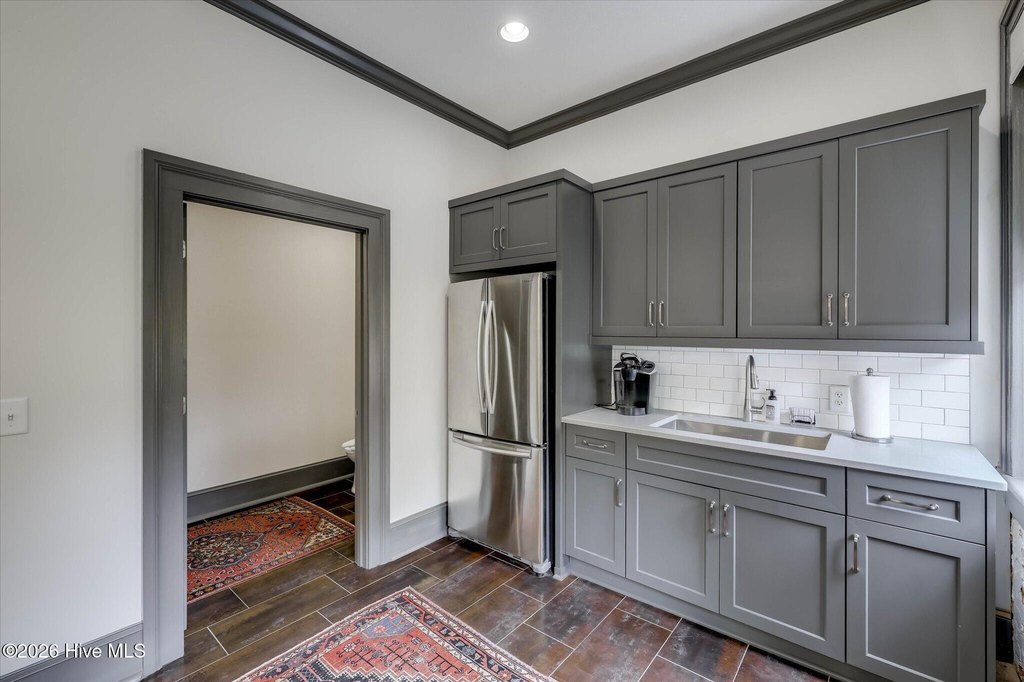
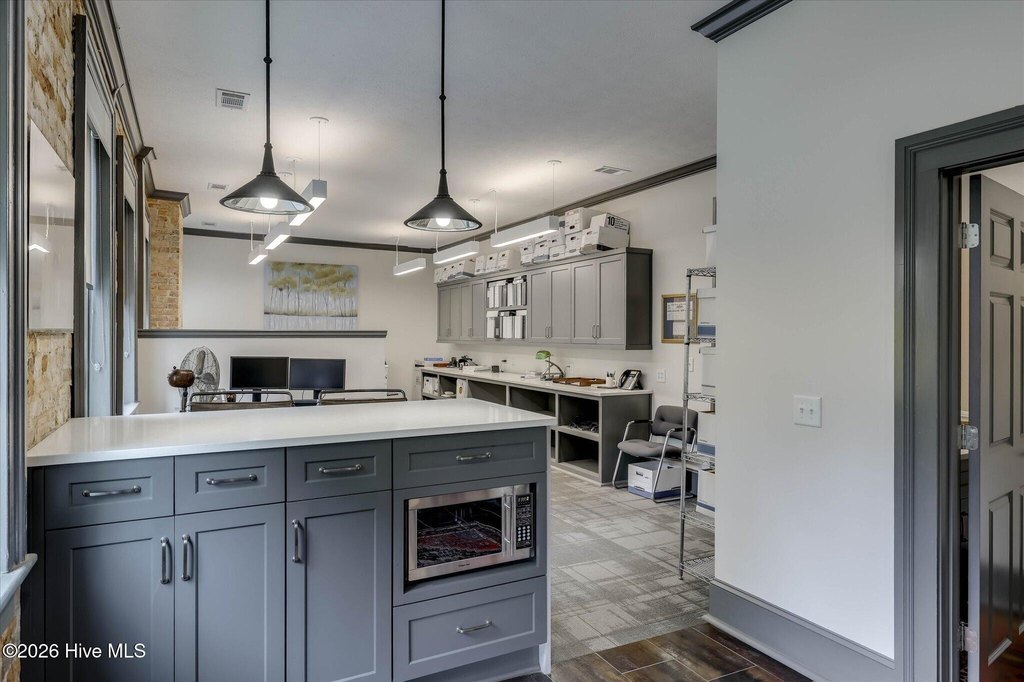
conference room
coffee bar
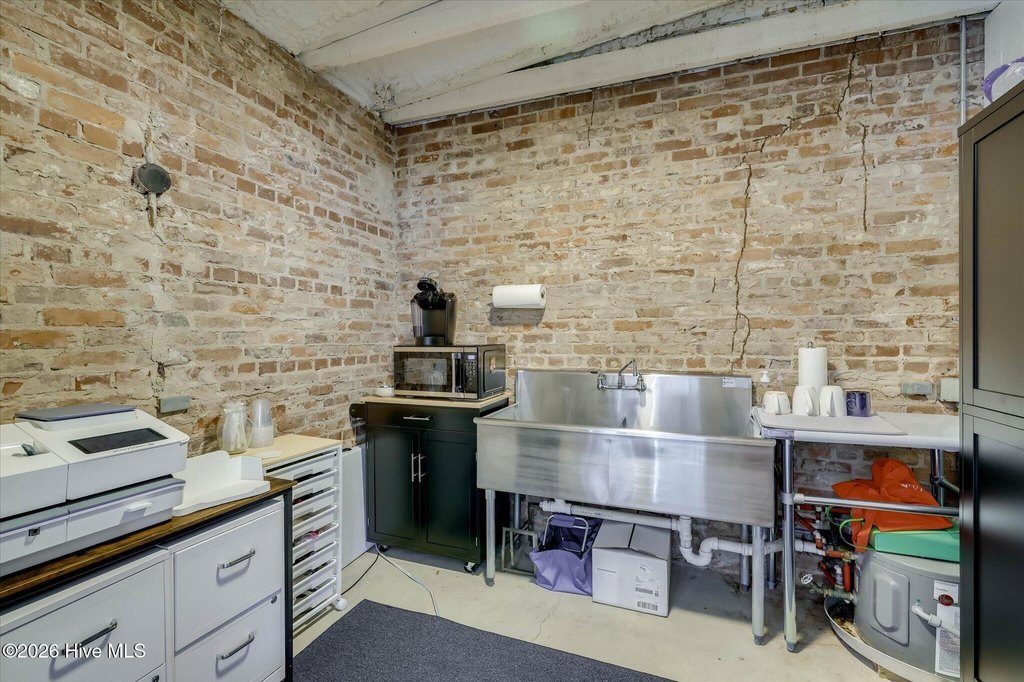
kitchen
fireplaces
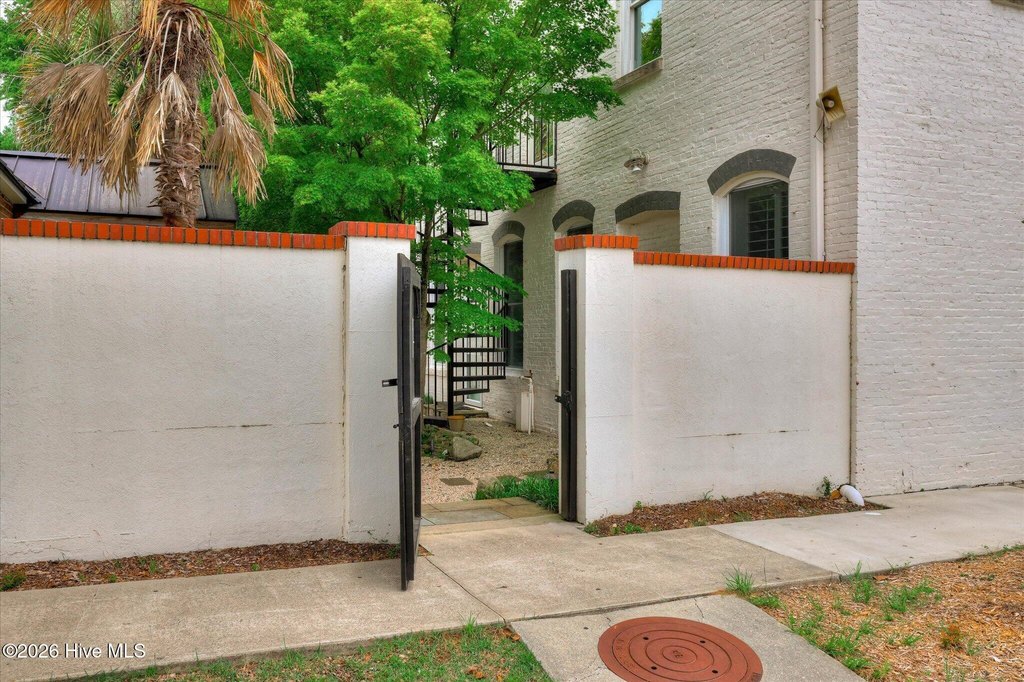
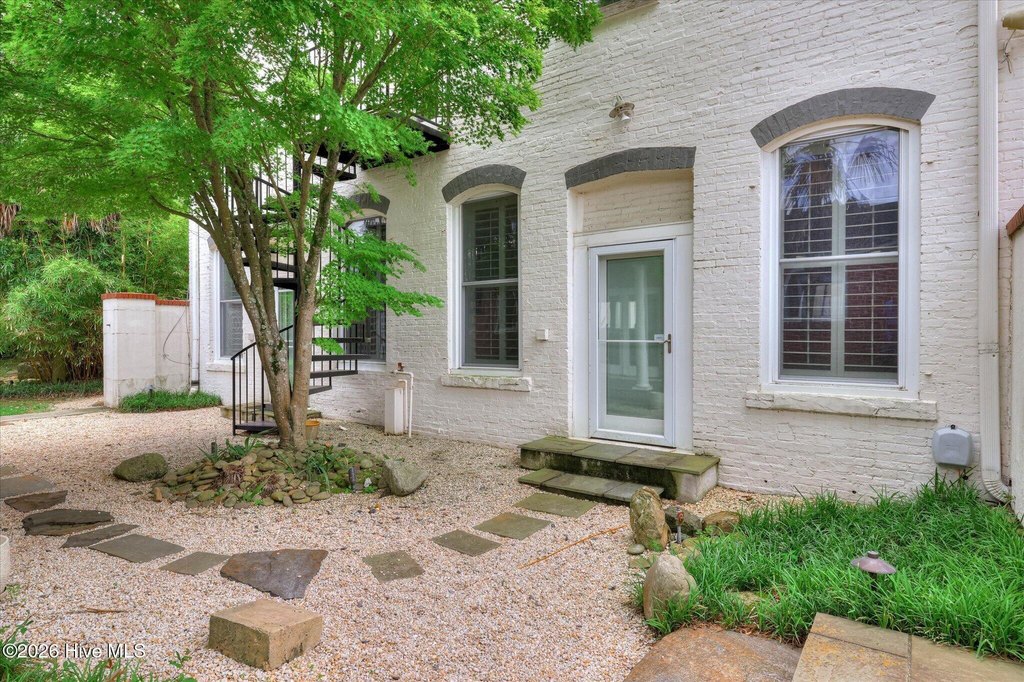
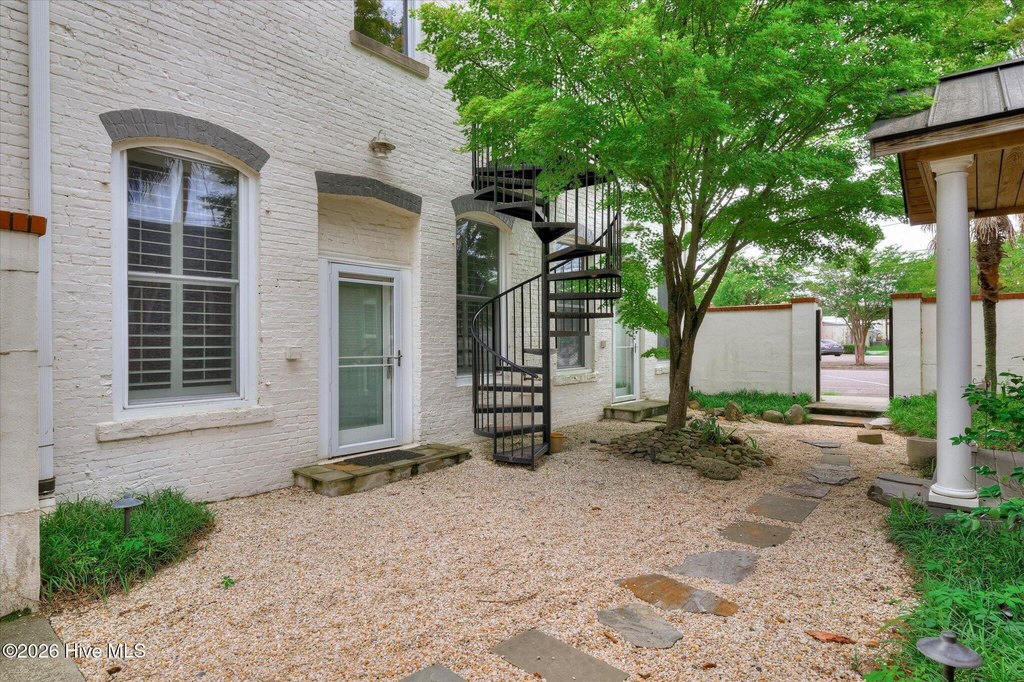
garden courtyard
Building Details
Year built
1890
Flooring type
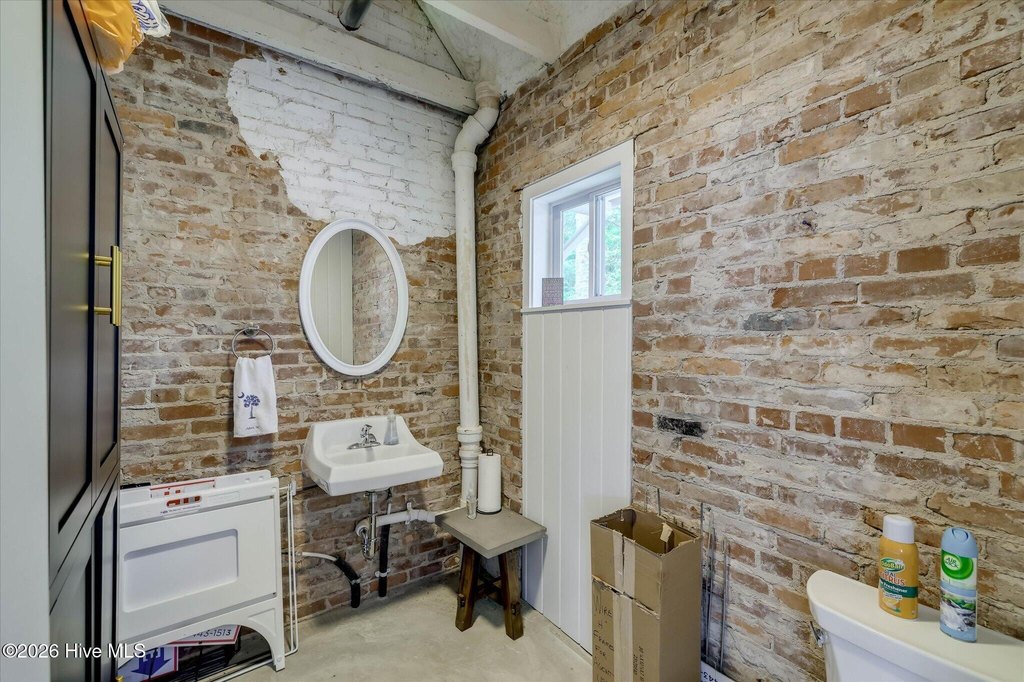
Tile, Concrete, Carpet, Hardwood
Building materials
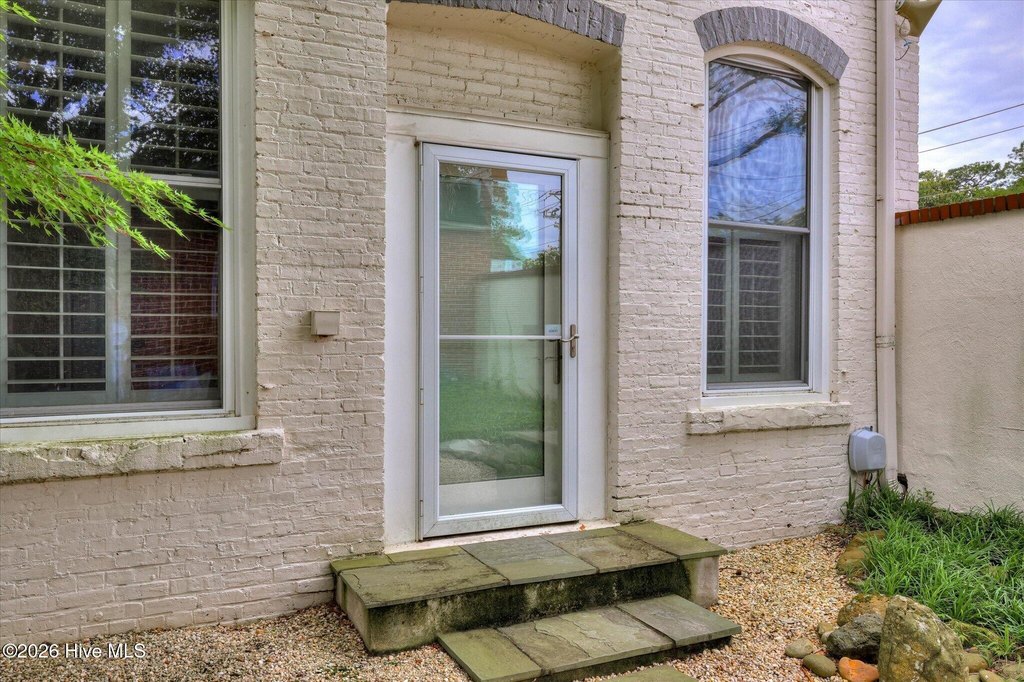
Brick
Roof type
Membrane
Listing Agency:
Meybohm Commercial Properties
(706) 736-0700
Listed By:
Karen A Daly · License #SC97250
(803) 215-1082
Added: May 22
Changed: Sep 12
Last Checked: Oct 13 at 6:06PM
MLS# 100576260
Copyright © 2026 Hive MLS. All rights reserved. All information provided by the listing agent/broker is deemed reliable but is not guaranteed and should be independently verified.
Investment Insights
Based on property information with market context.
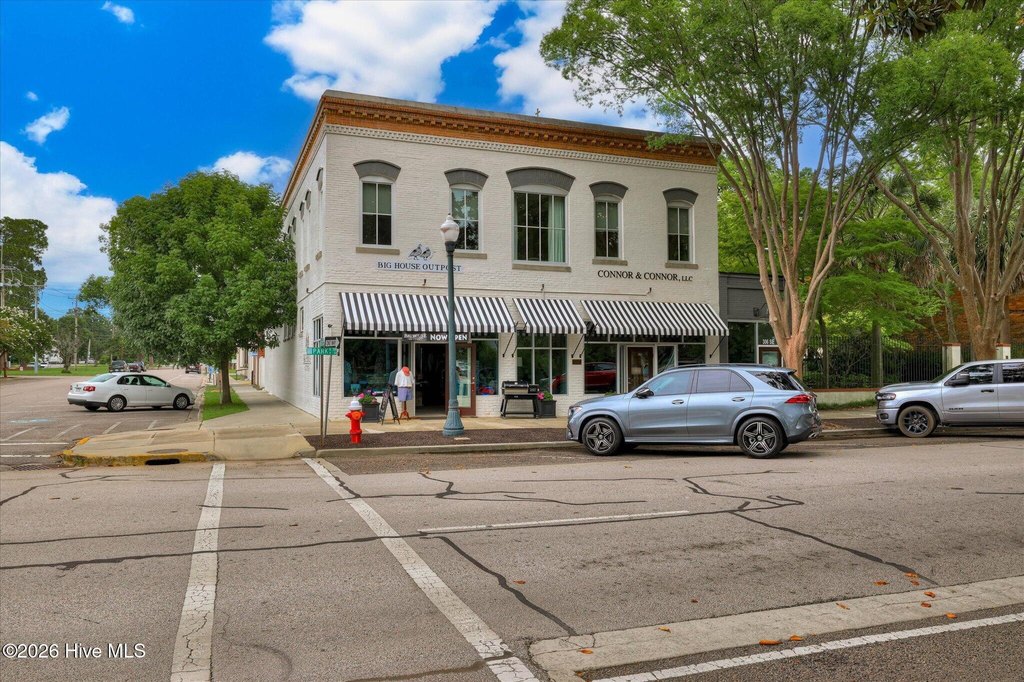
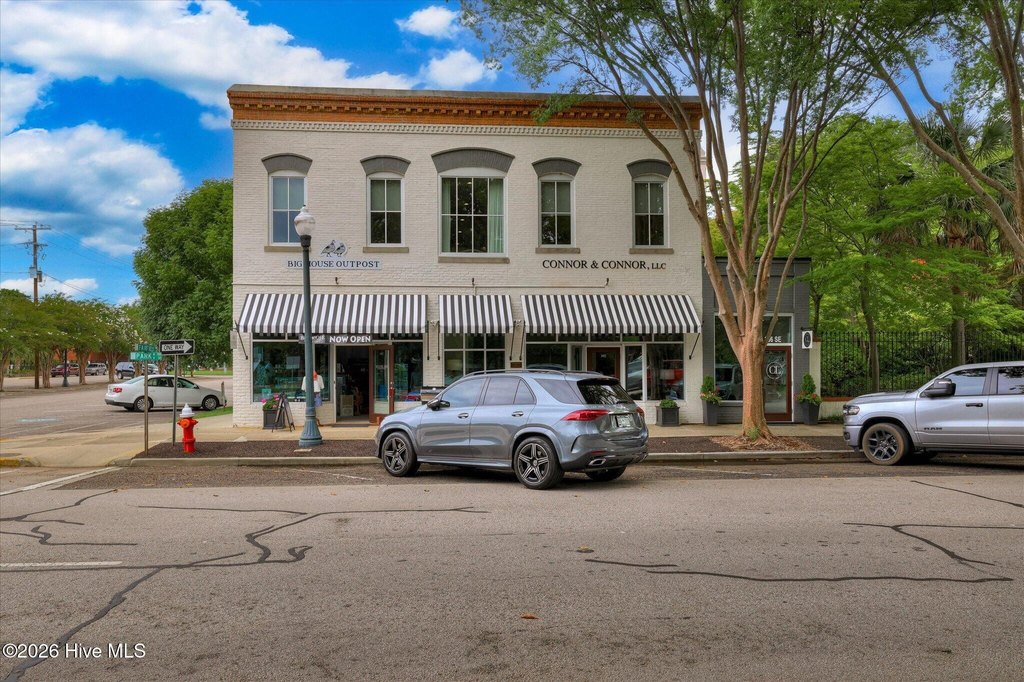
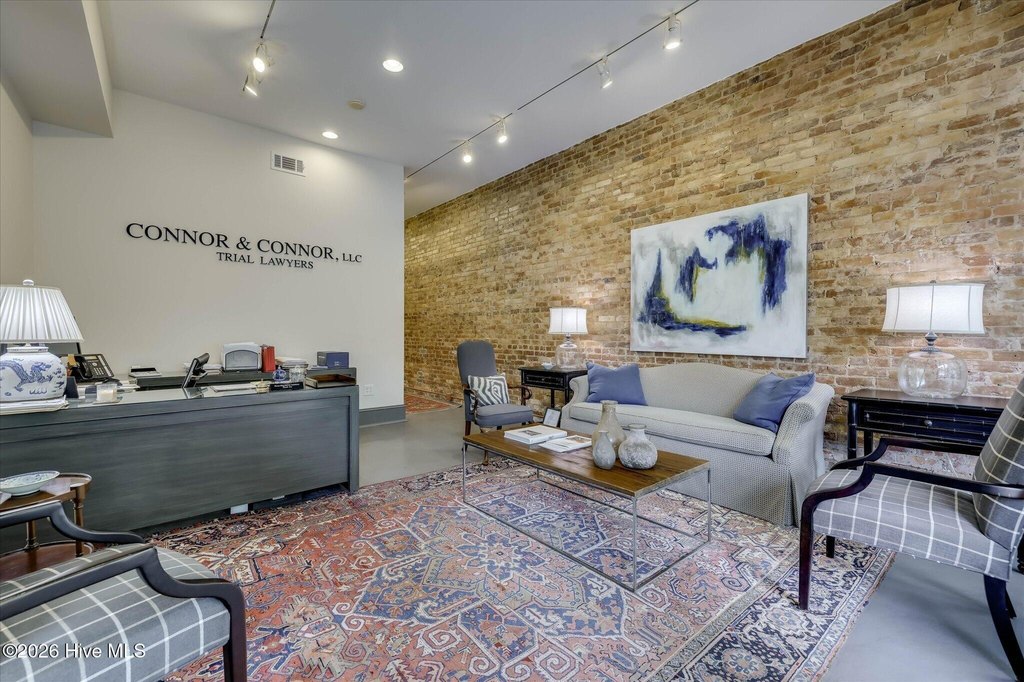
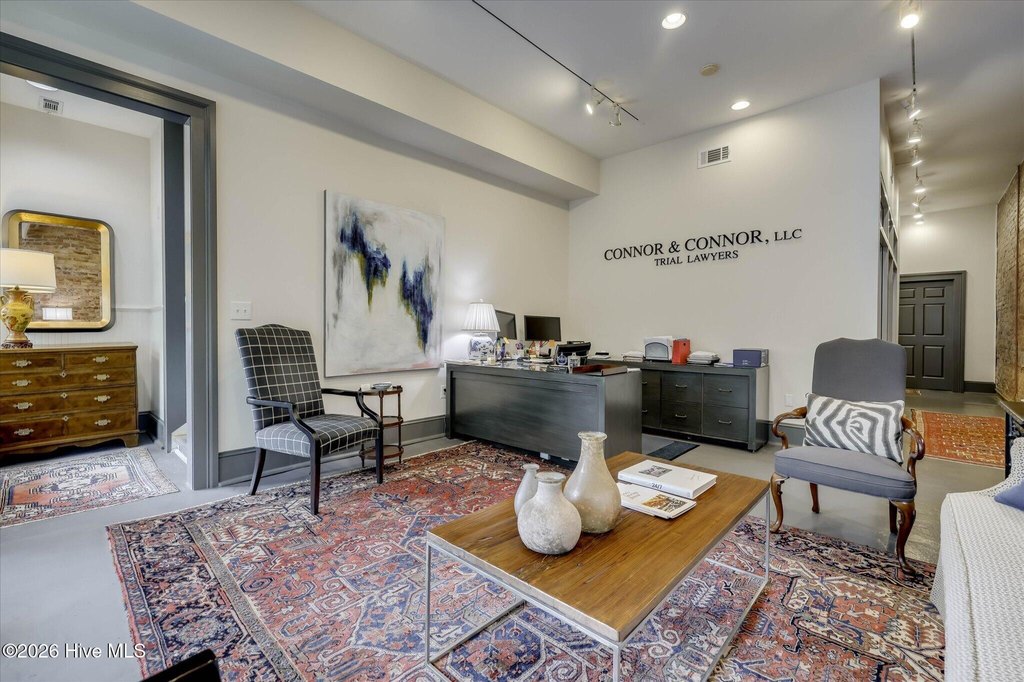
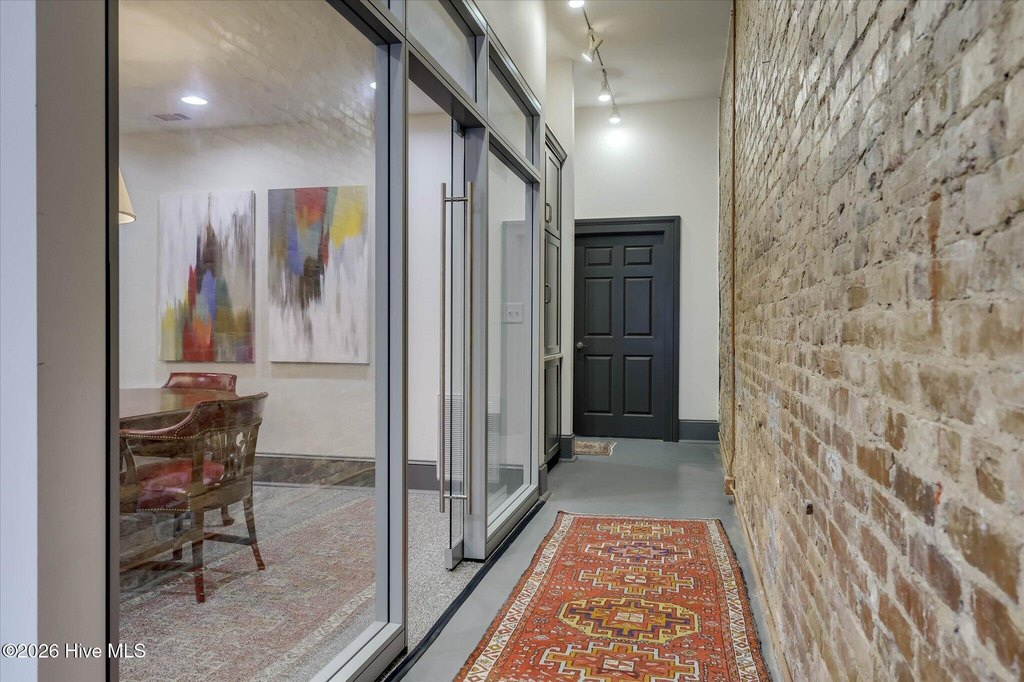
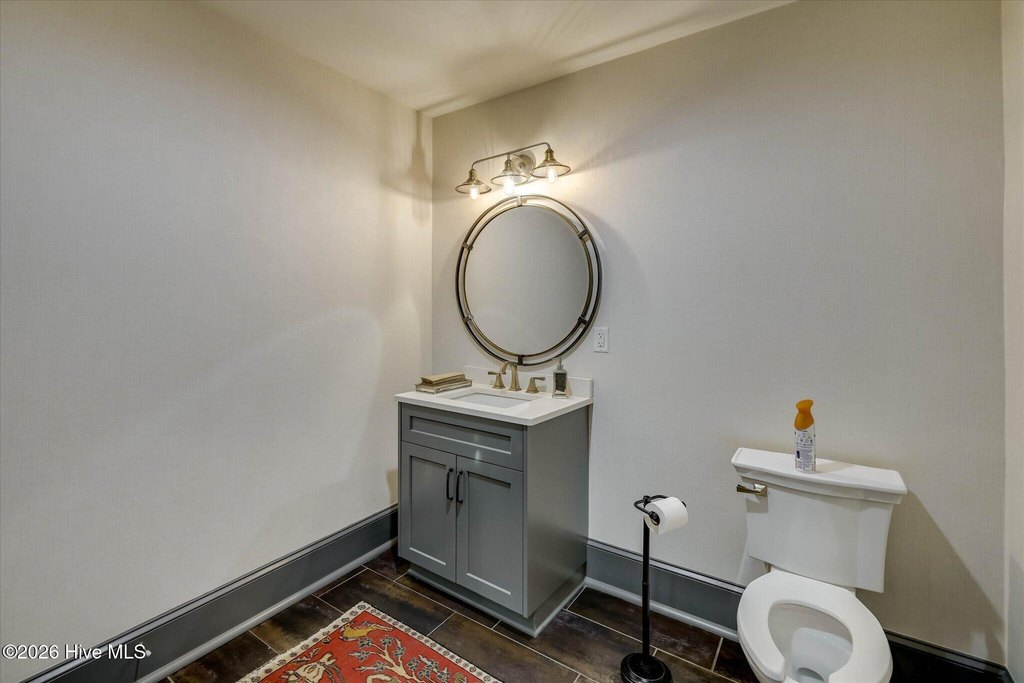
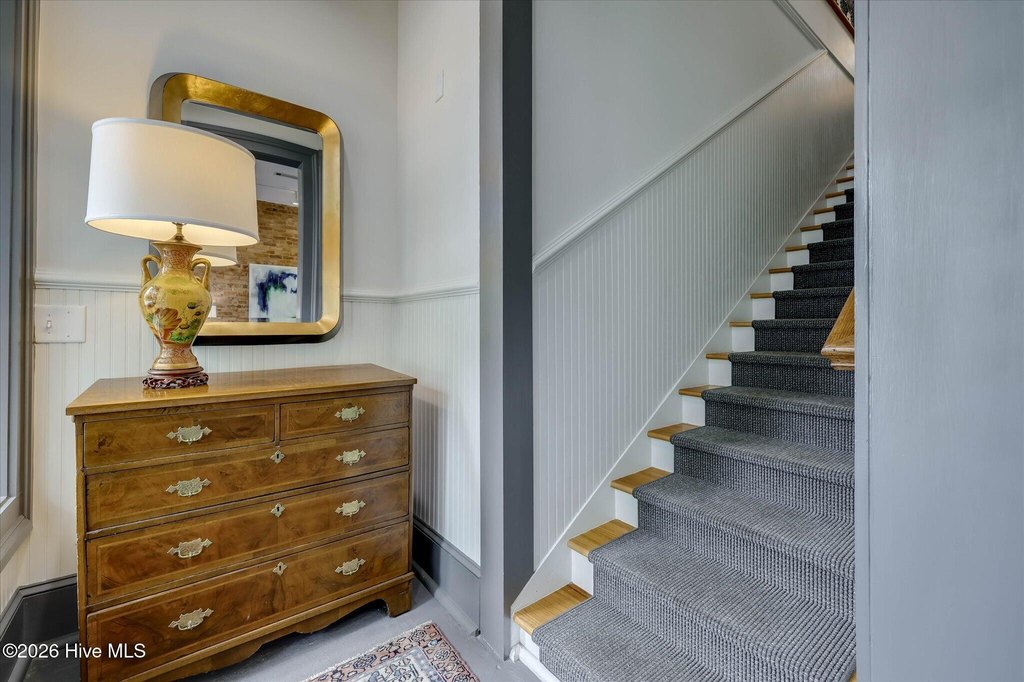
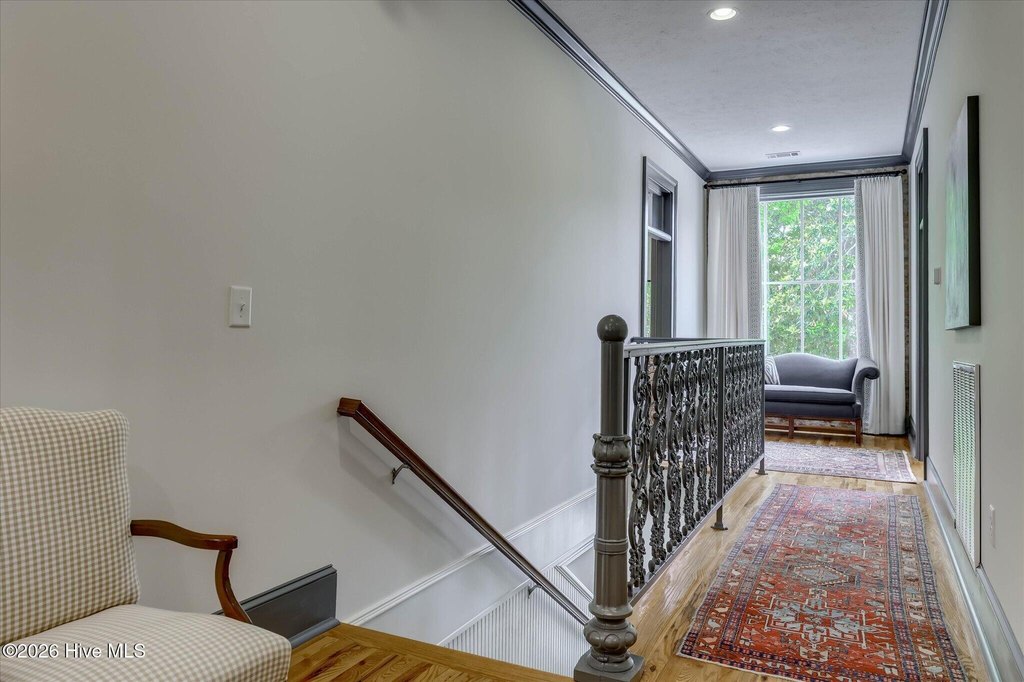
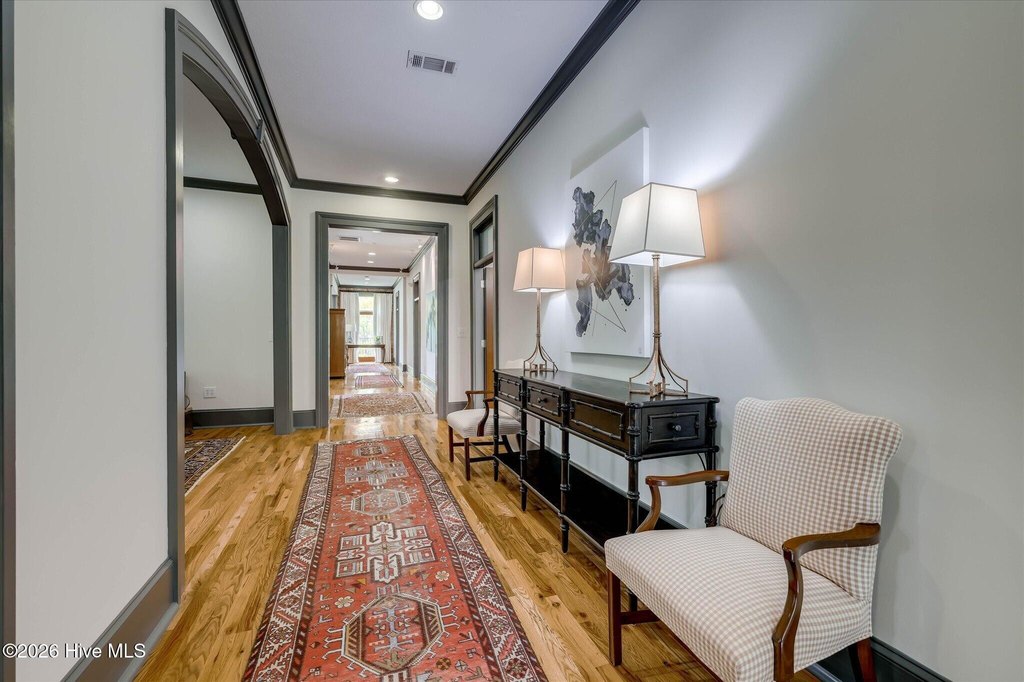
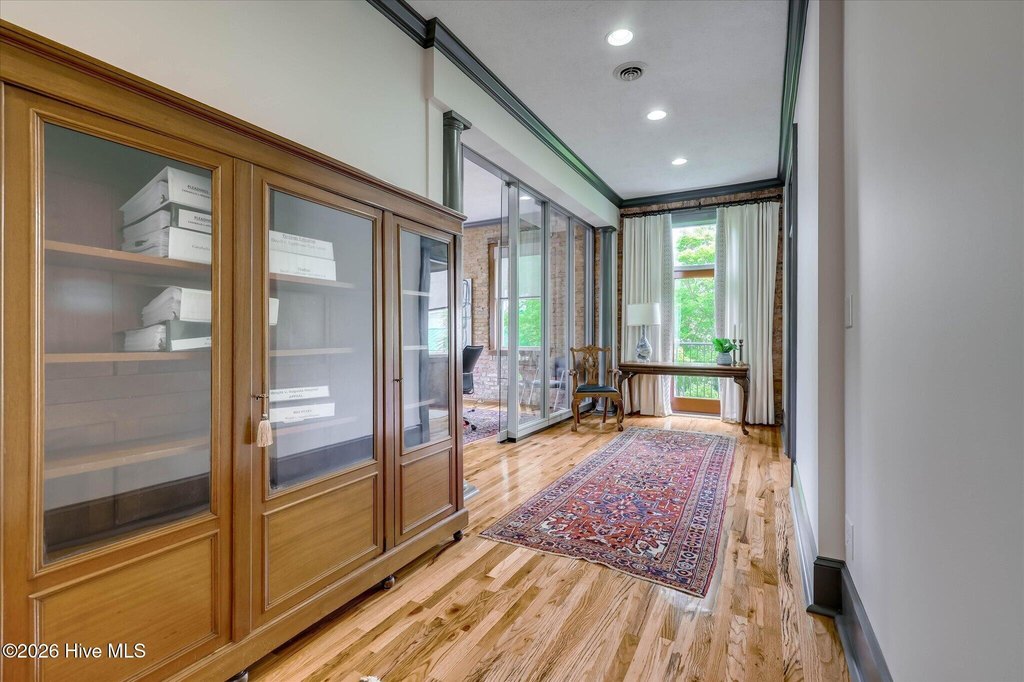
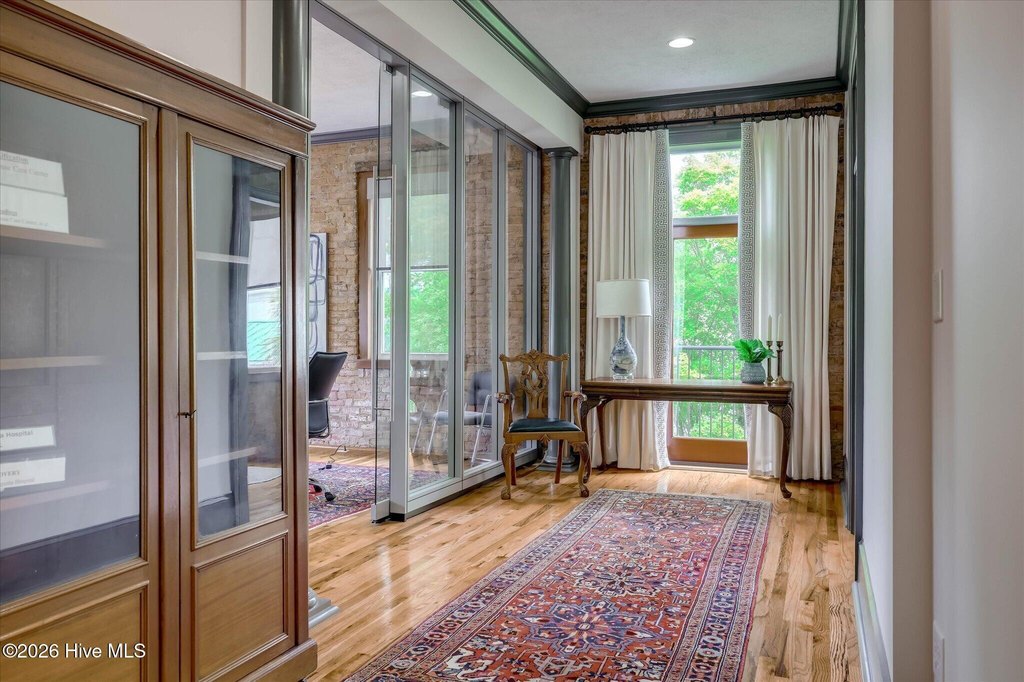
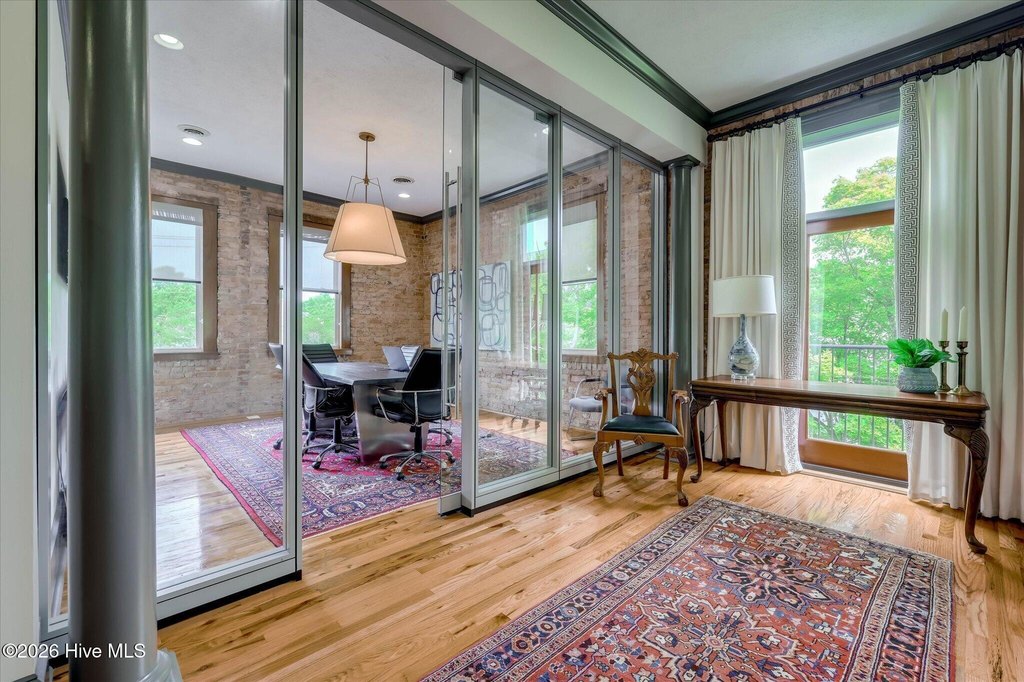
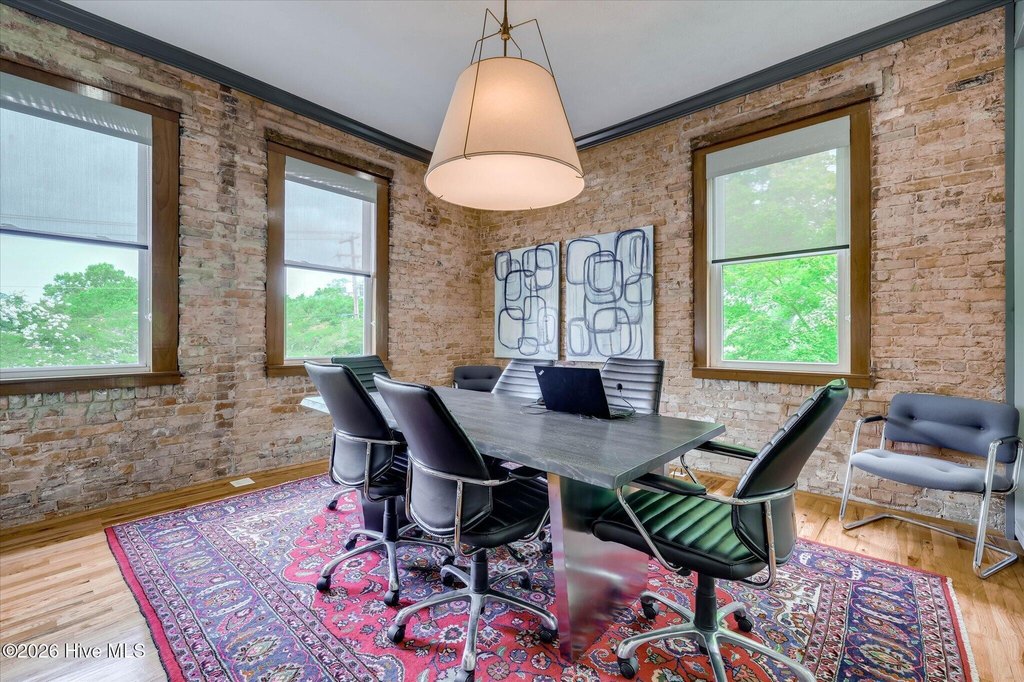
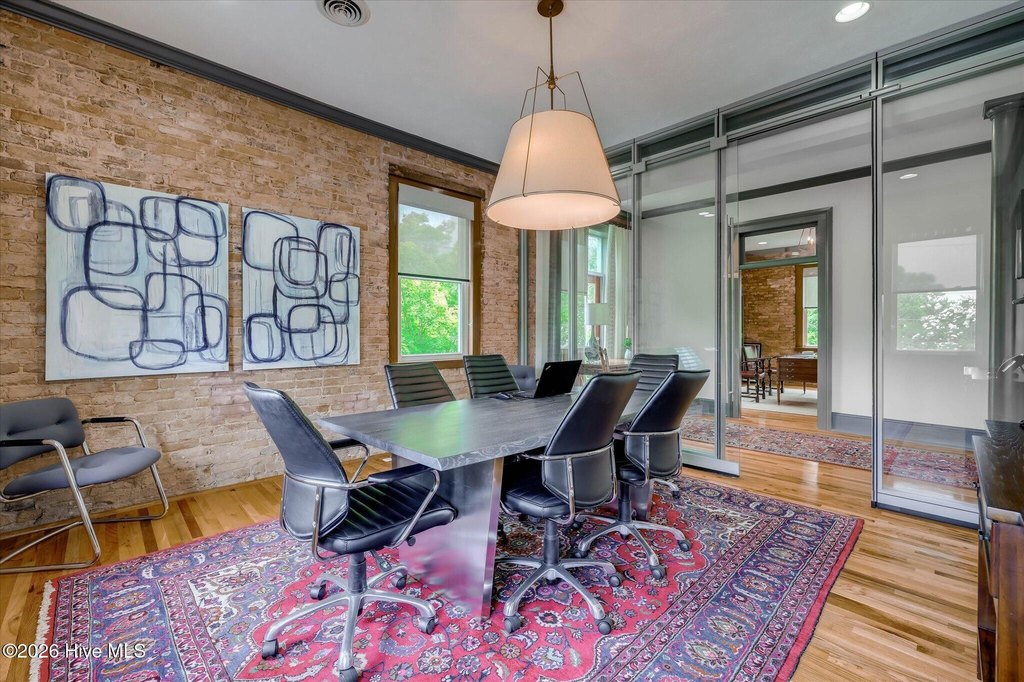
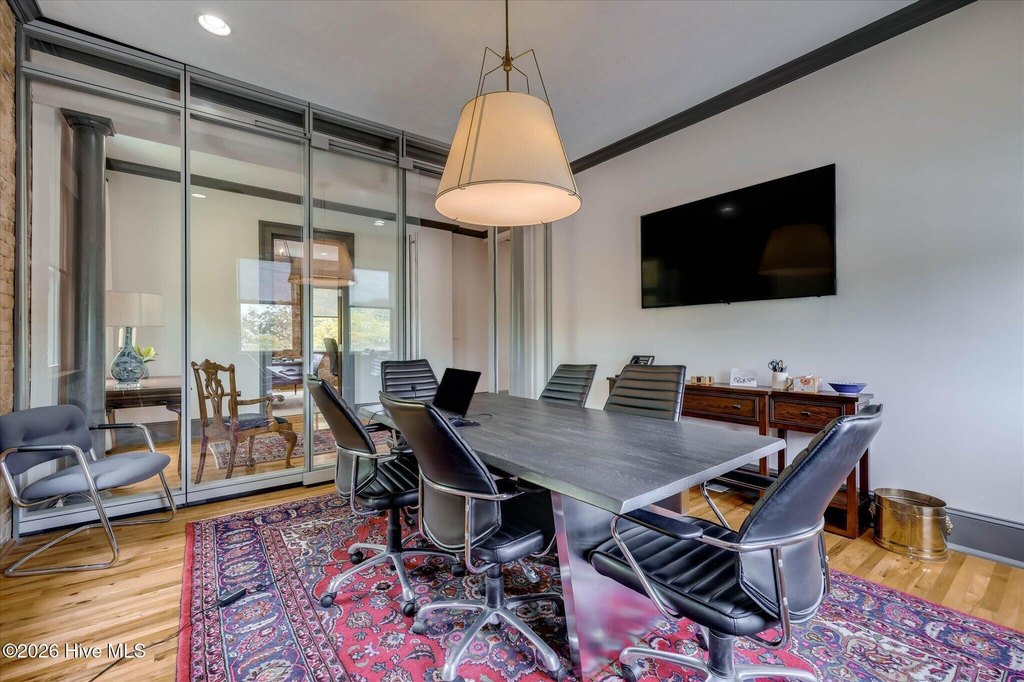
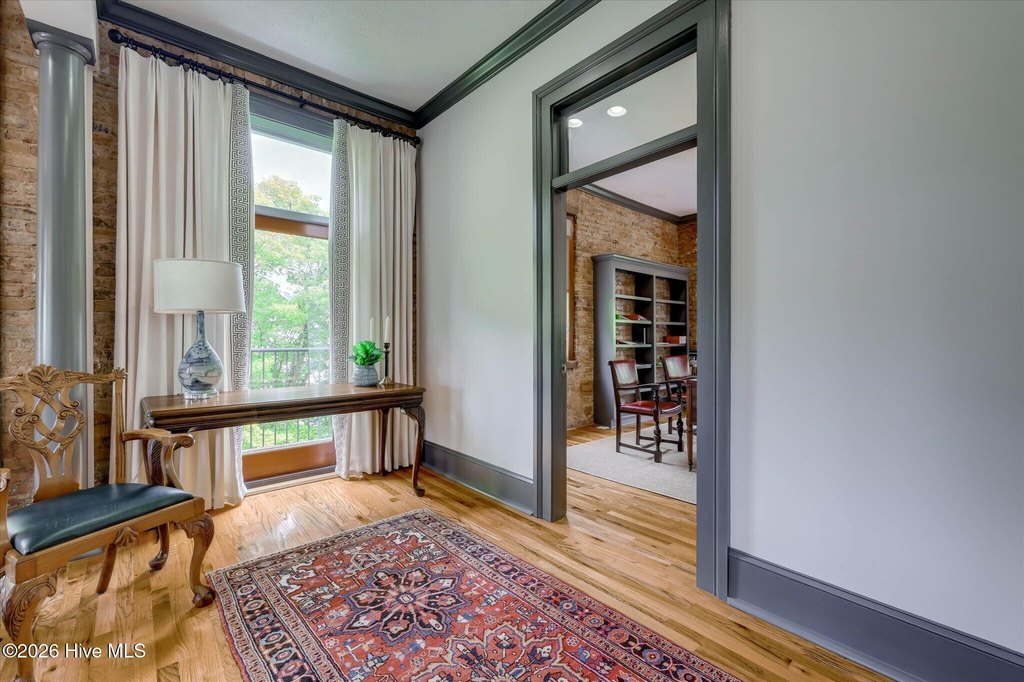
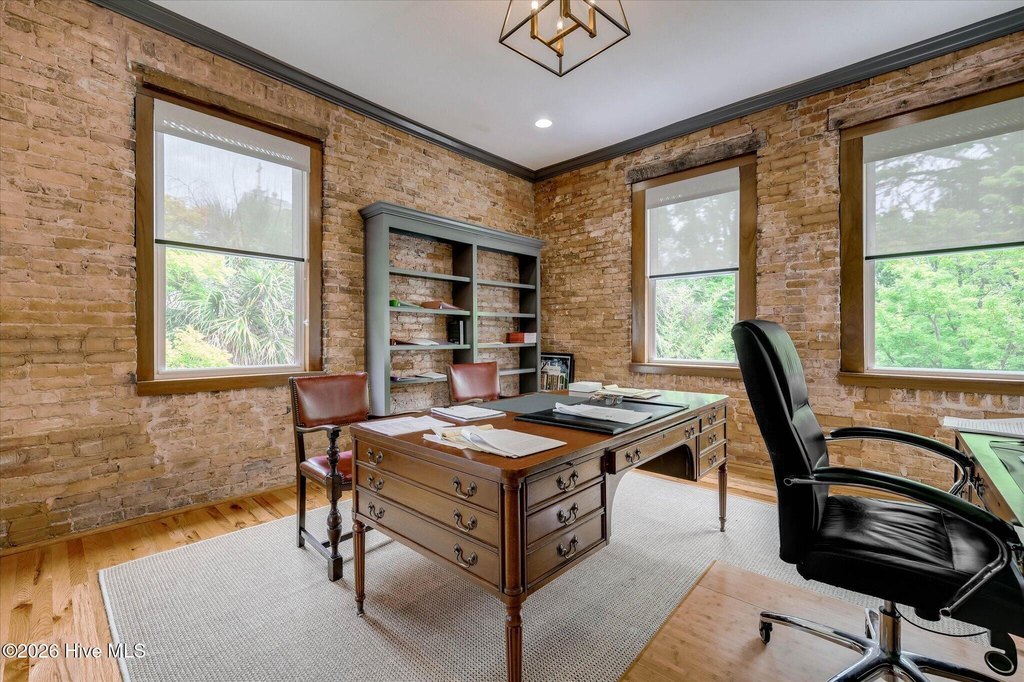
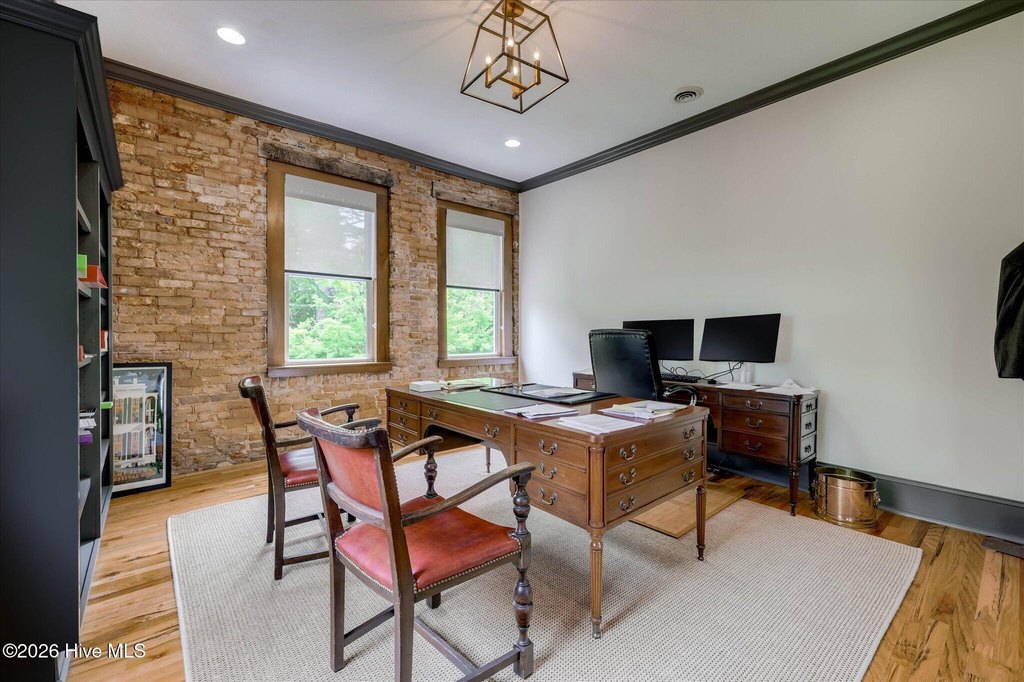
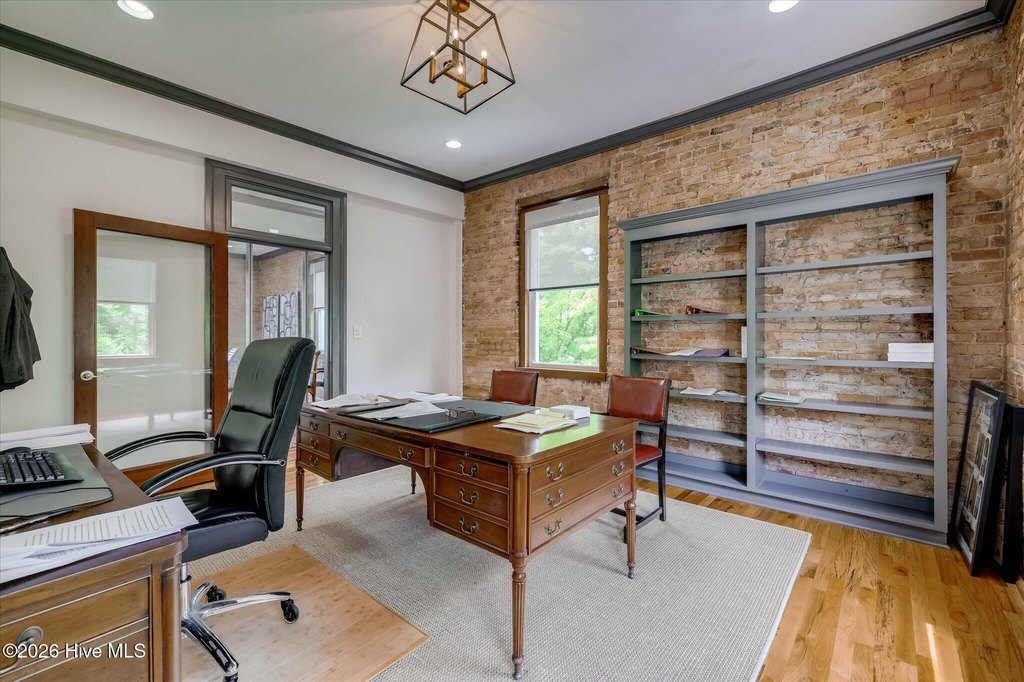
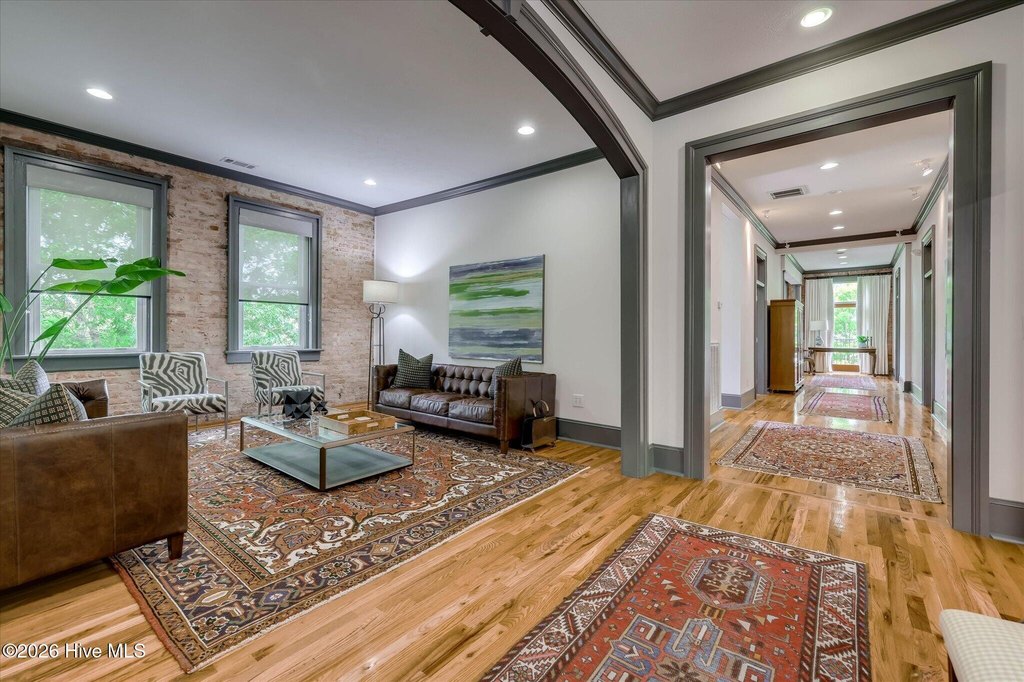
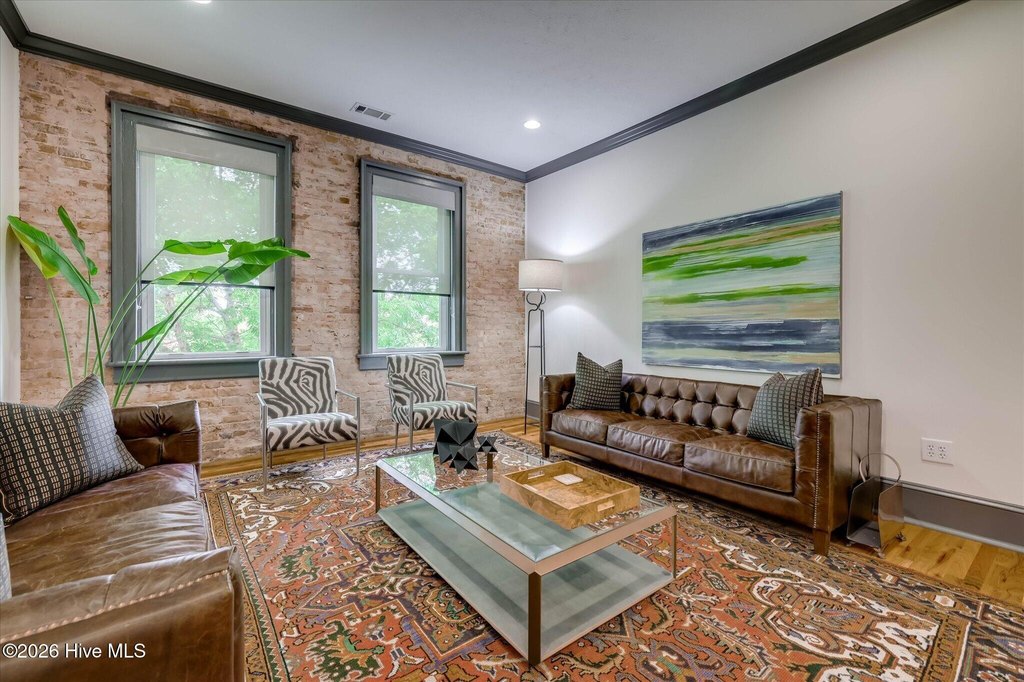
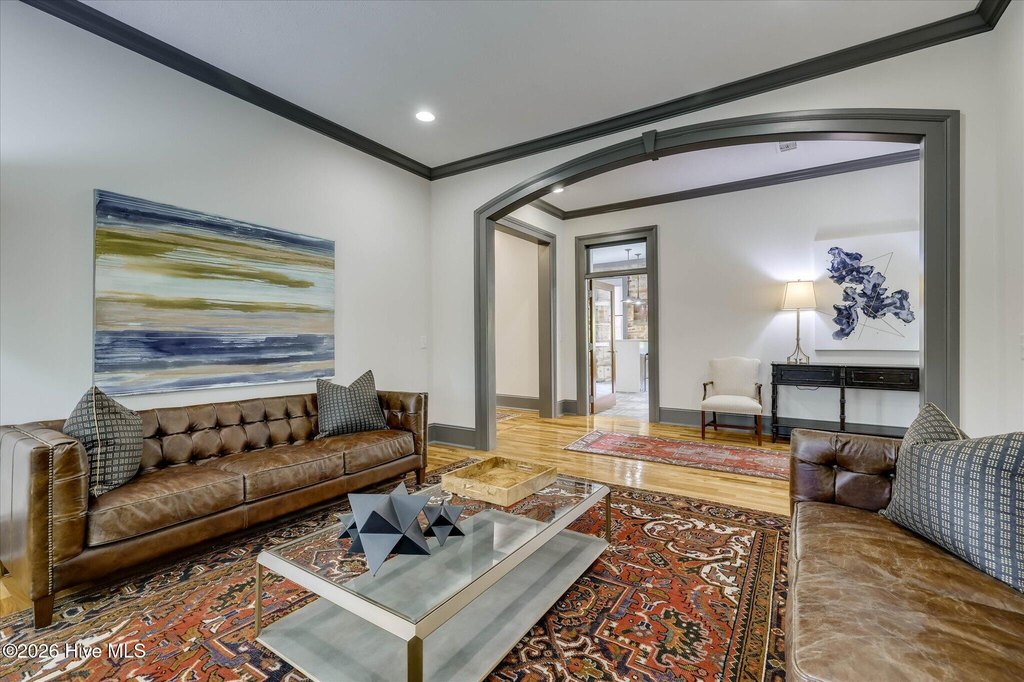
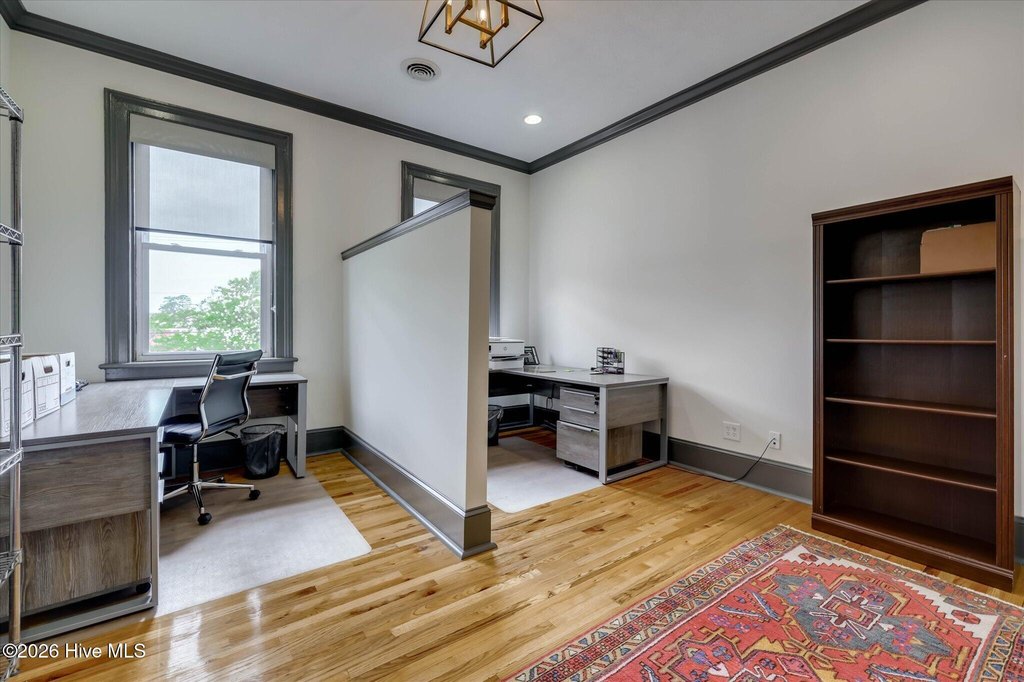
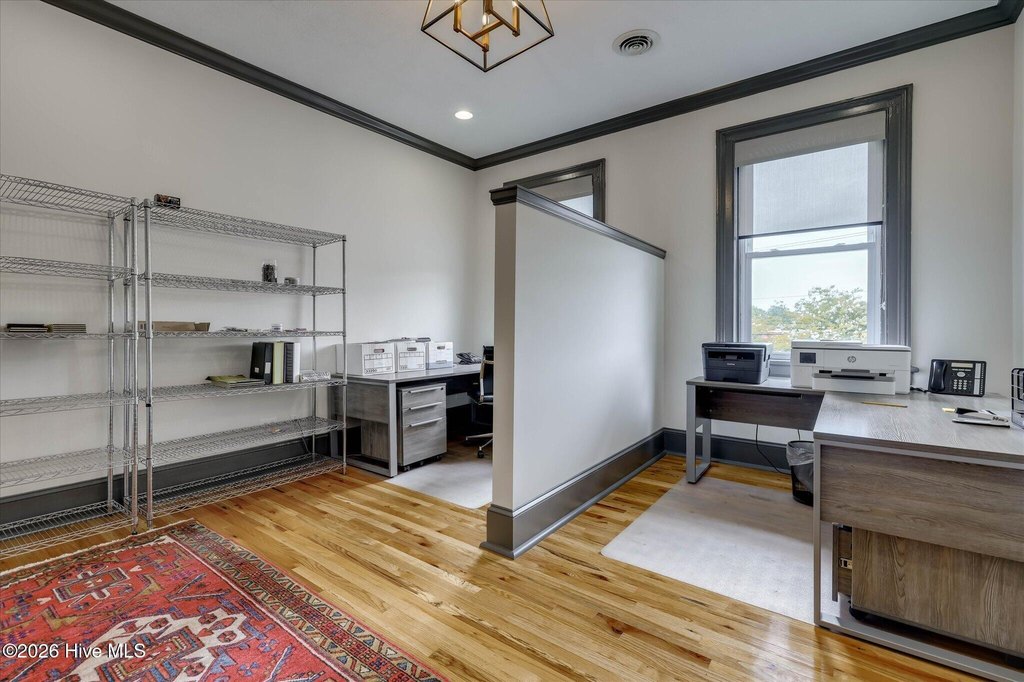
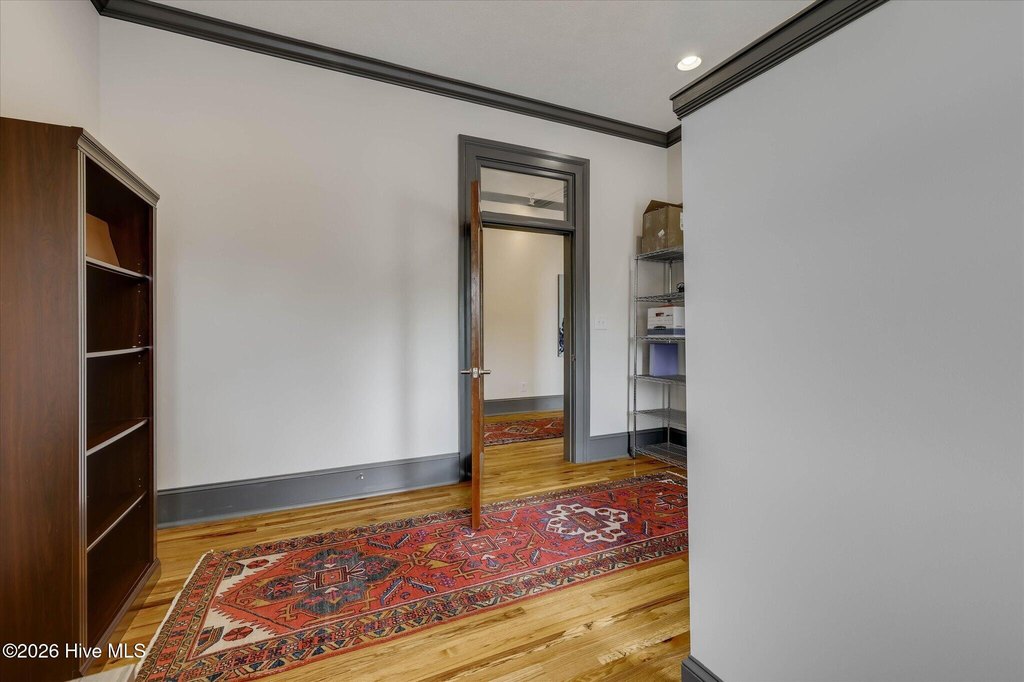
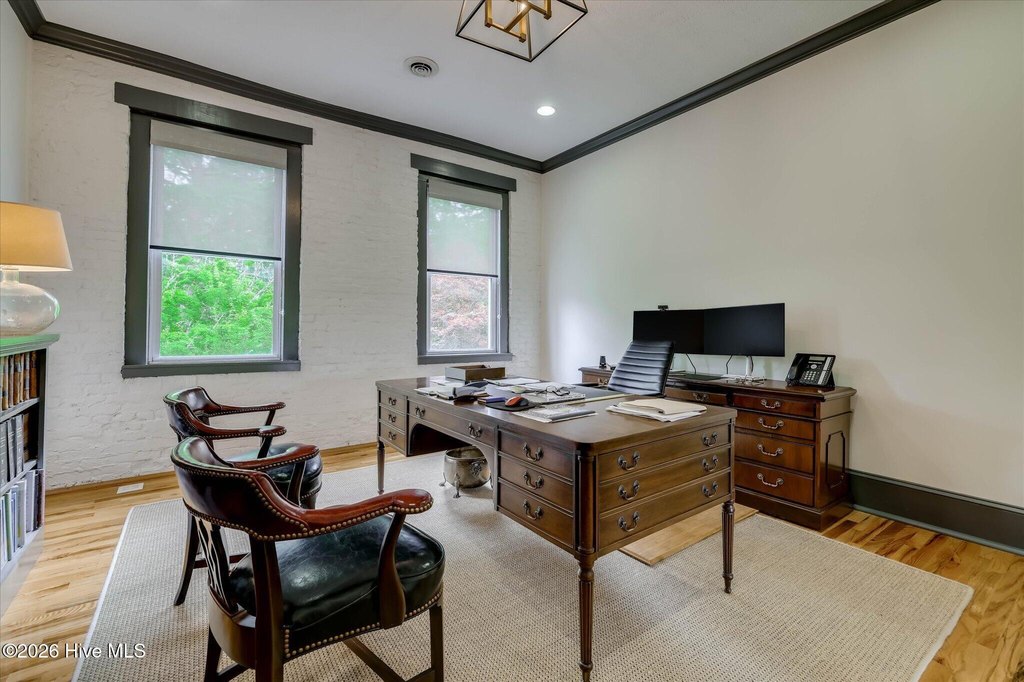
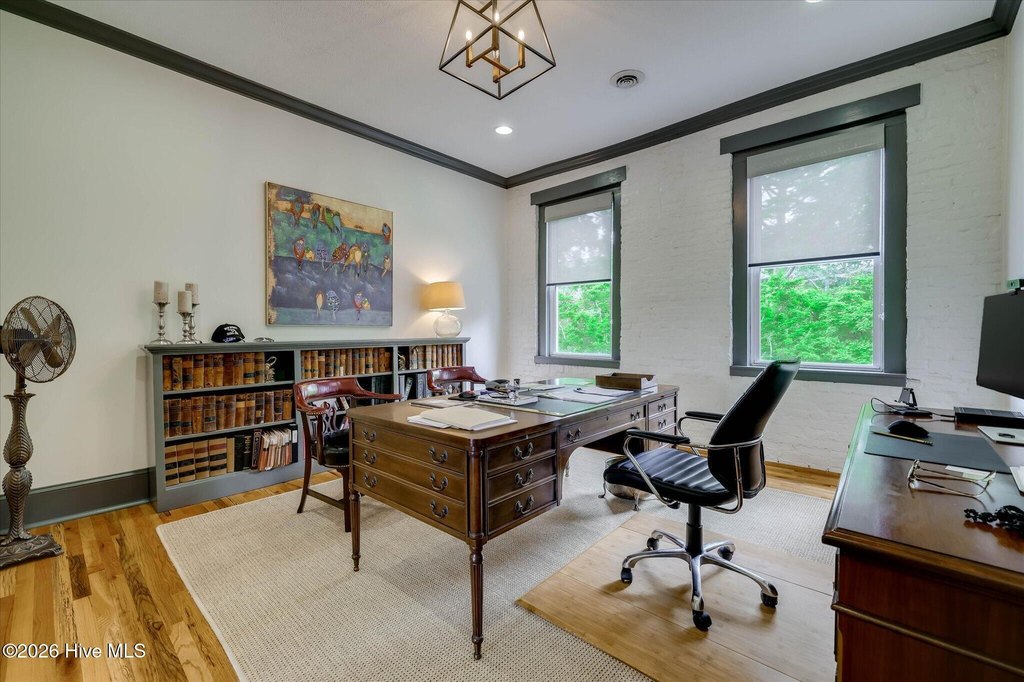
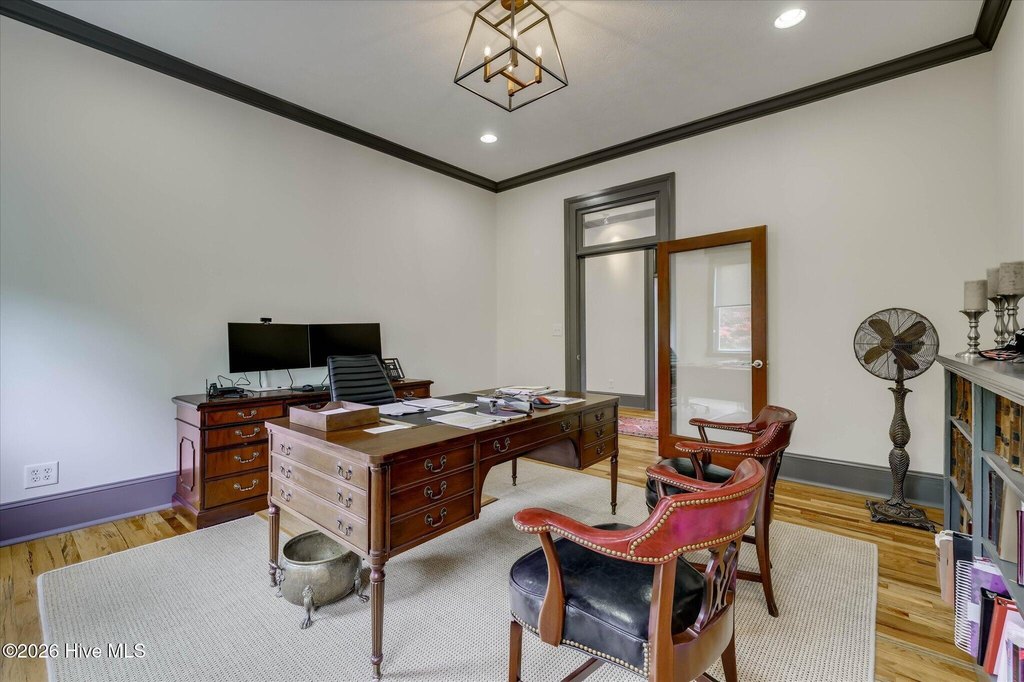
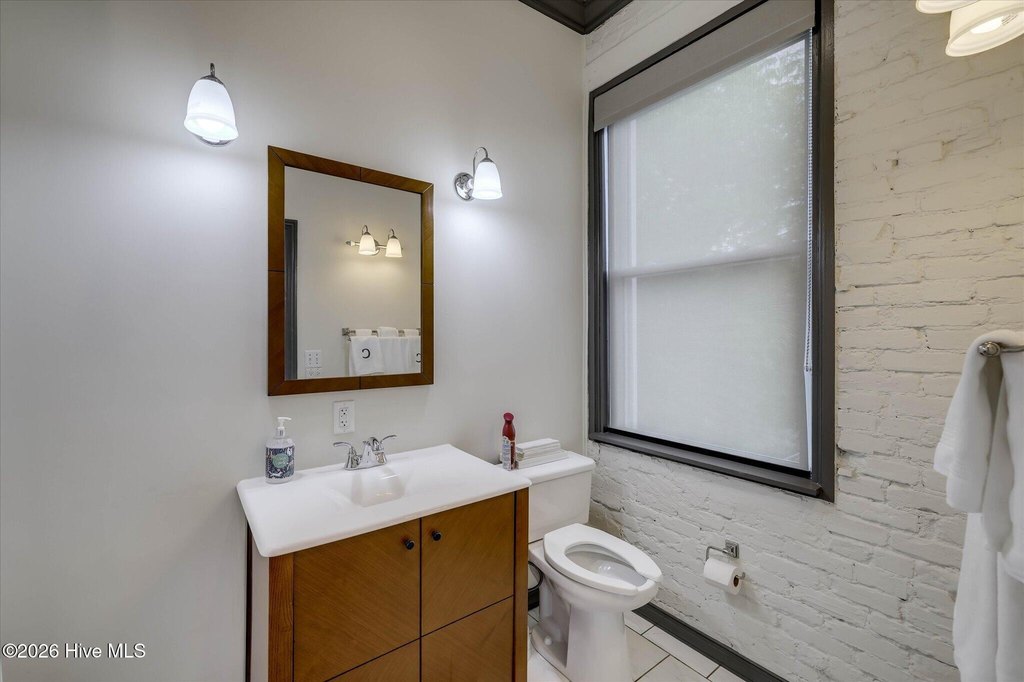
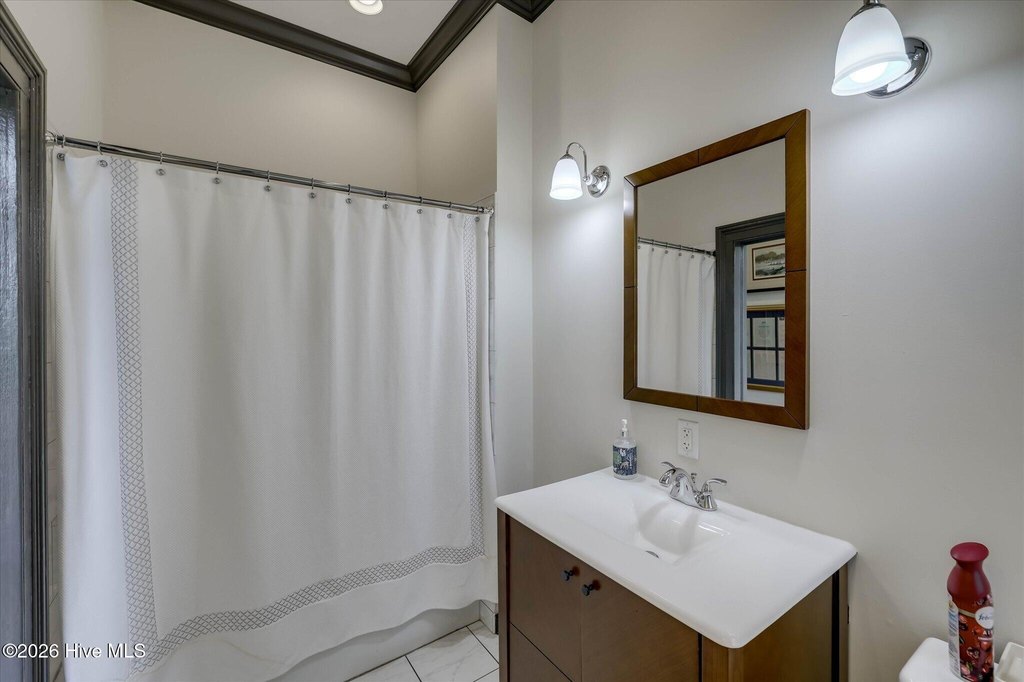
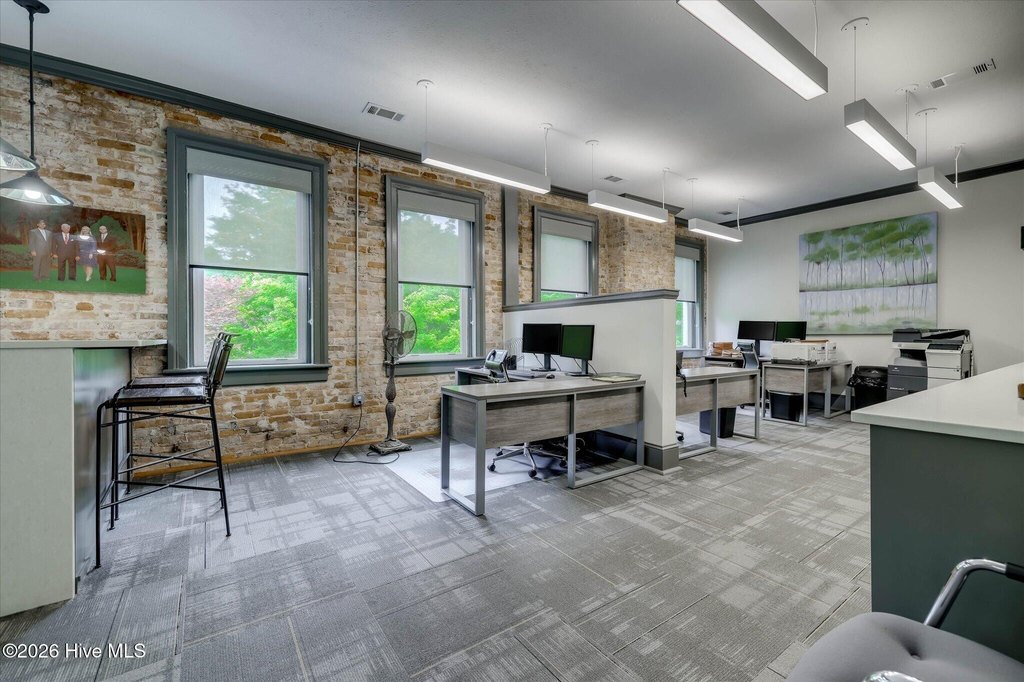
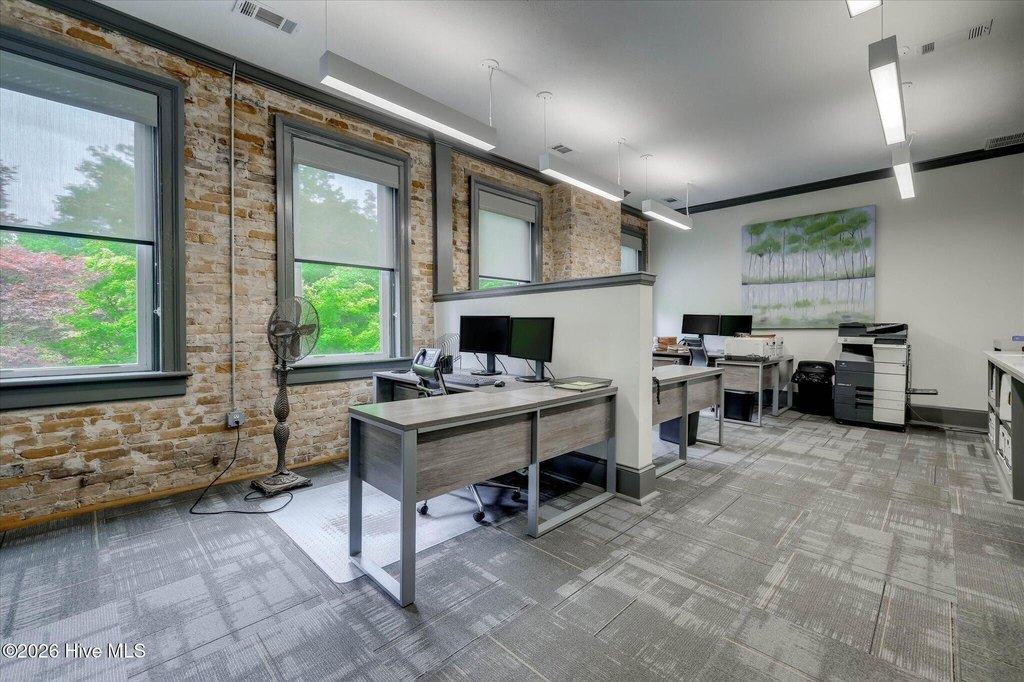
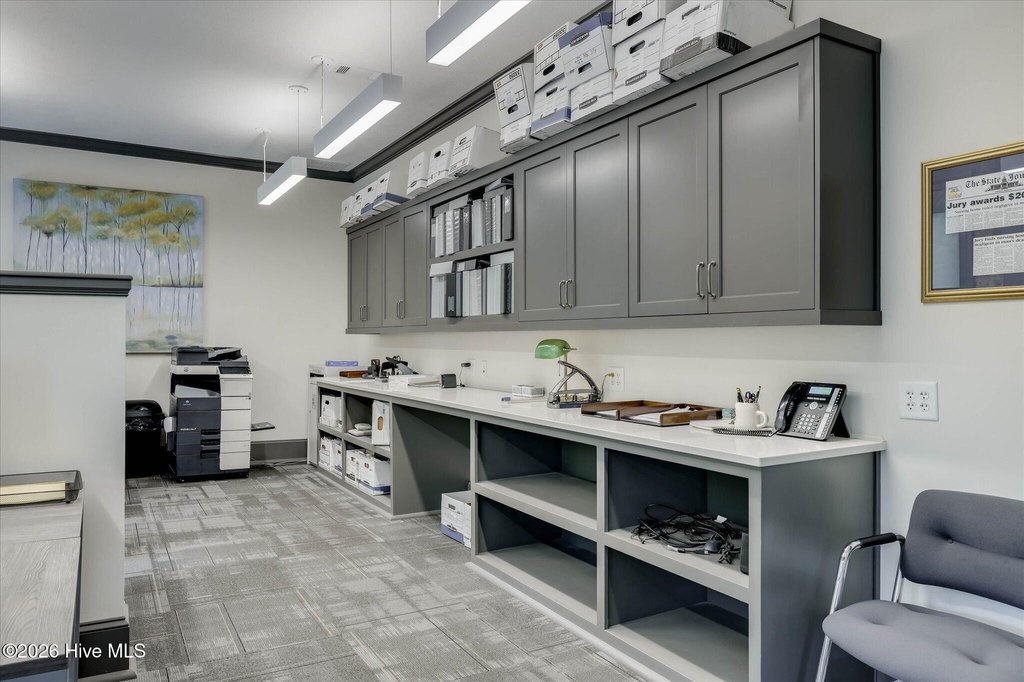
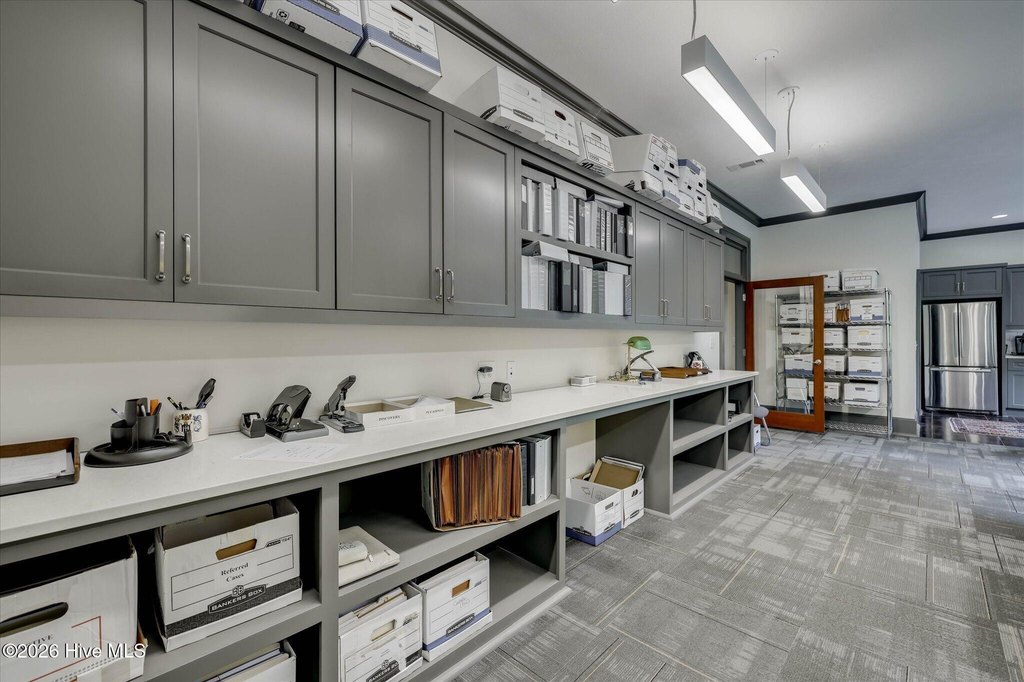
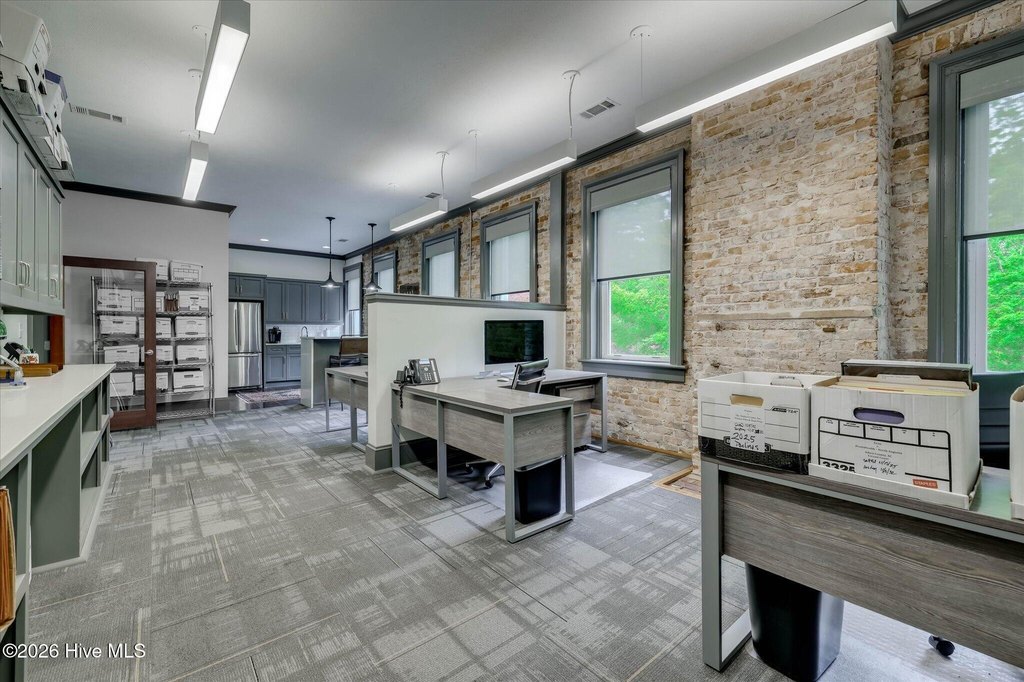
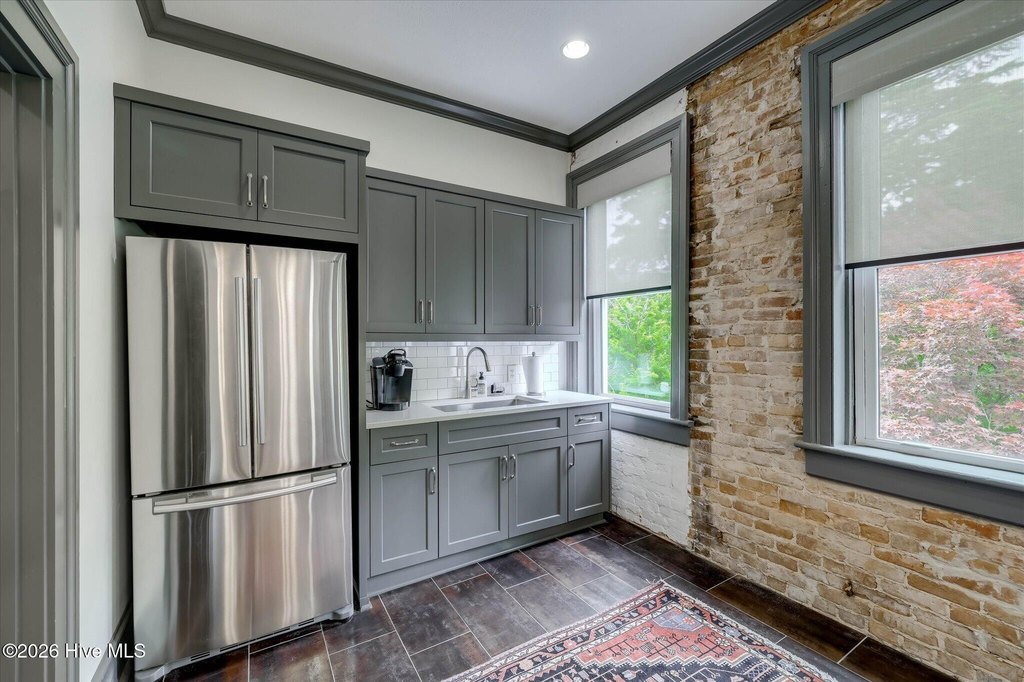
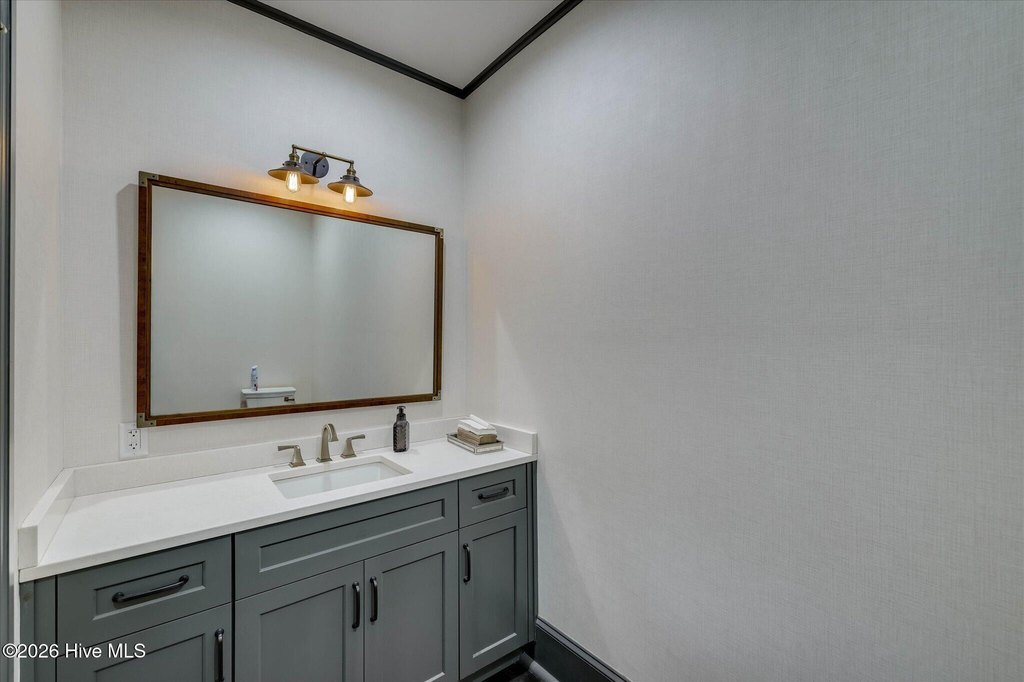
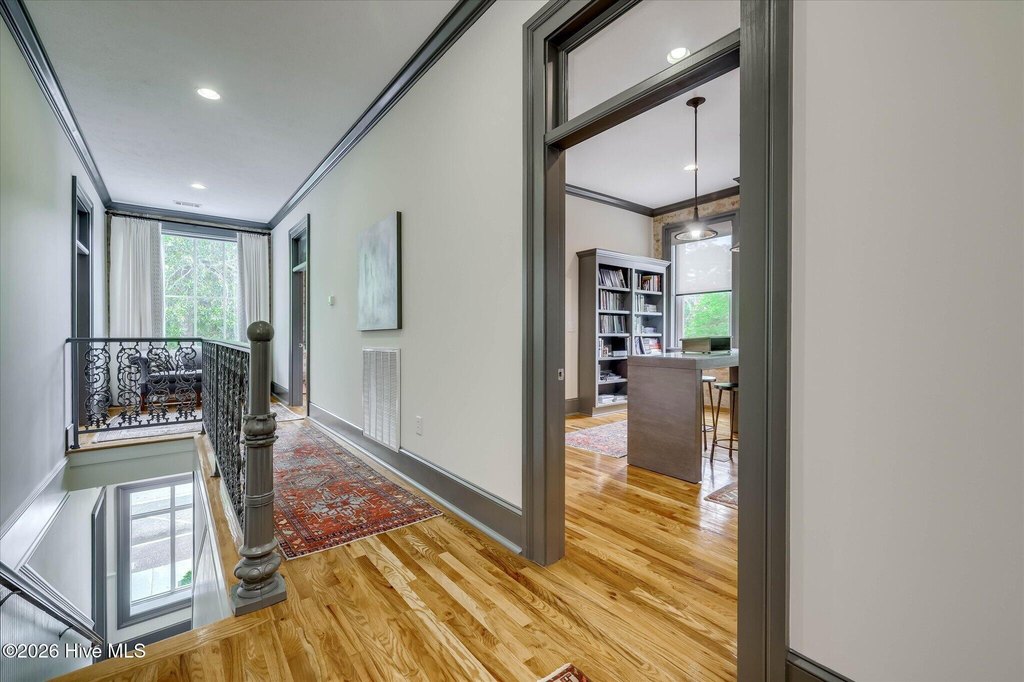
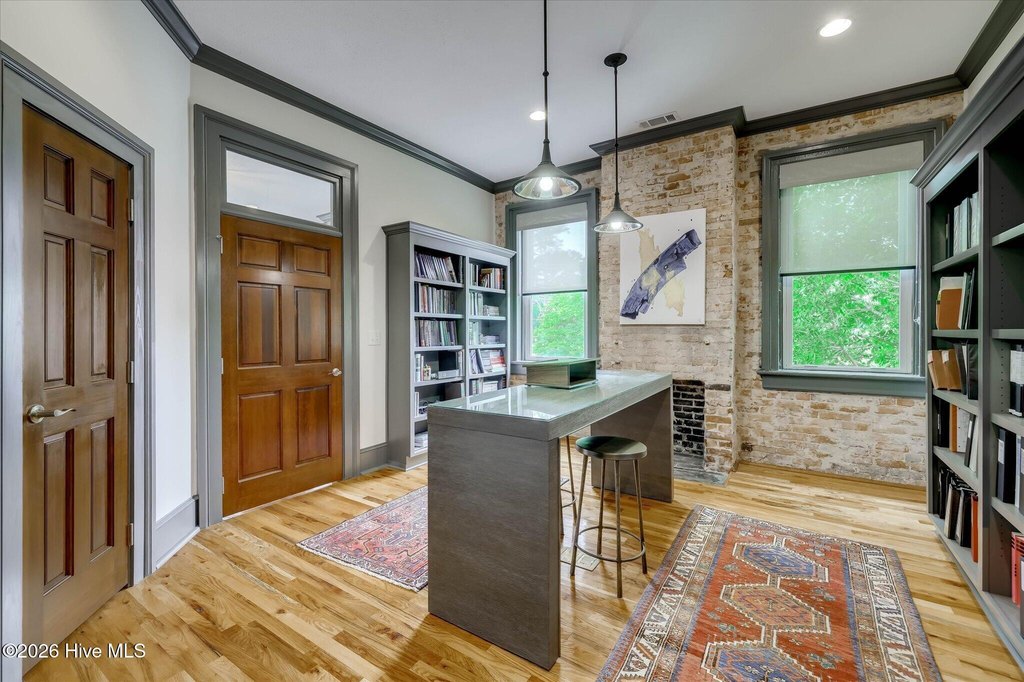
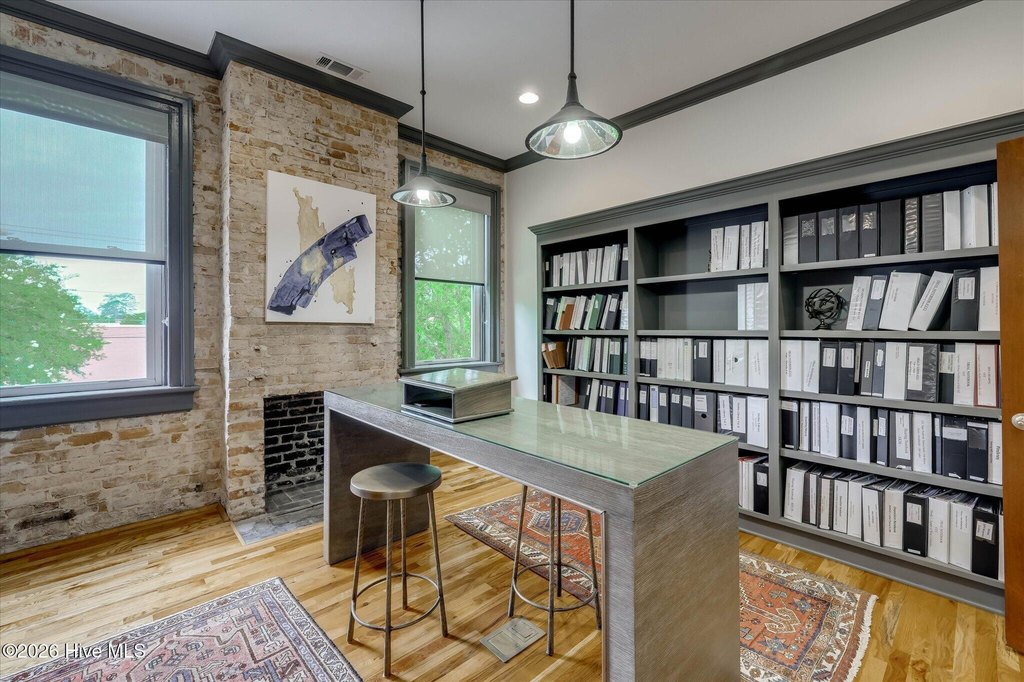
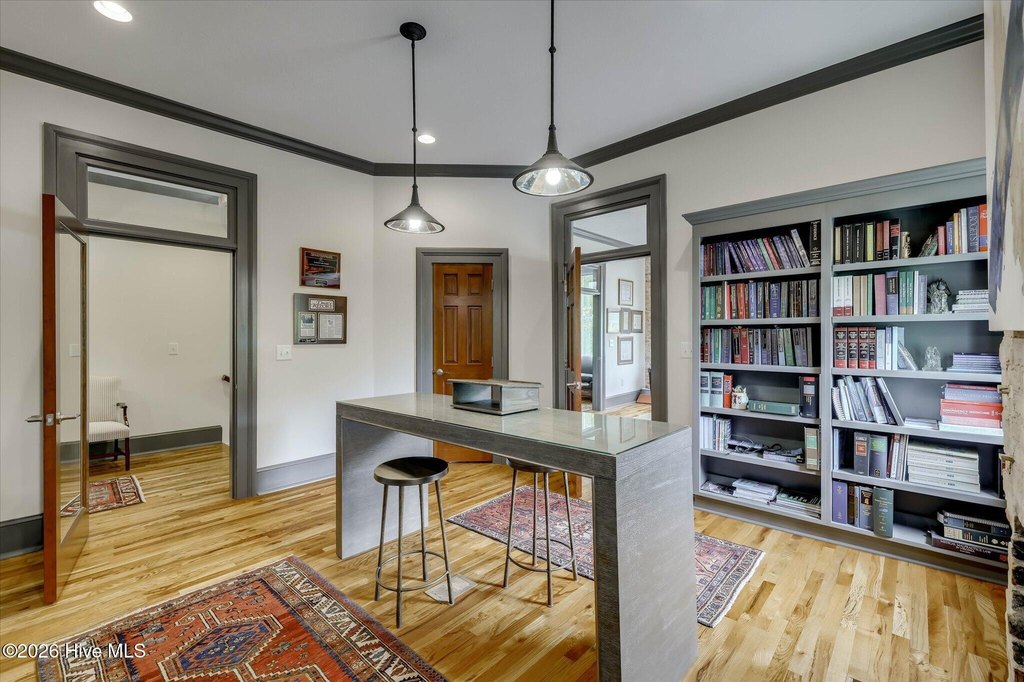
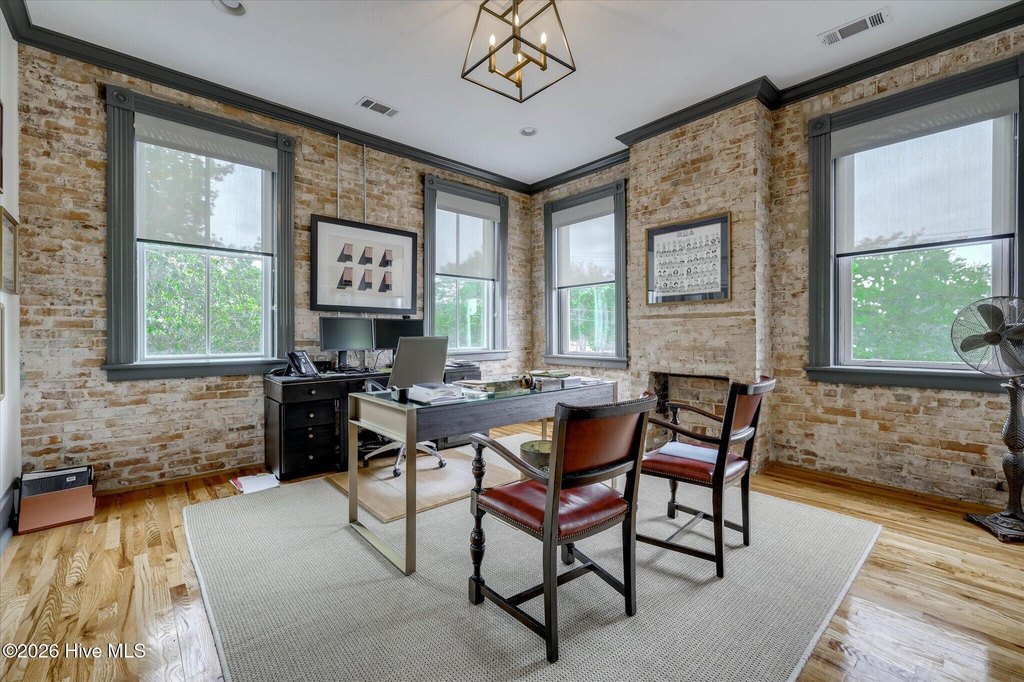
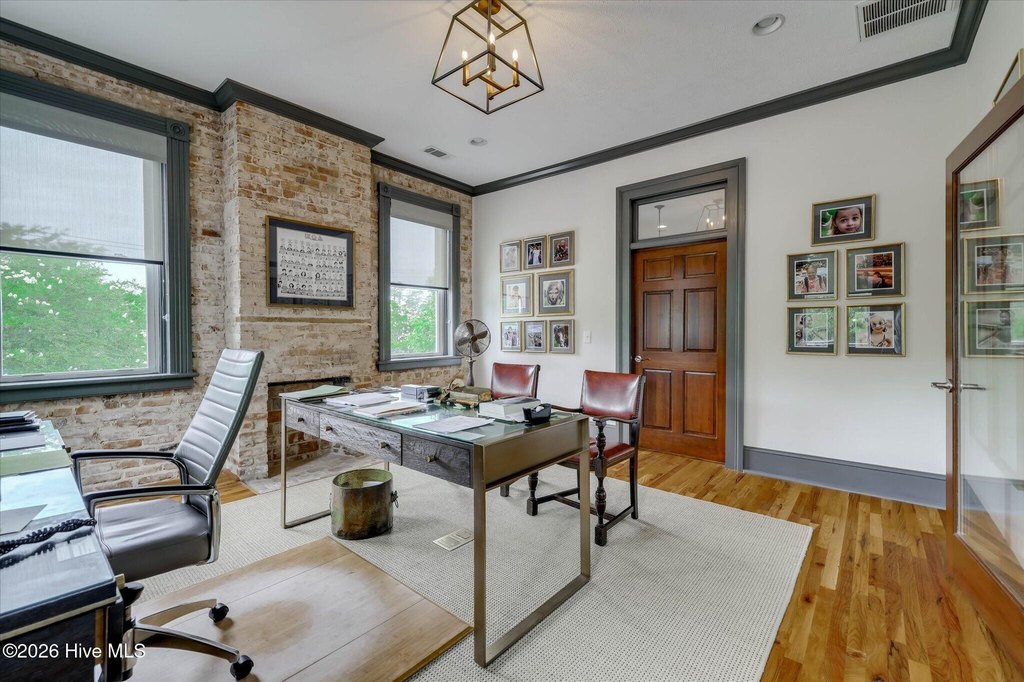
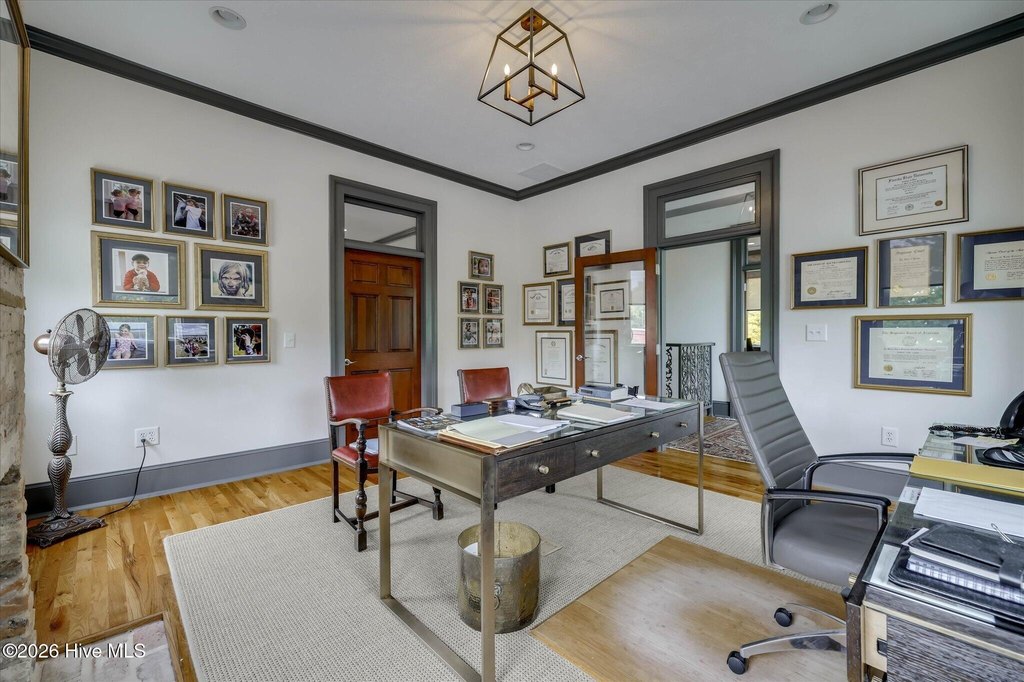
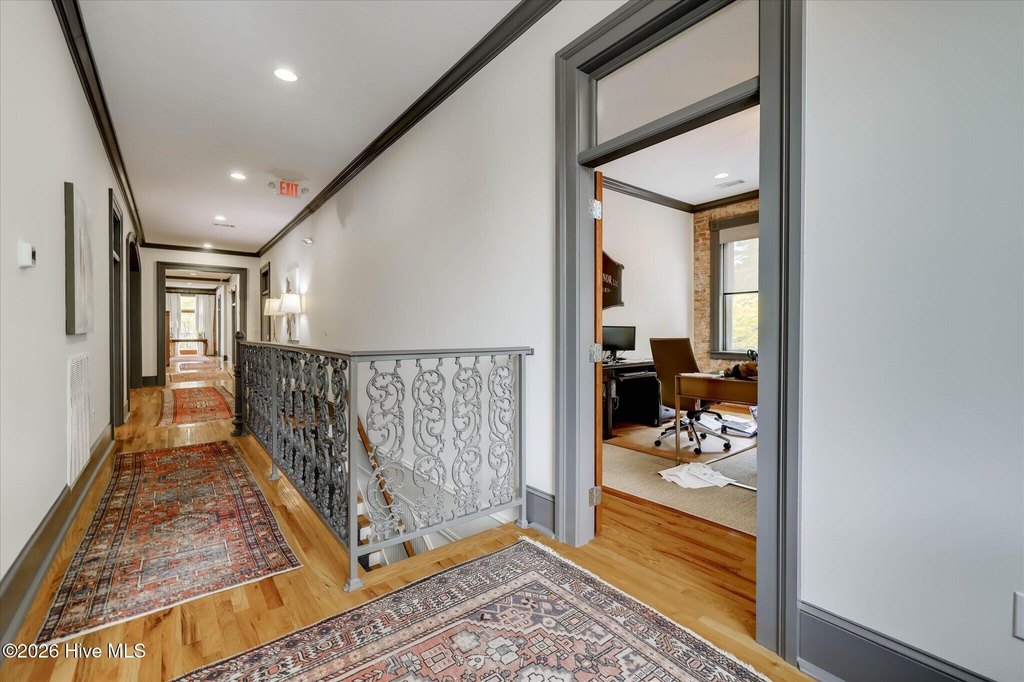
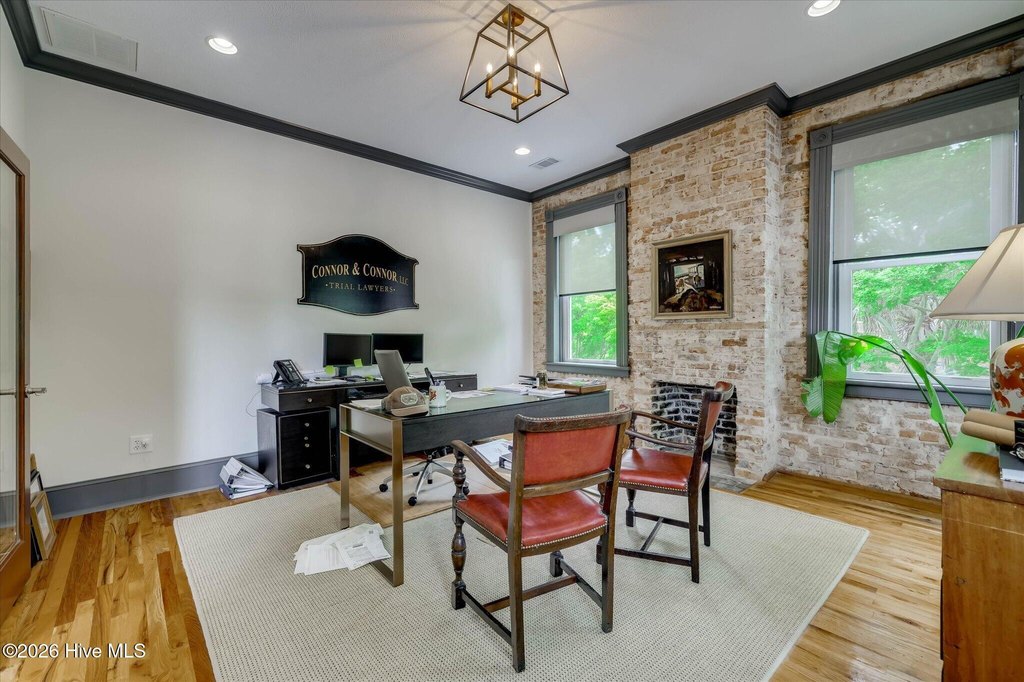
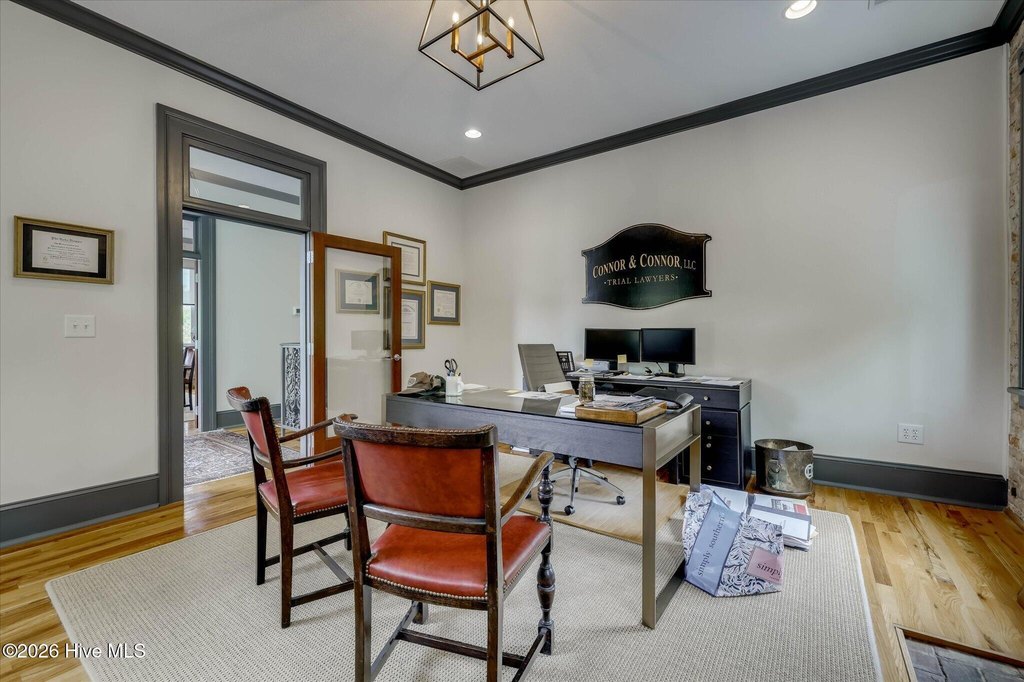
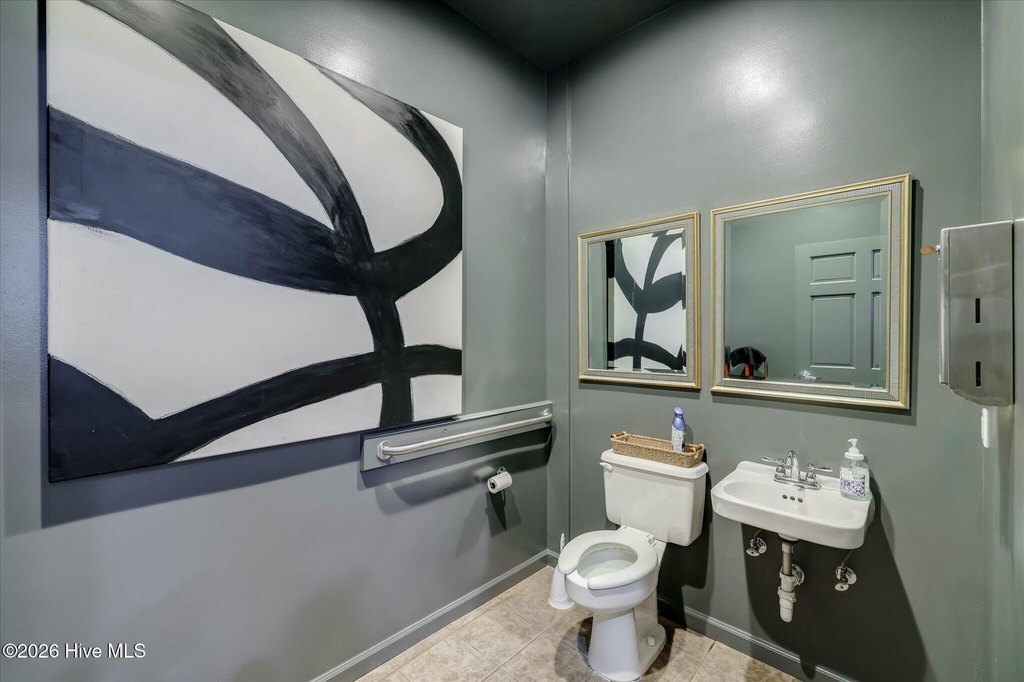
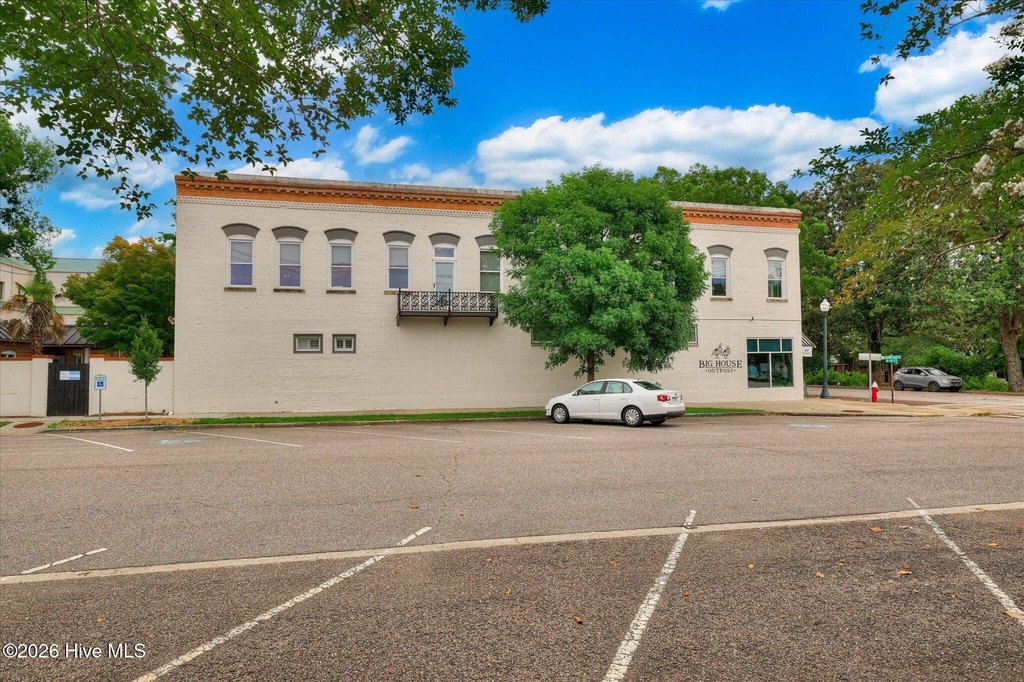
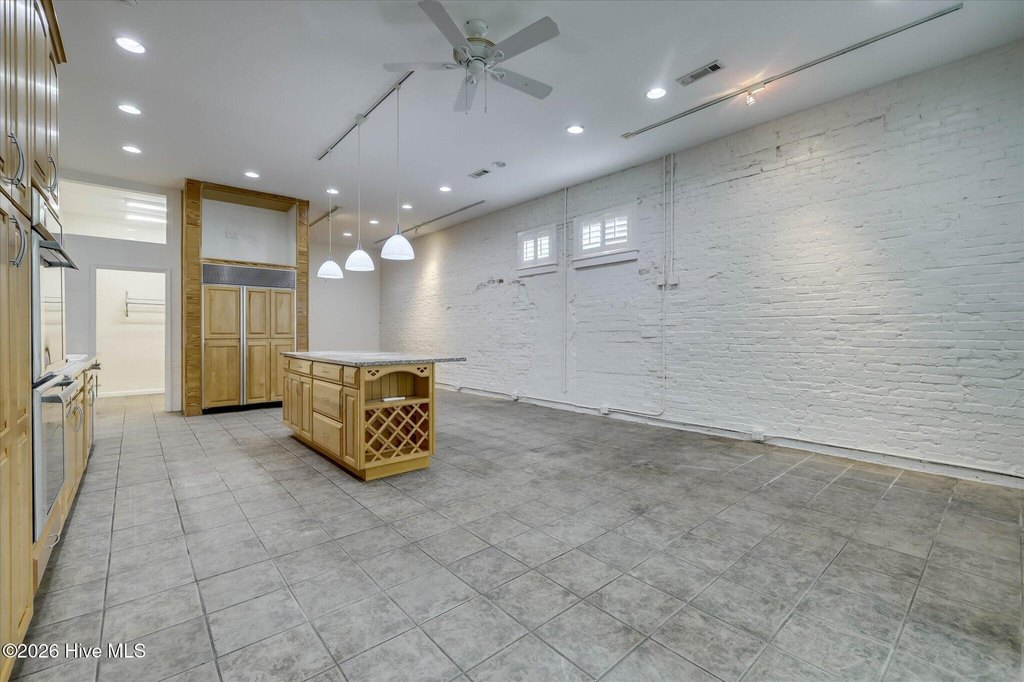
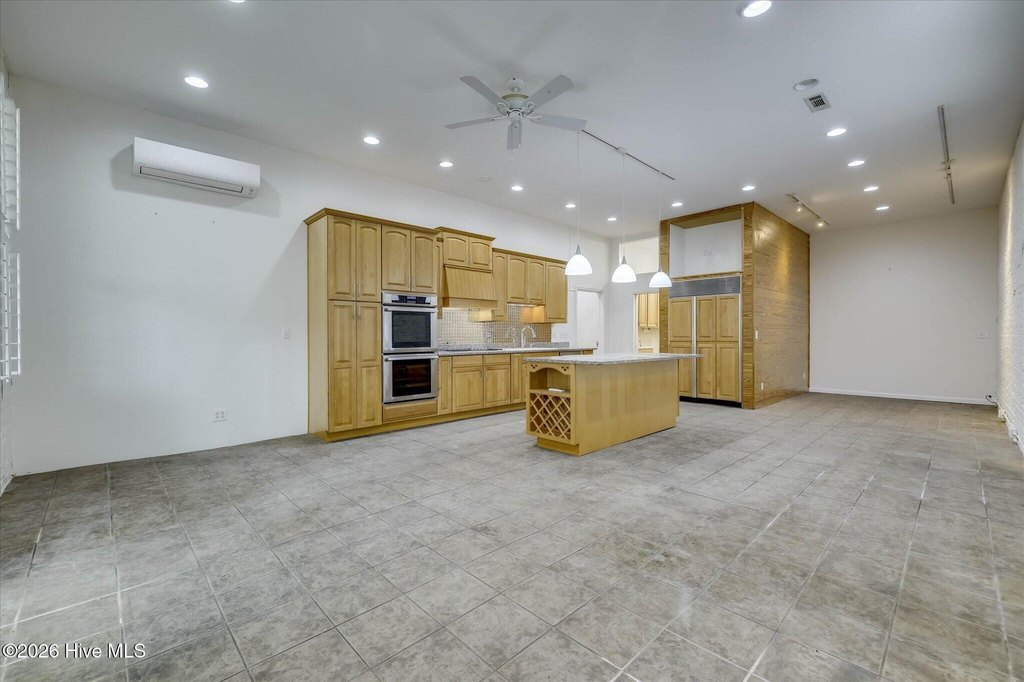
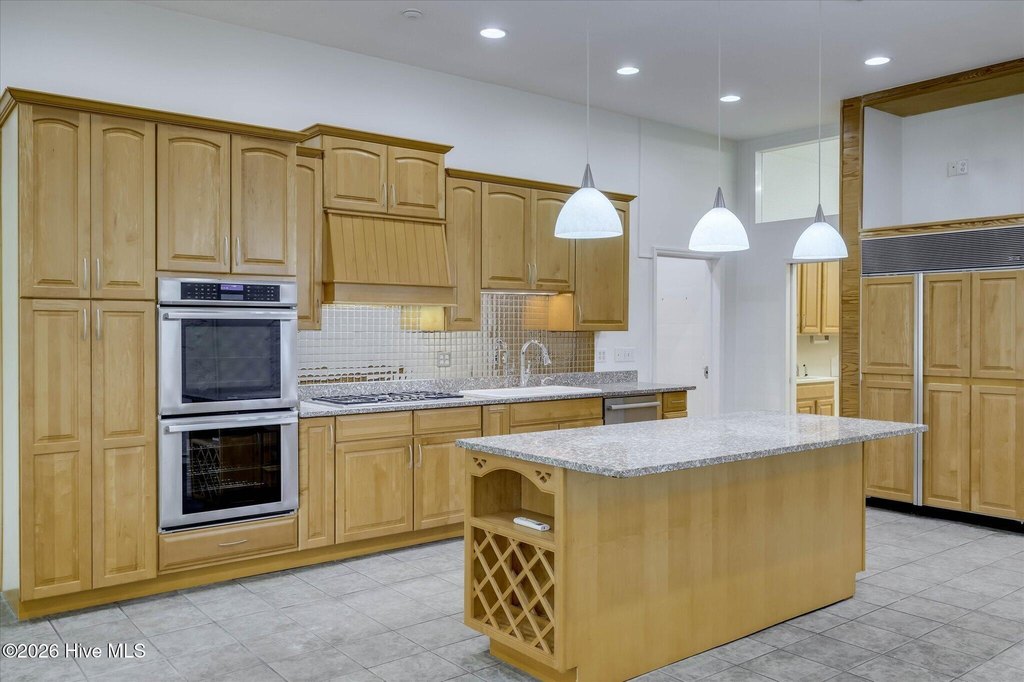
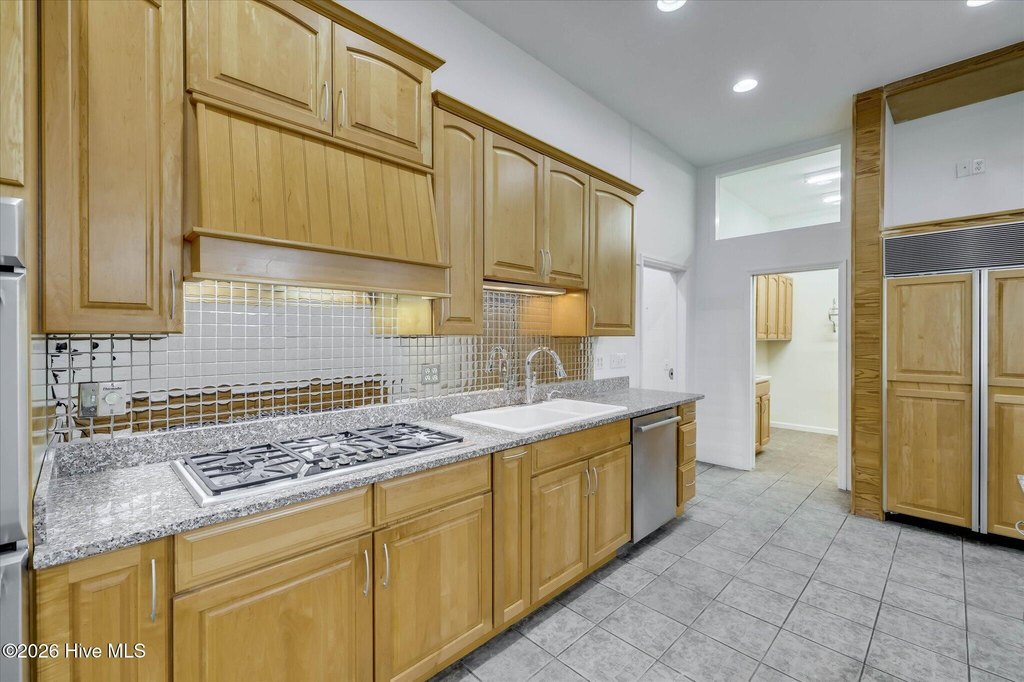
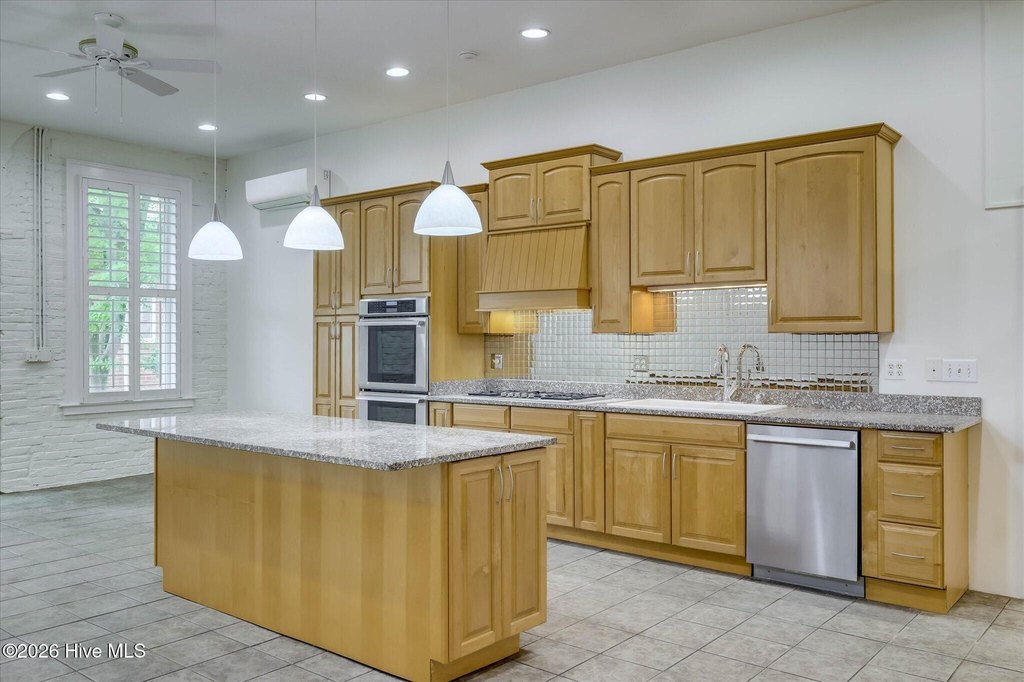
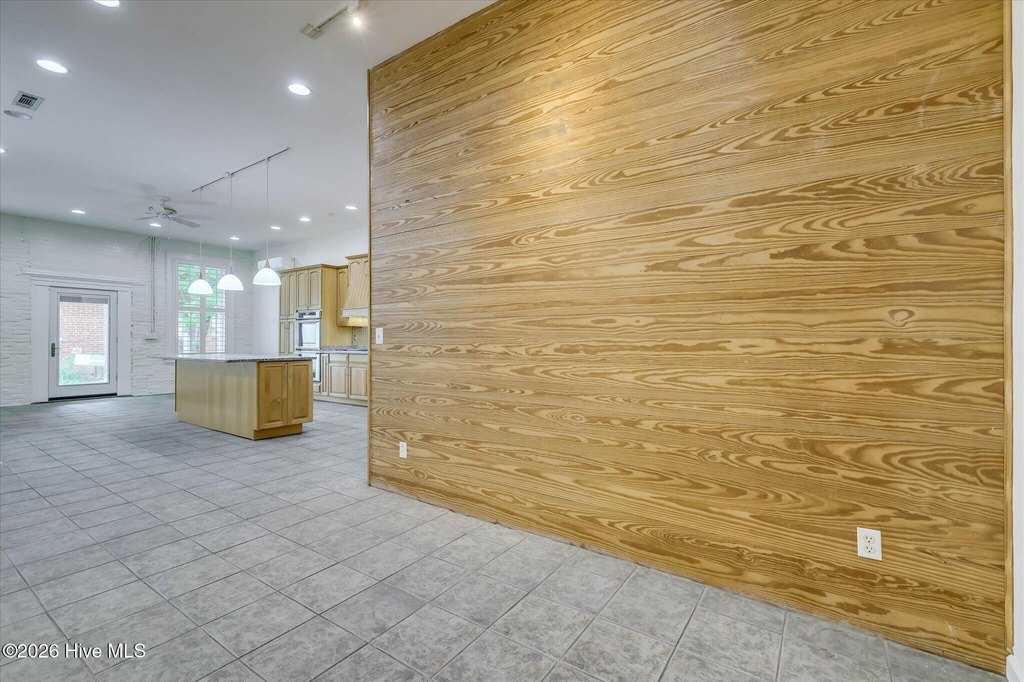
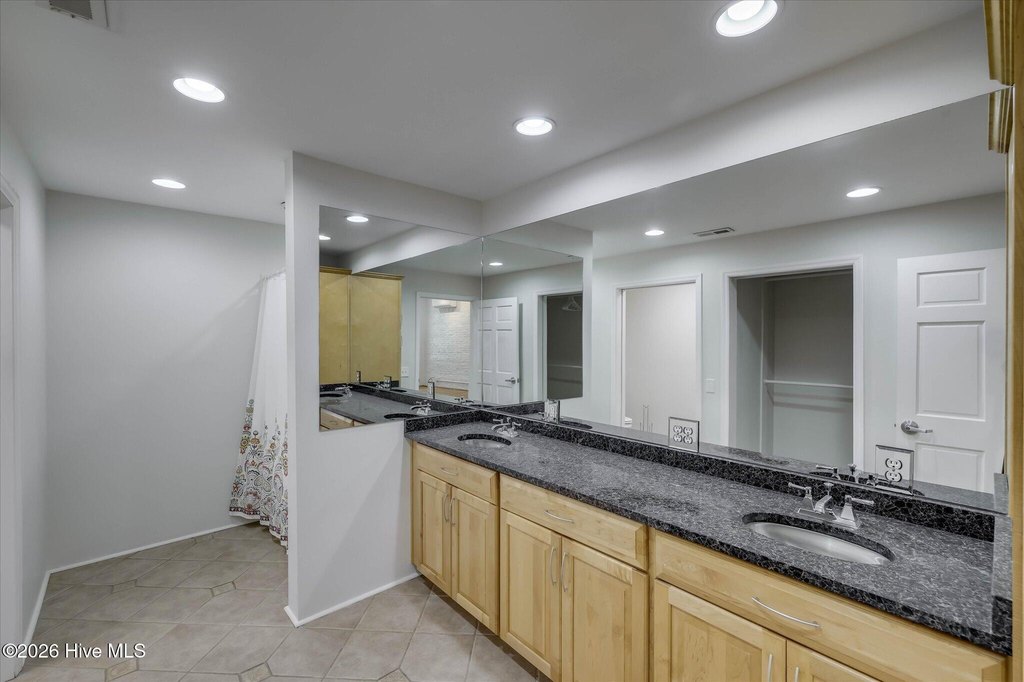
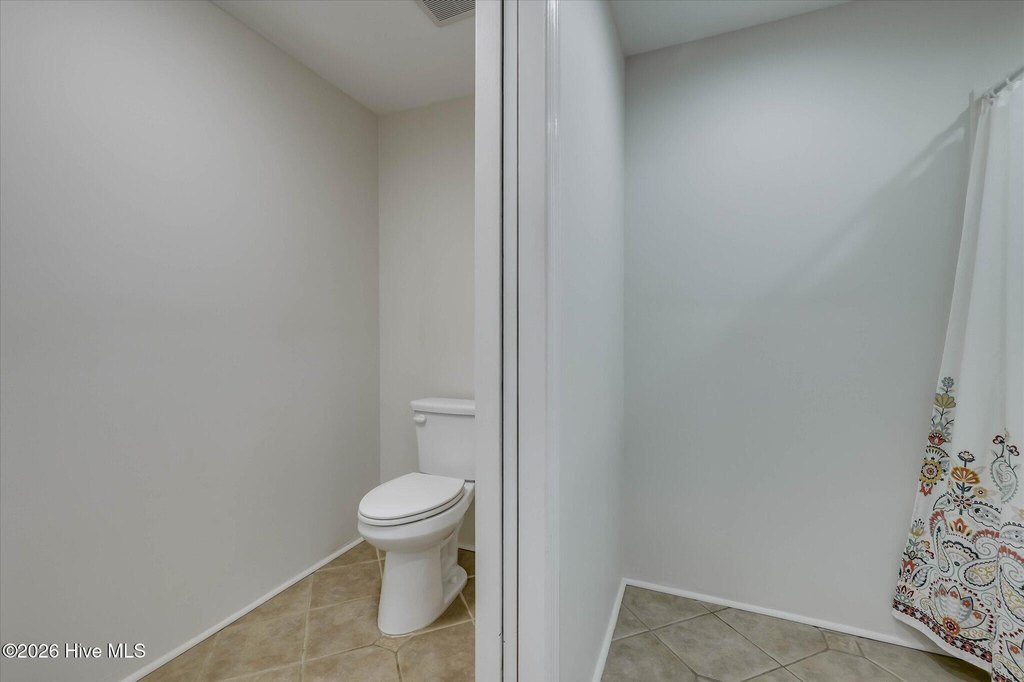
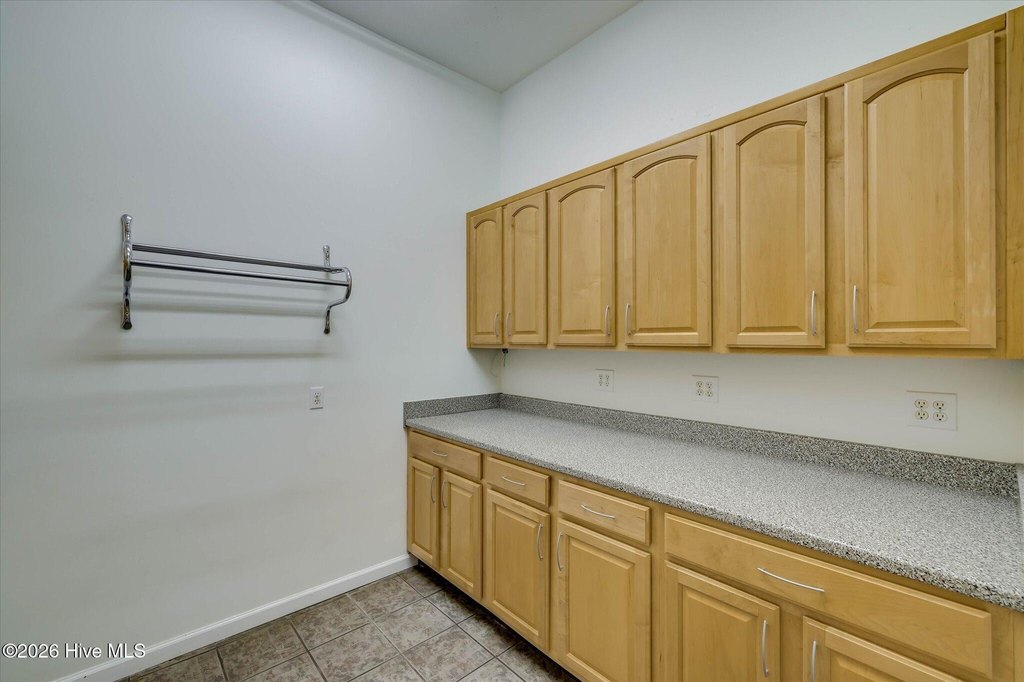
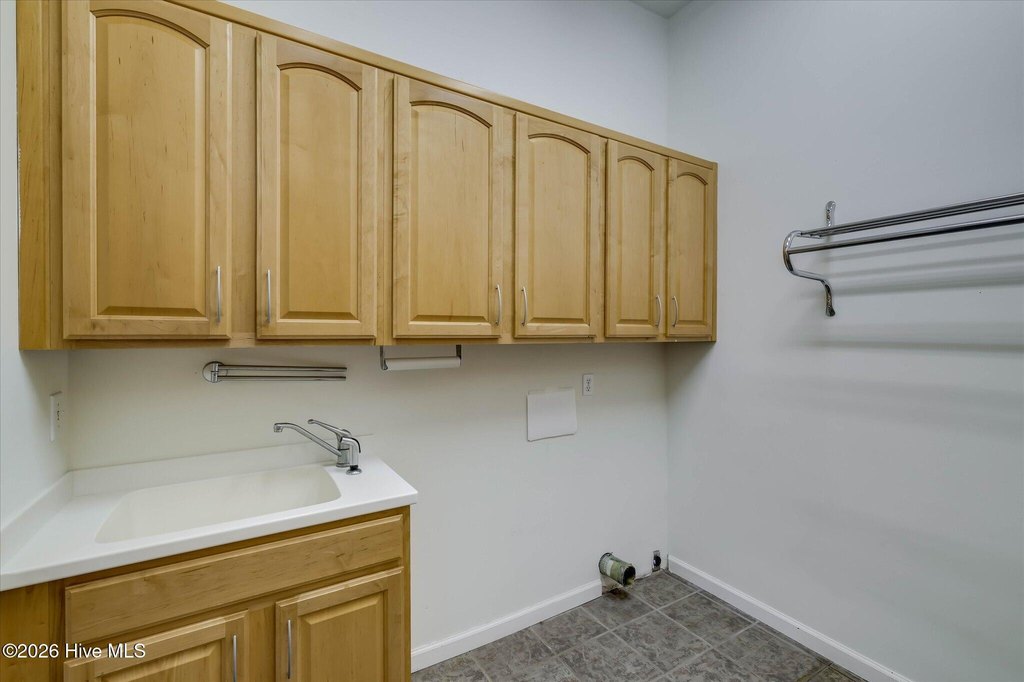
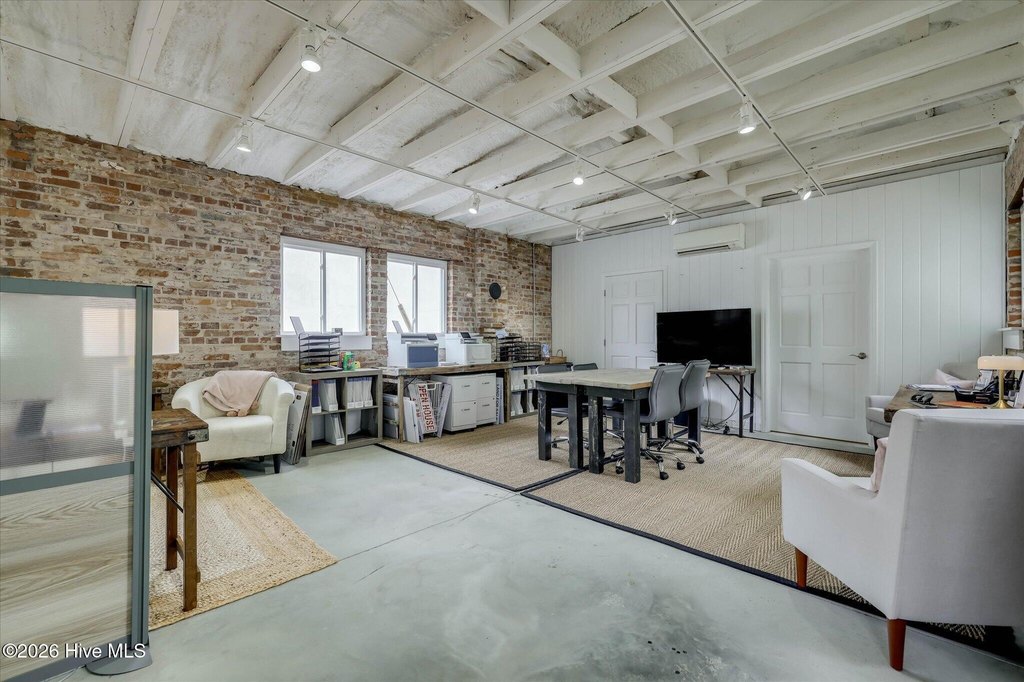
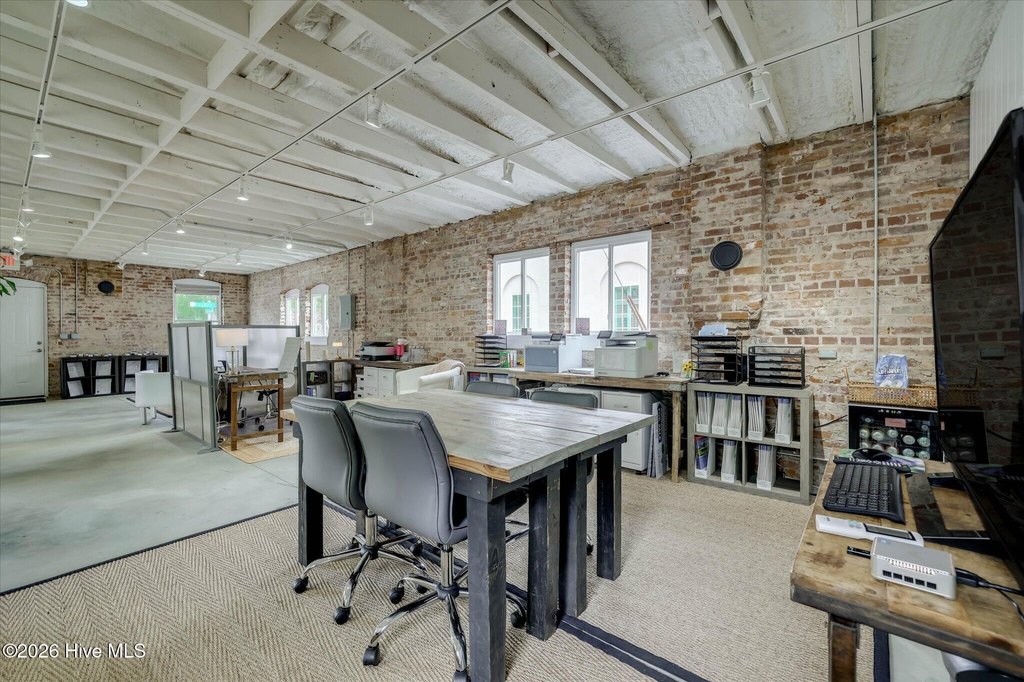
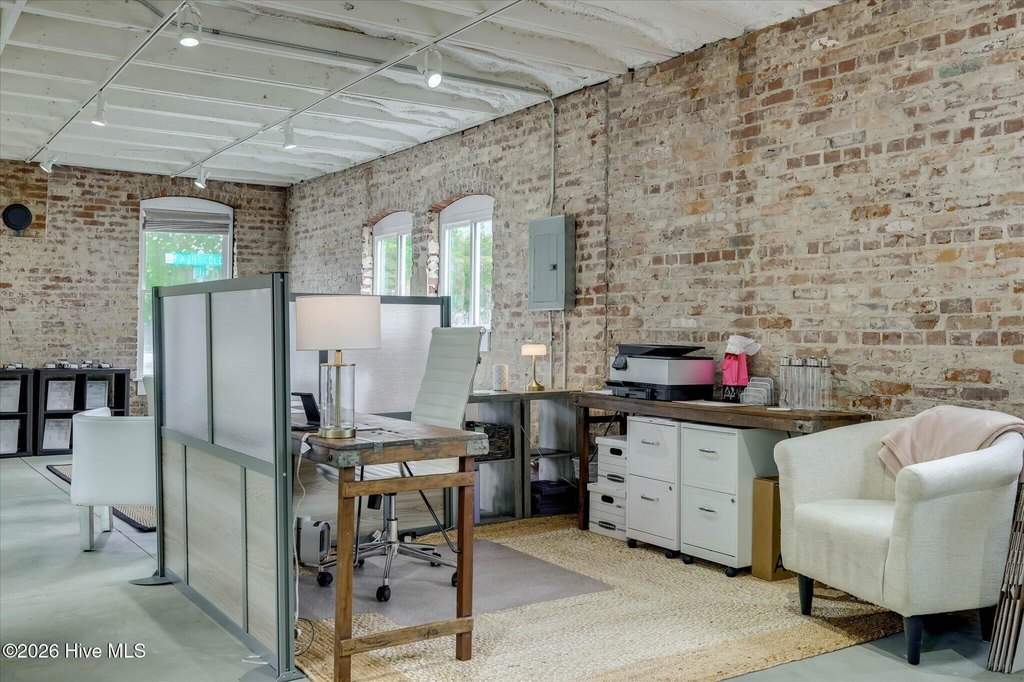
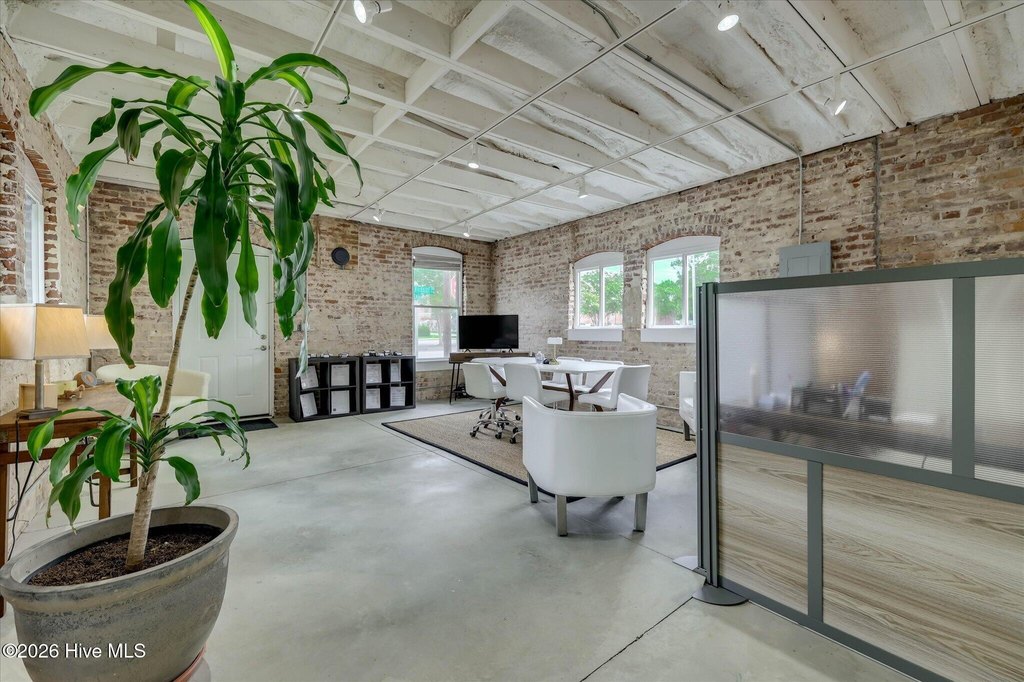
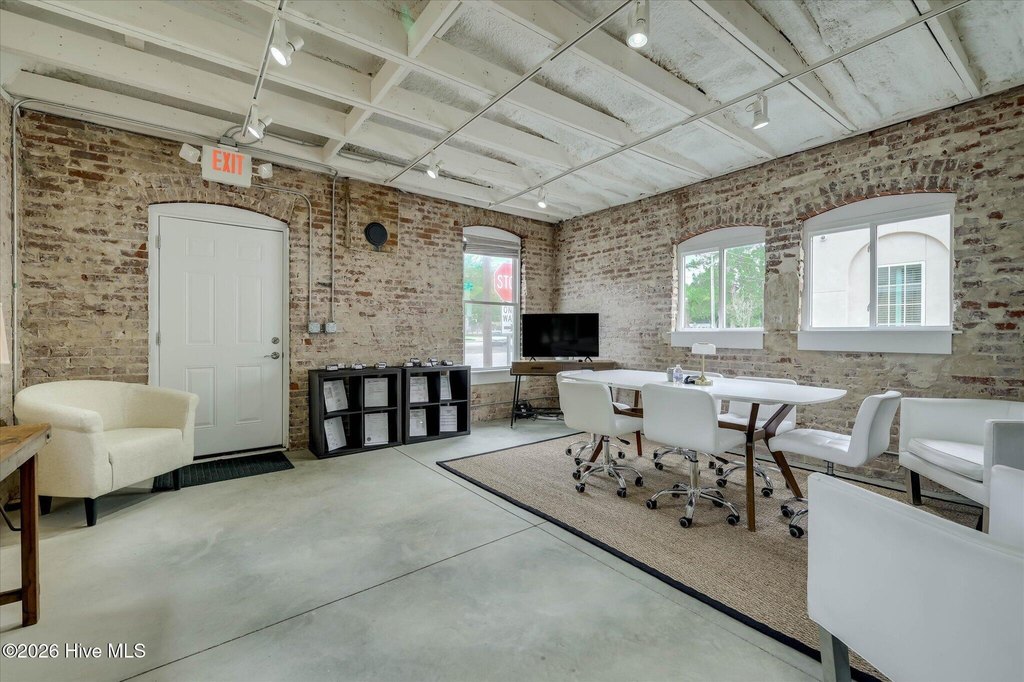
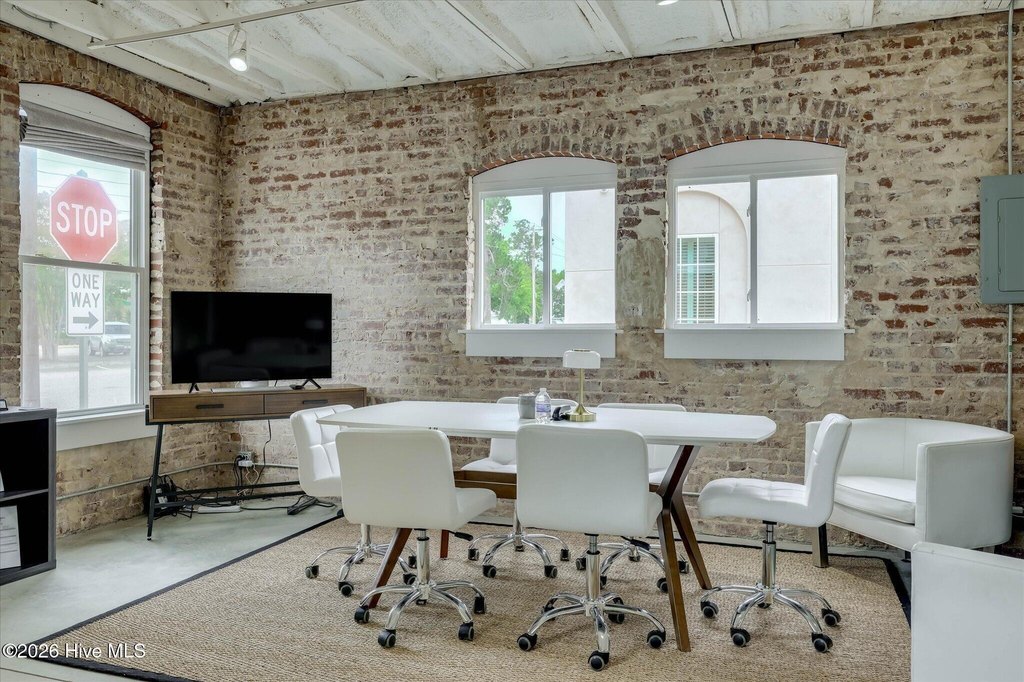
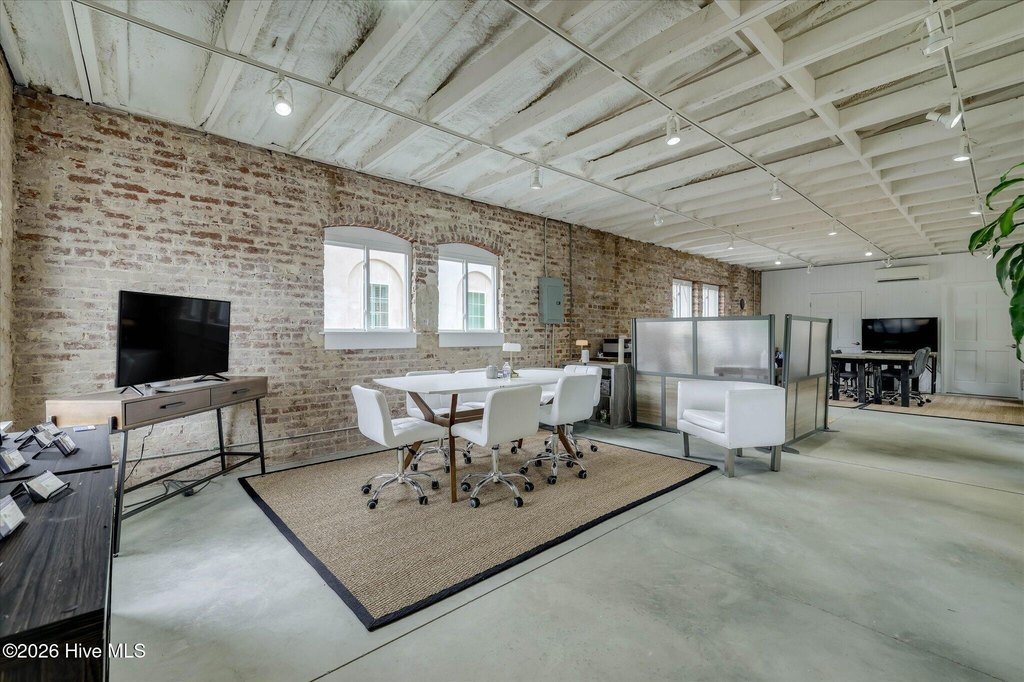
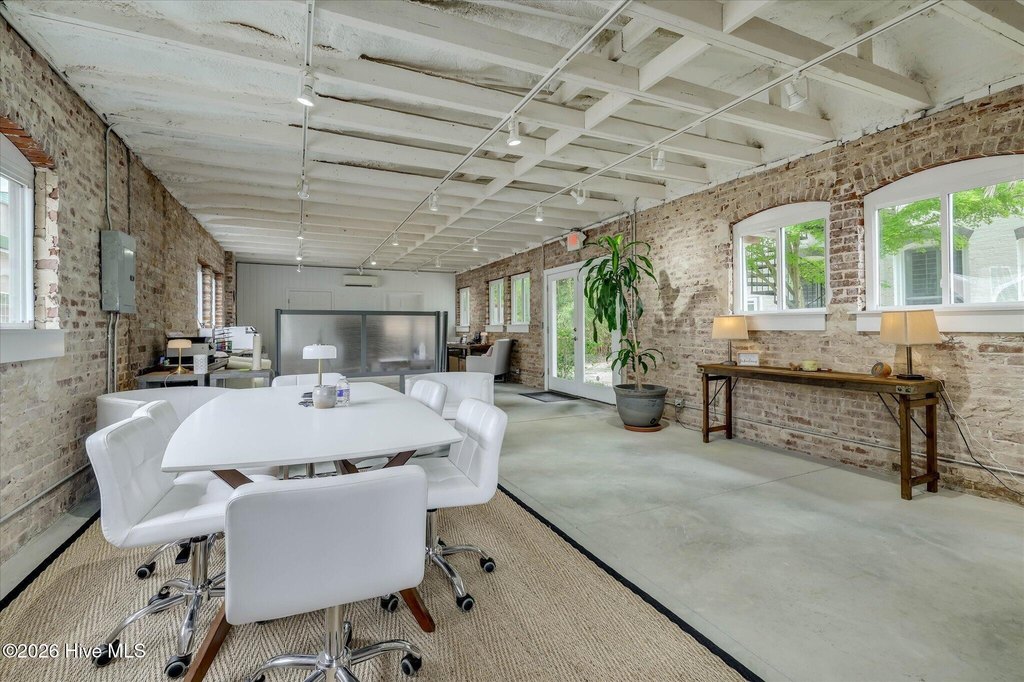
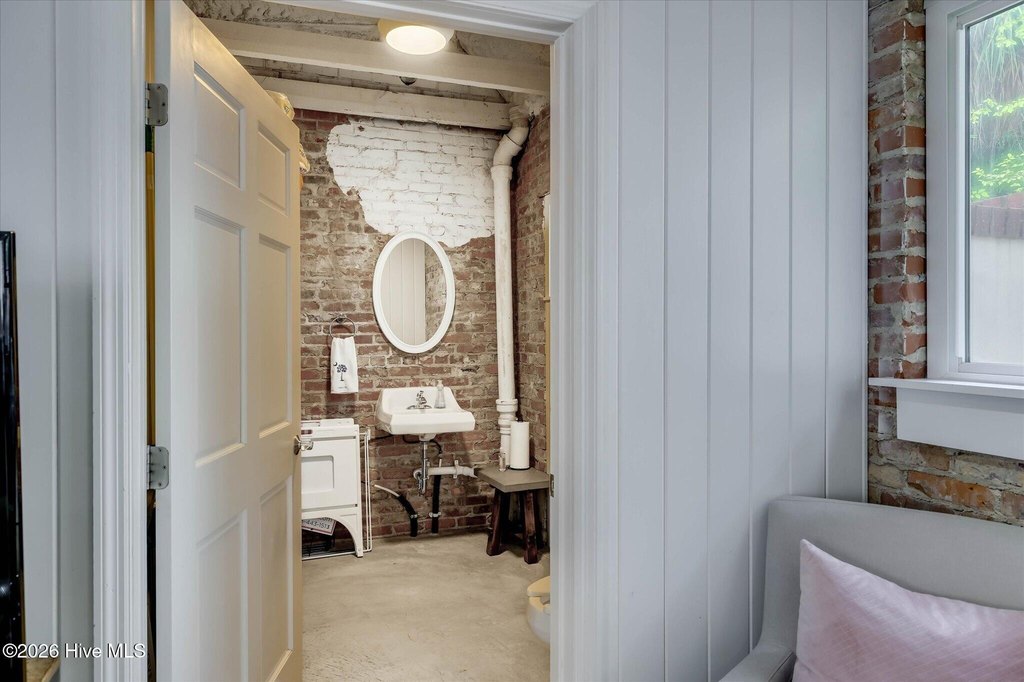
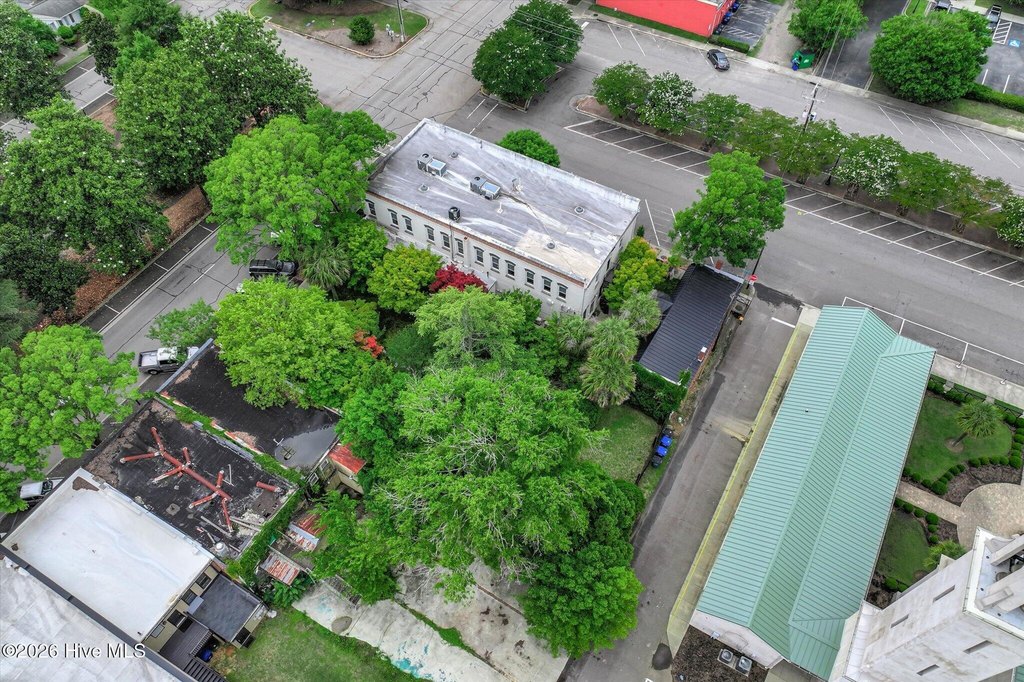
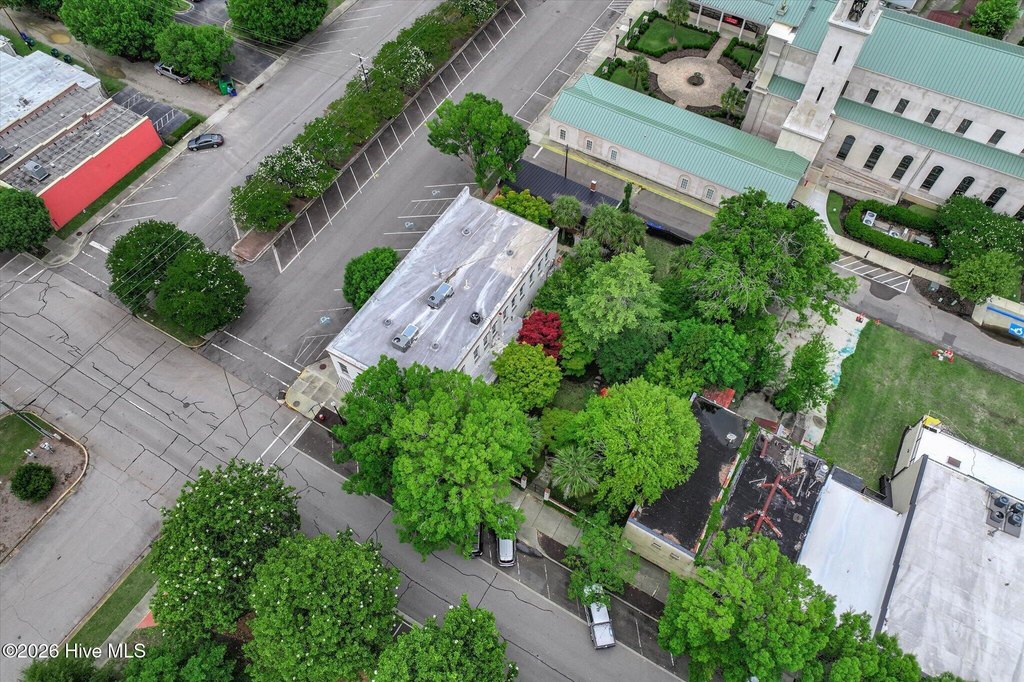
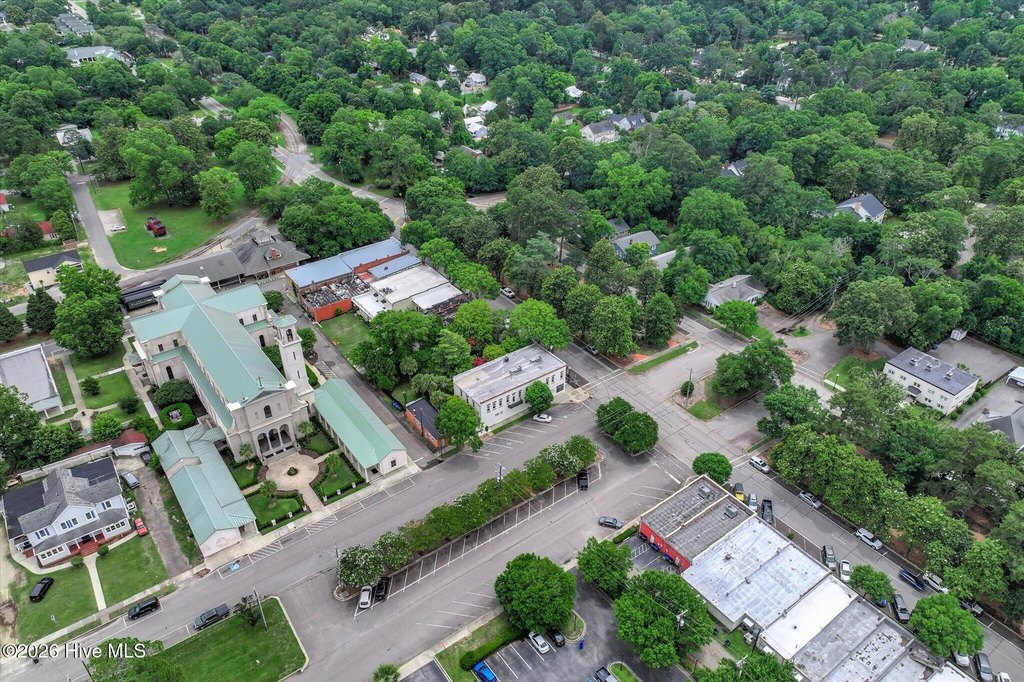
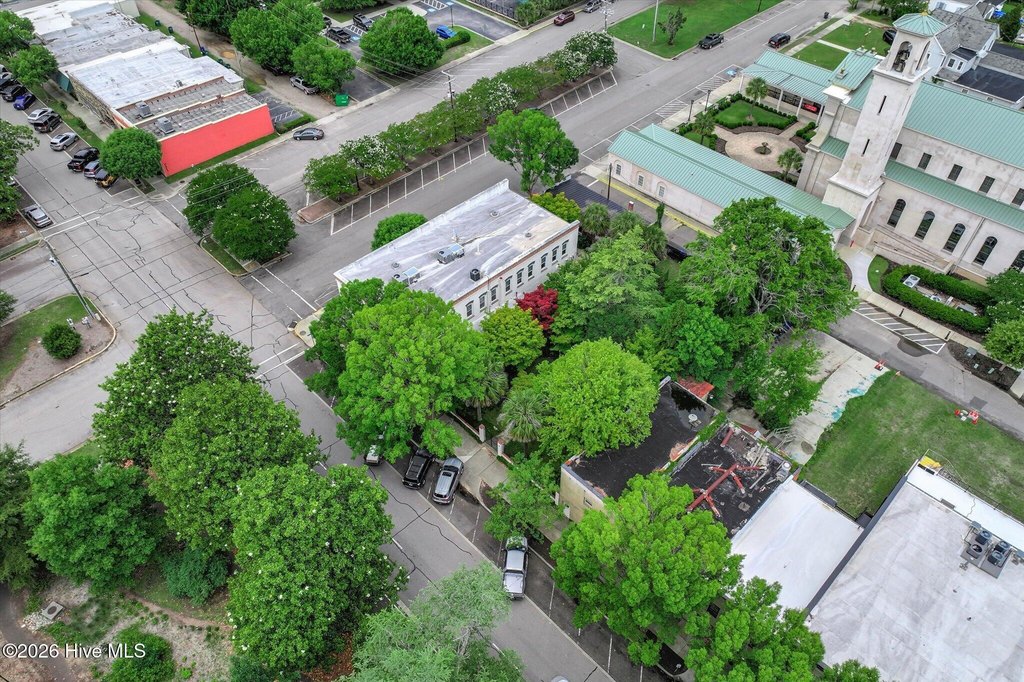
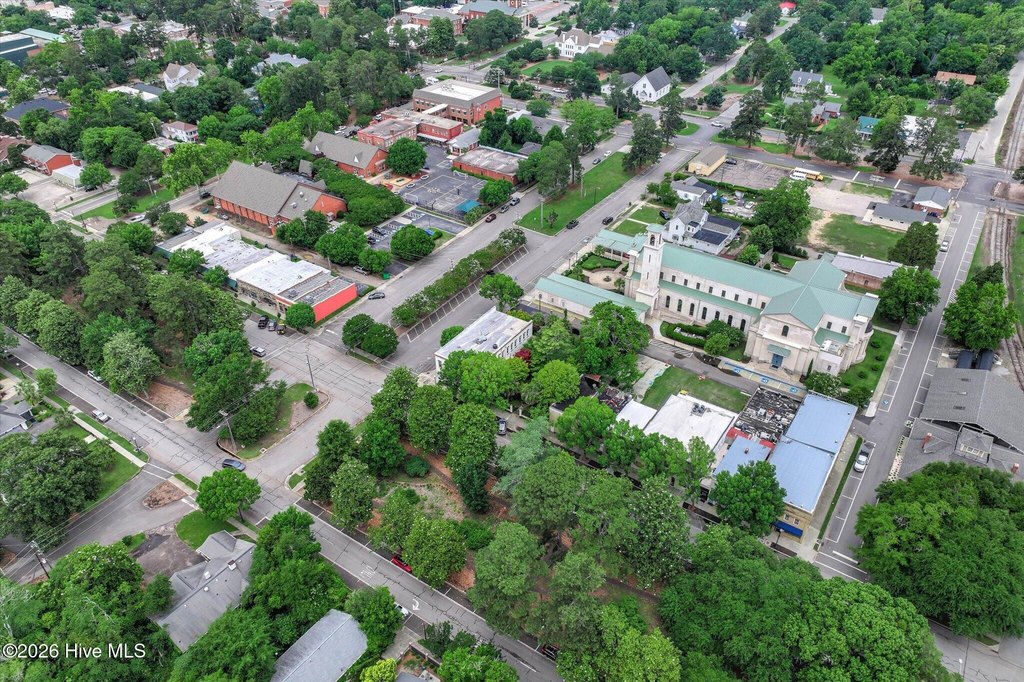
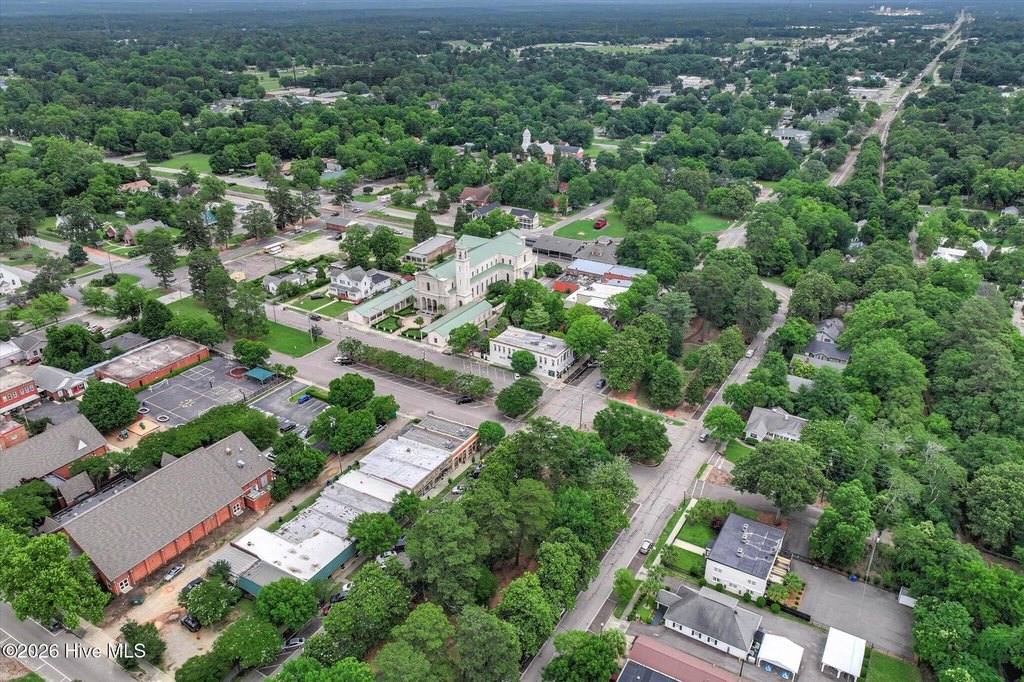
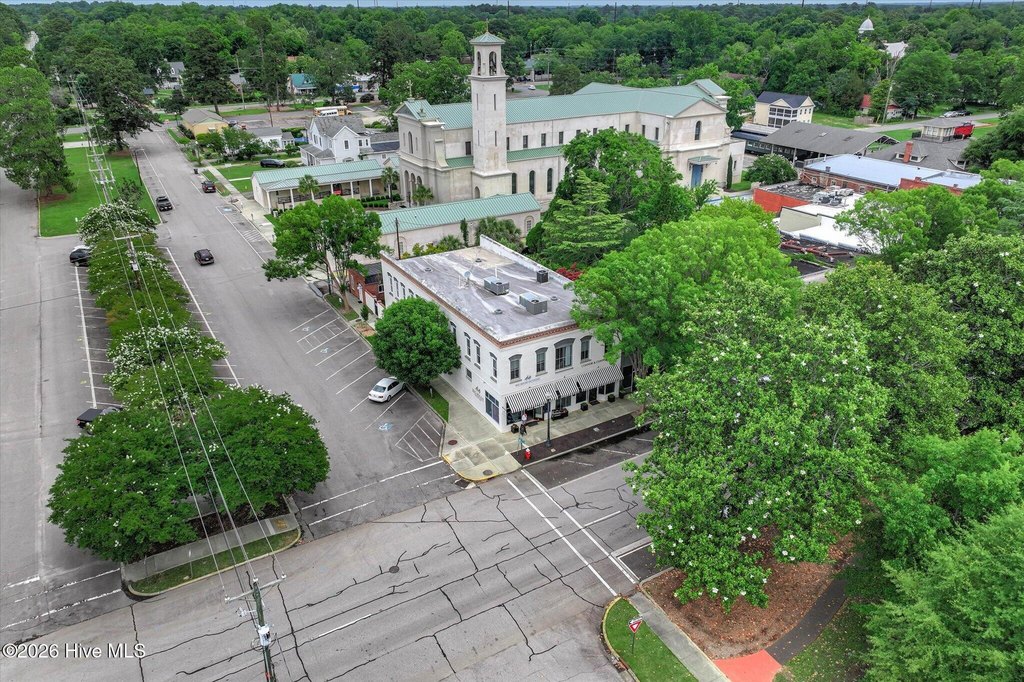
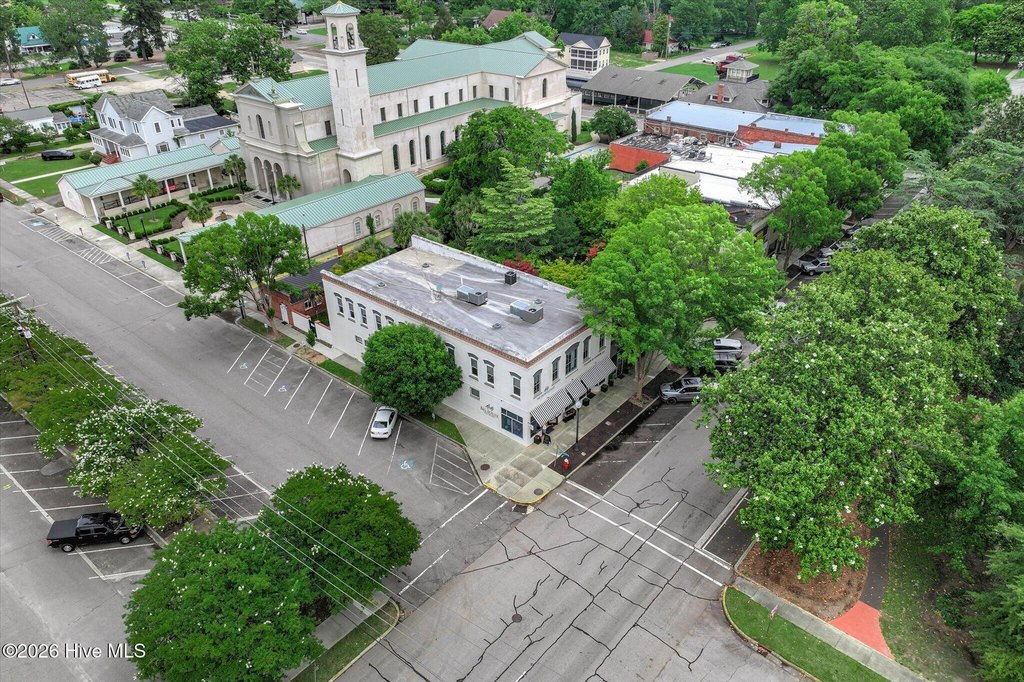
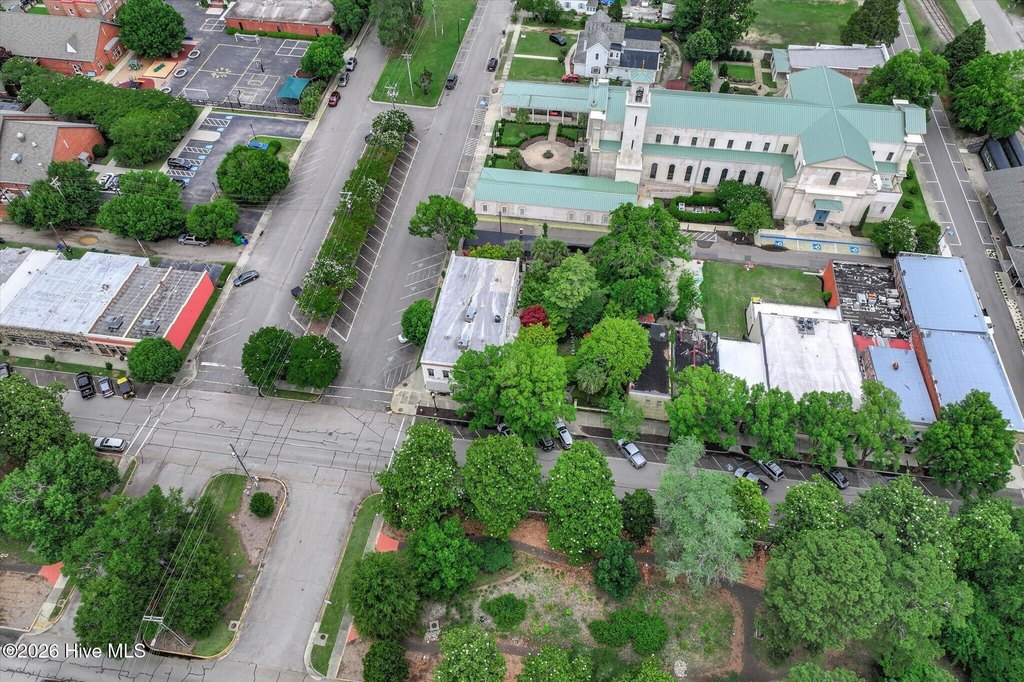
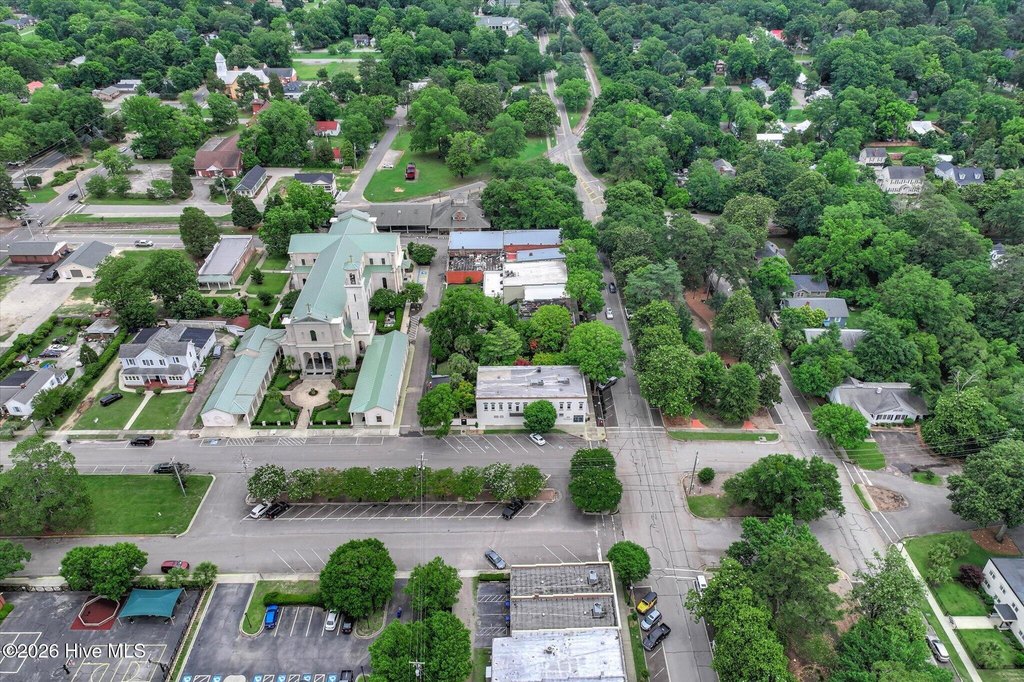
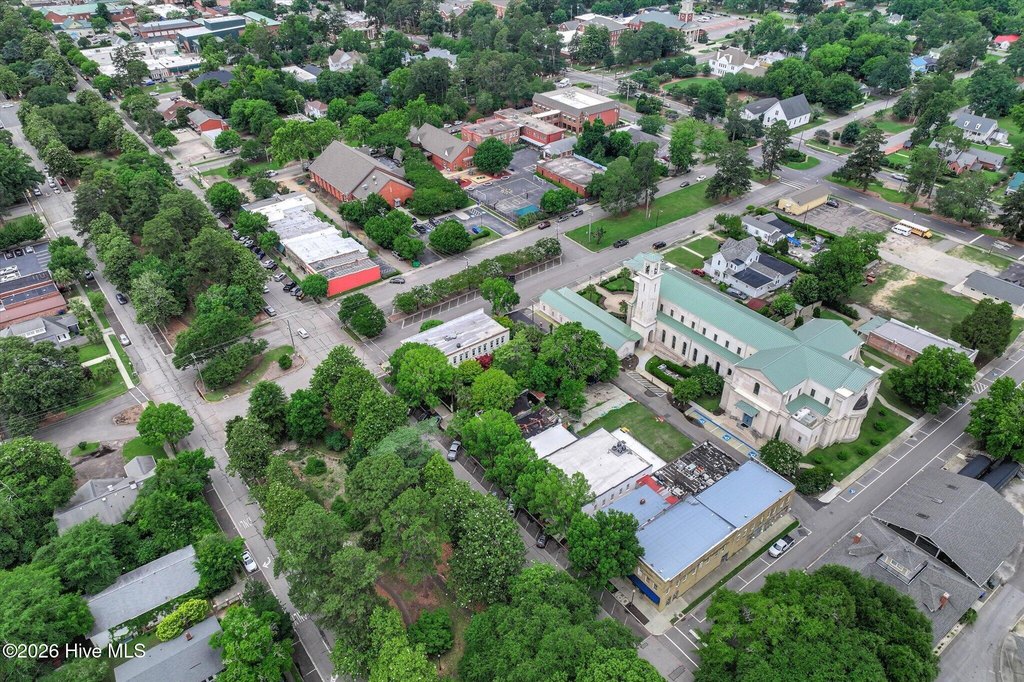
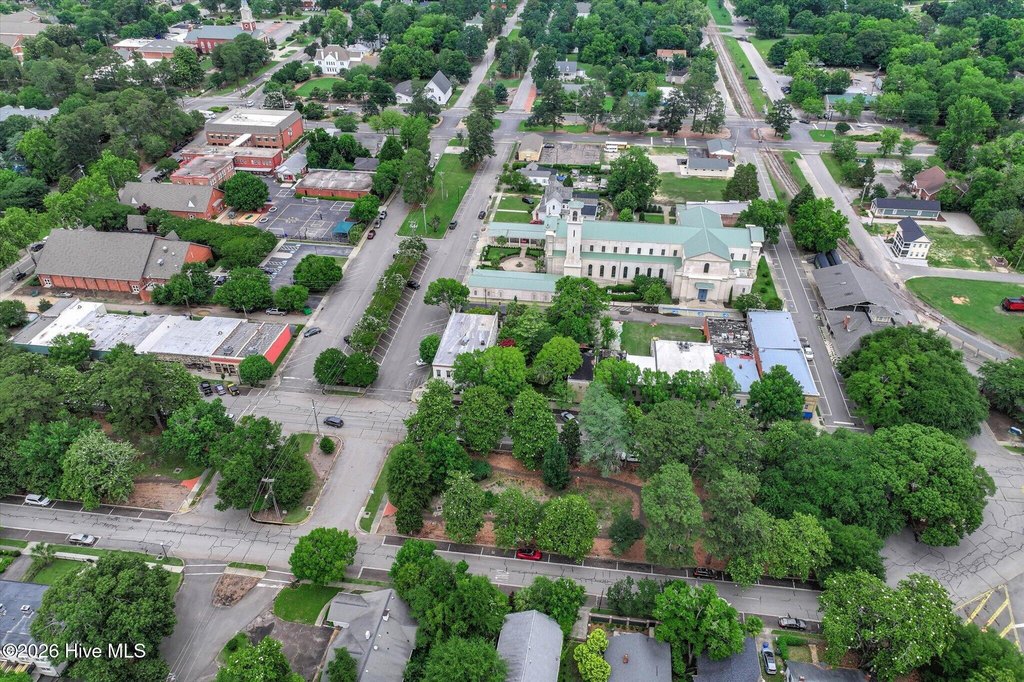
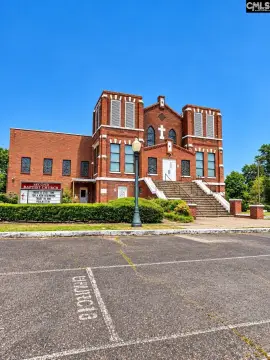
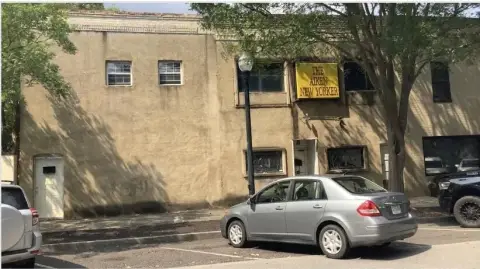
Built in 1890, this 8070-square-foot mixed-use property combines preserved architectural elements with extensive modern functionality. The main building includes a two-story law office with private offices, conference areas, library space, workrooms, storage, kitchen facilities, and baths. A one-bedroom condominium offers an open kitchen and living area, laundry room, granite countertops, wood flooring, premium appliances, and a primary bath with double vanities.
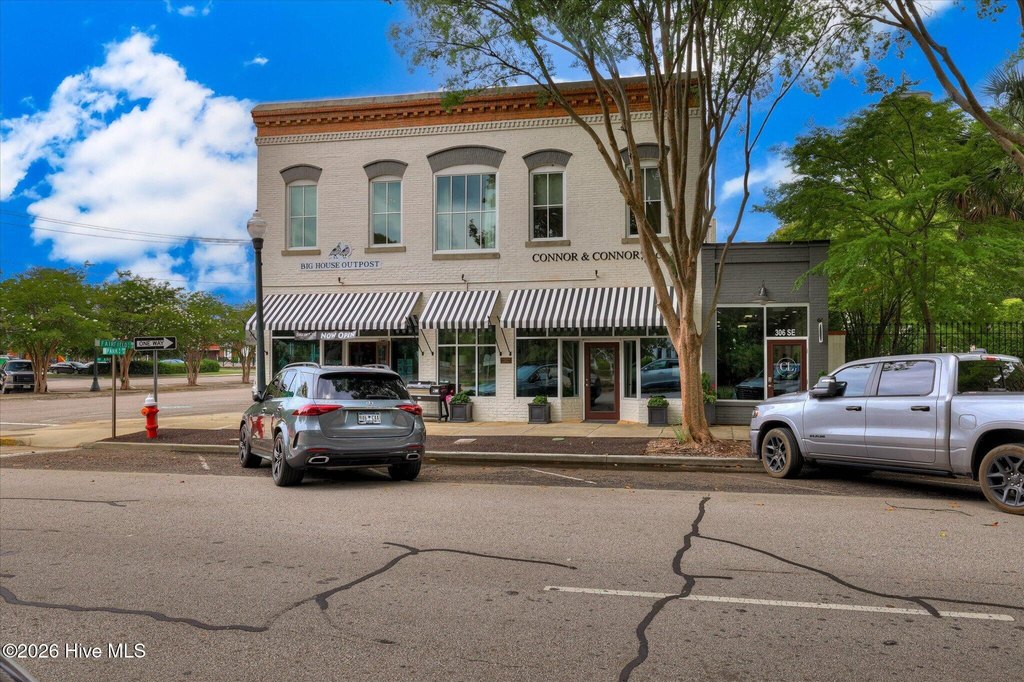
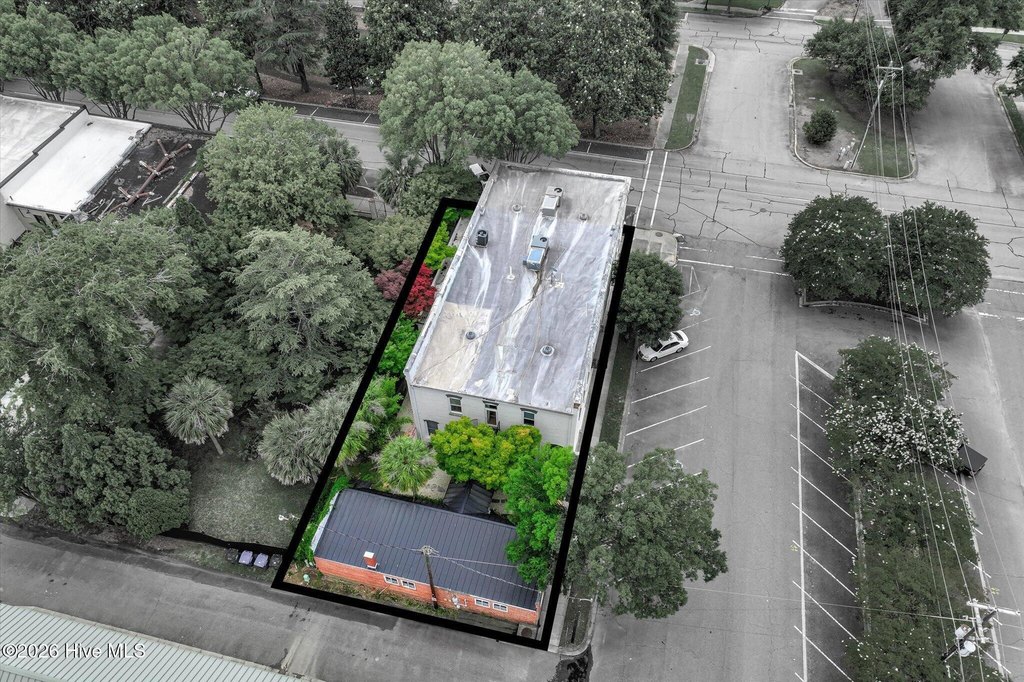
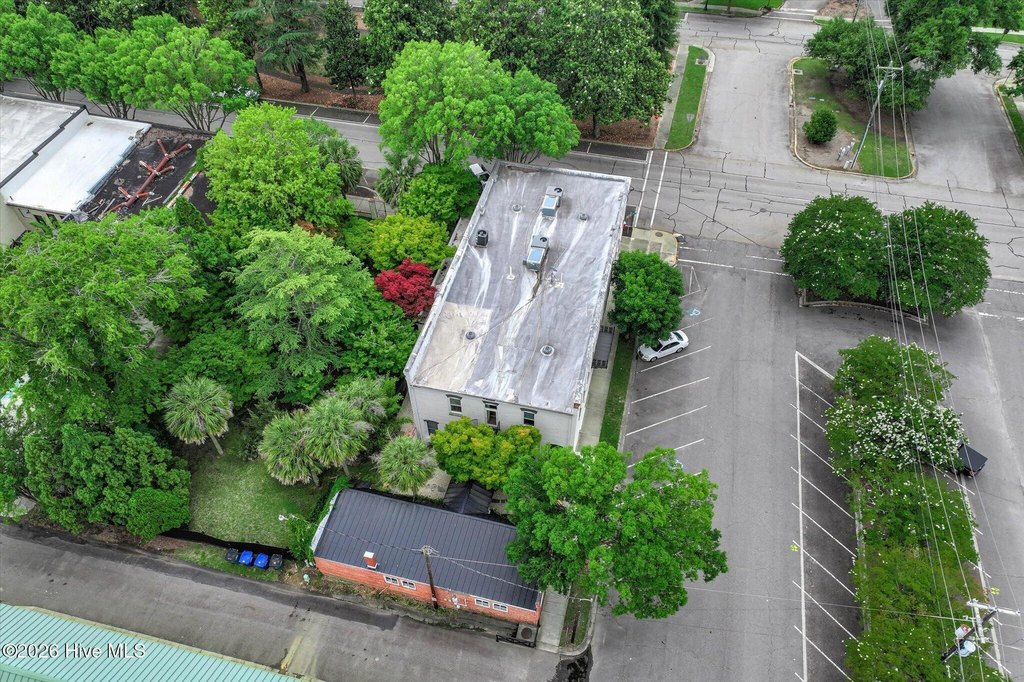
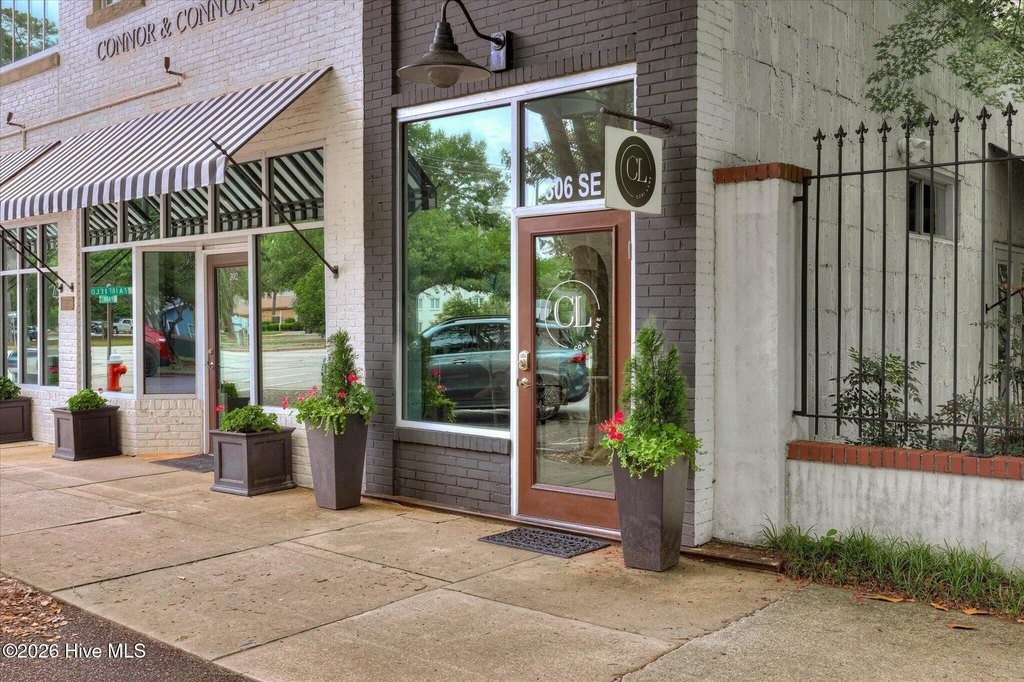
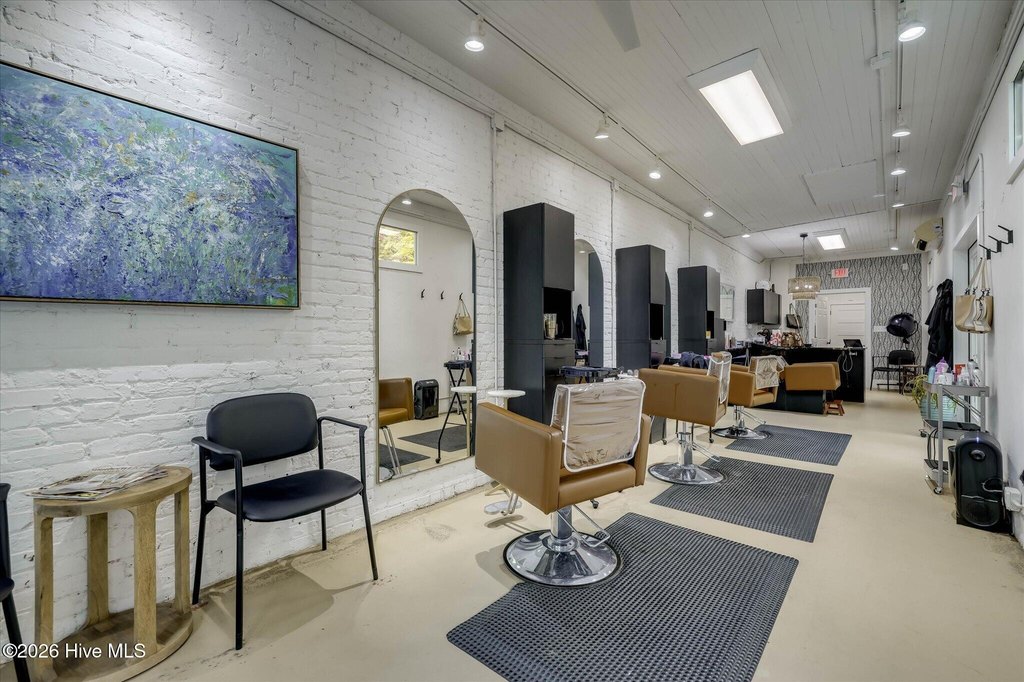
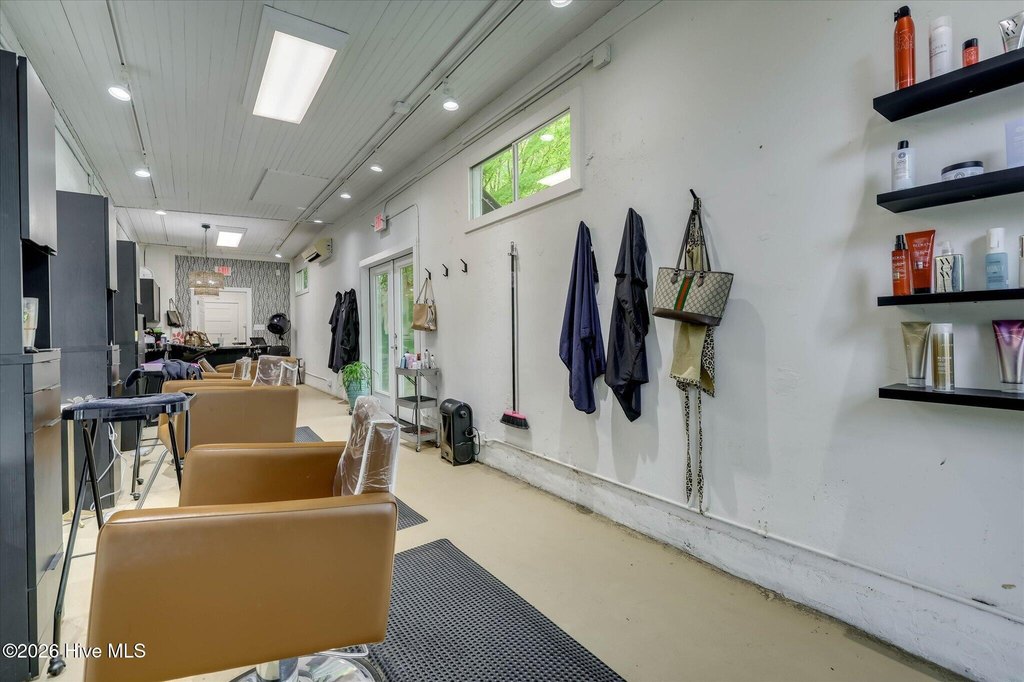
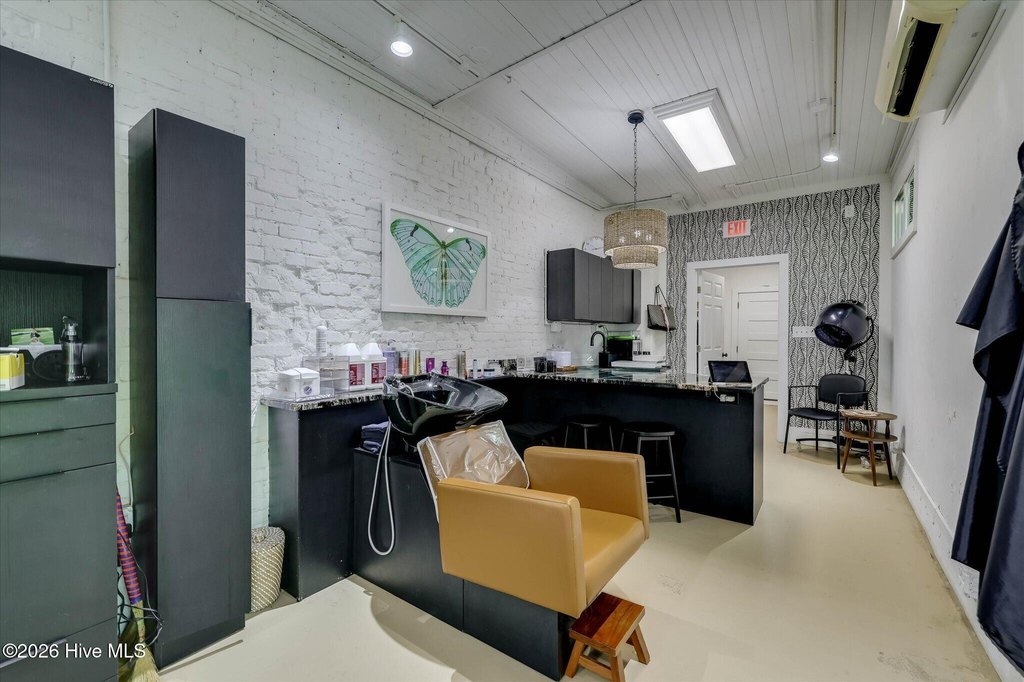
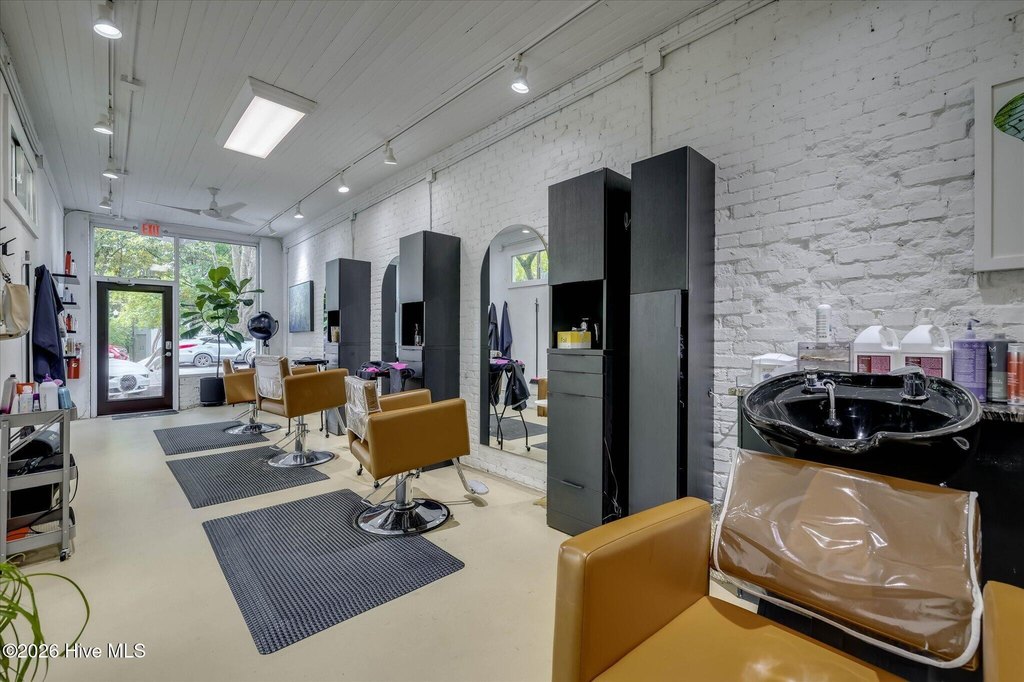
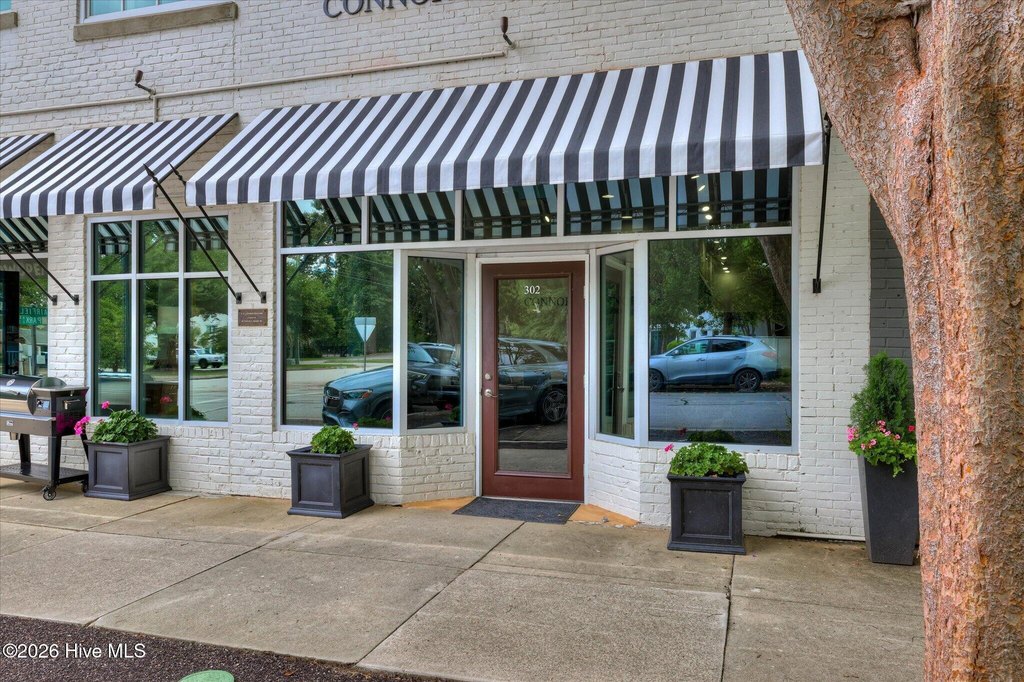
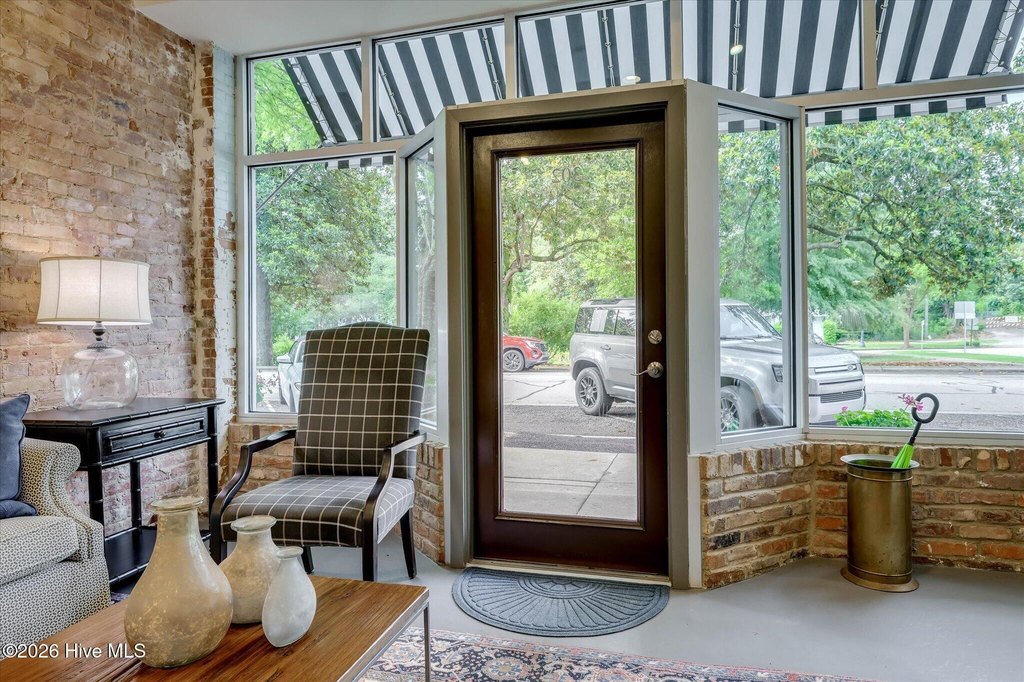
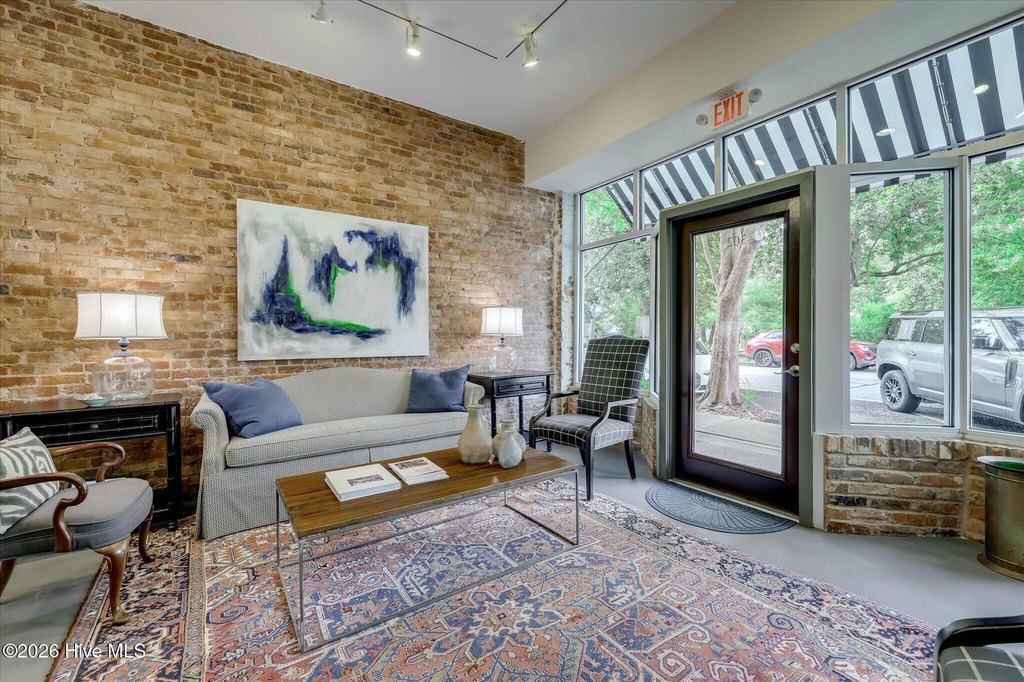
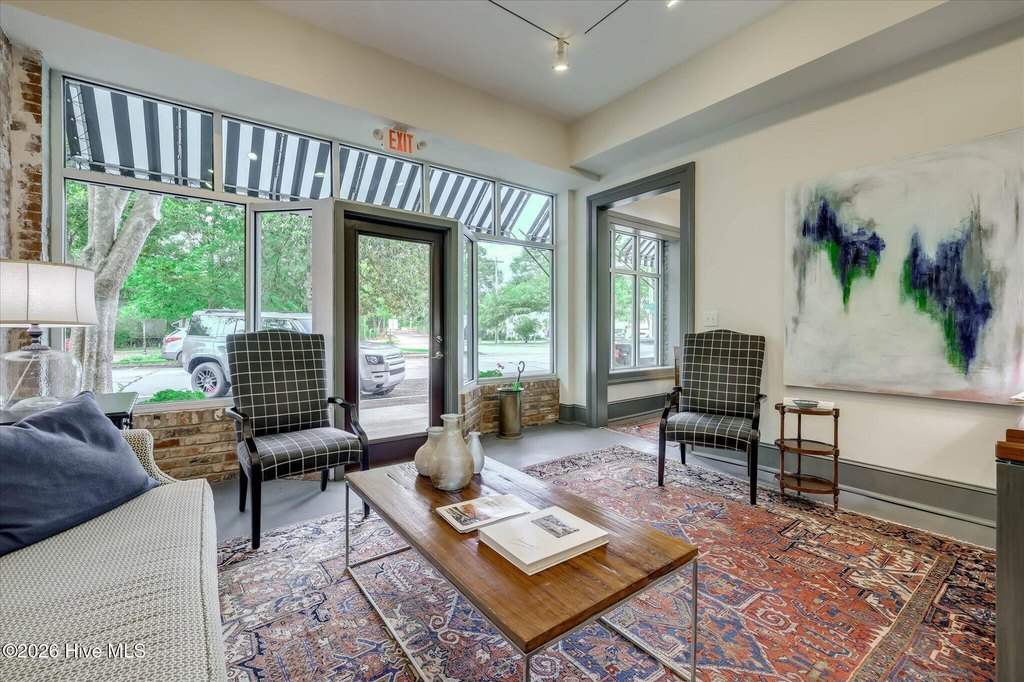
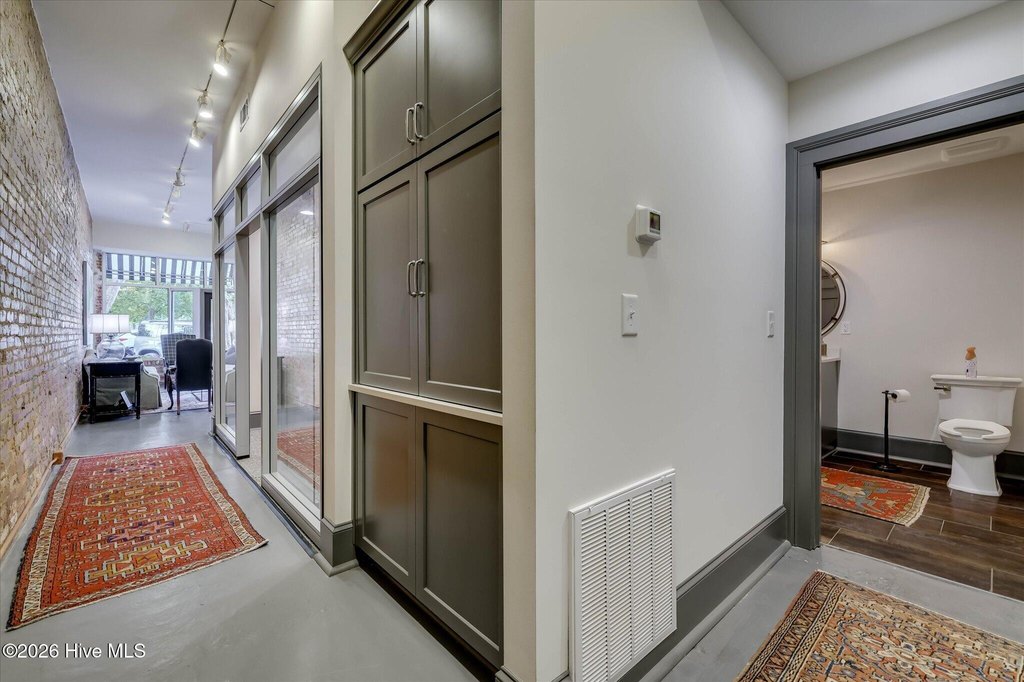
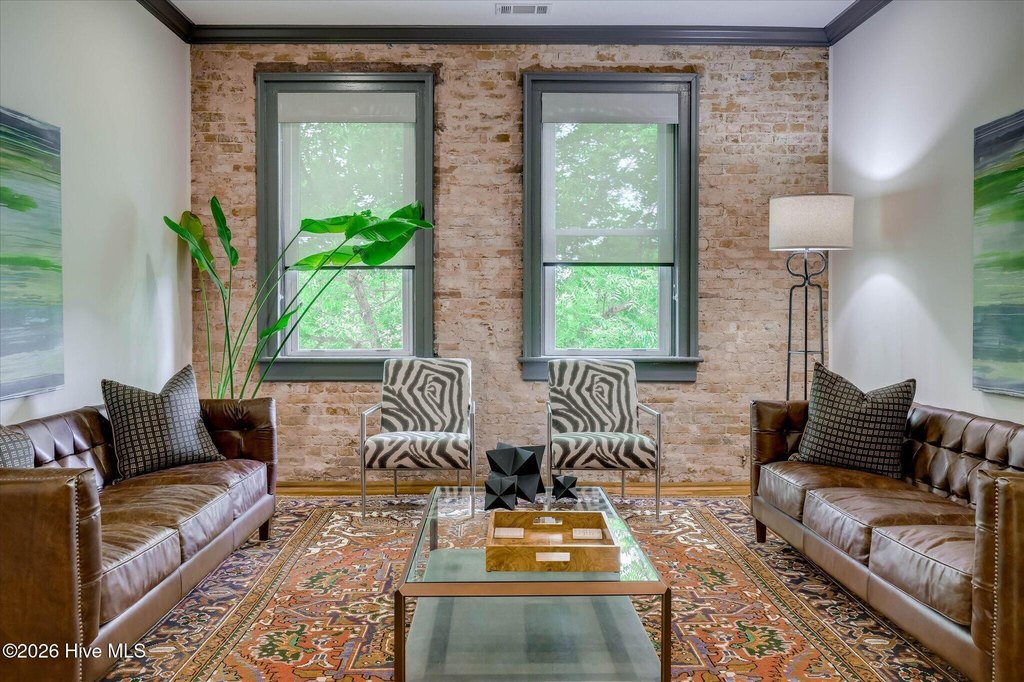
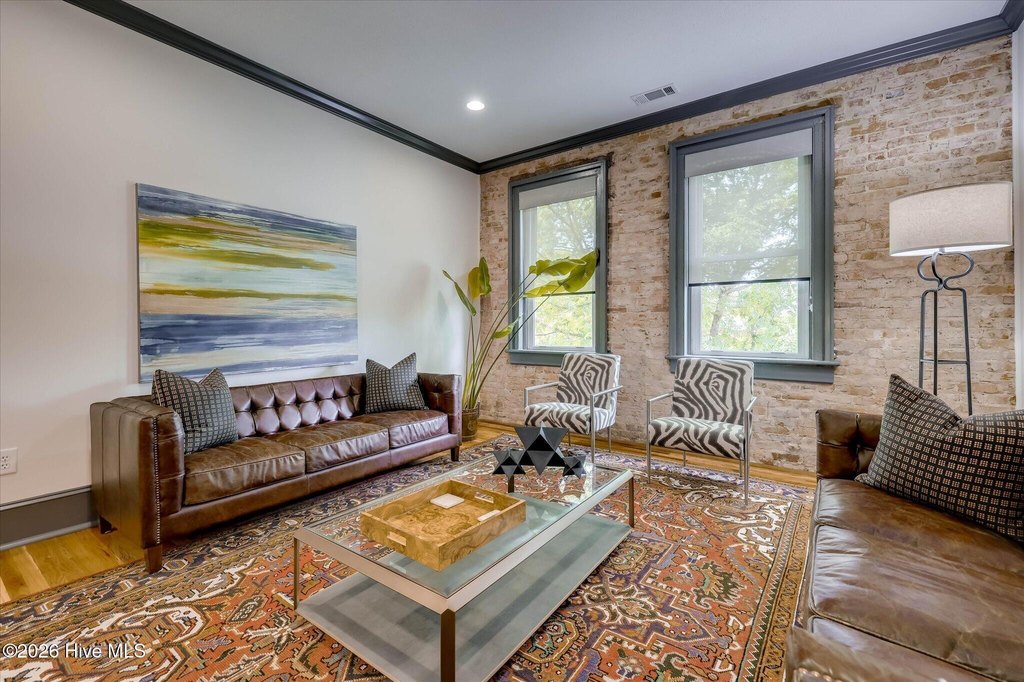
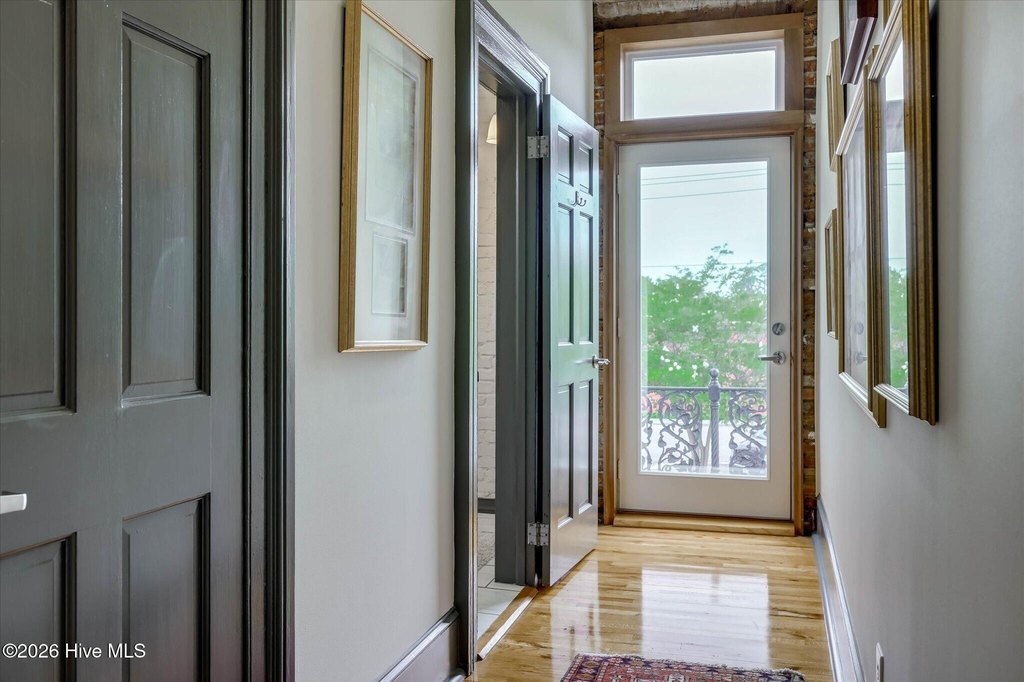
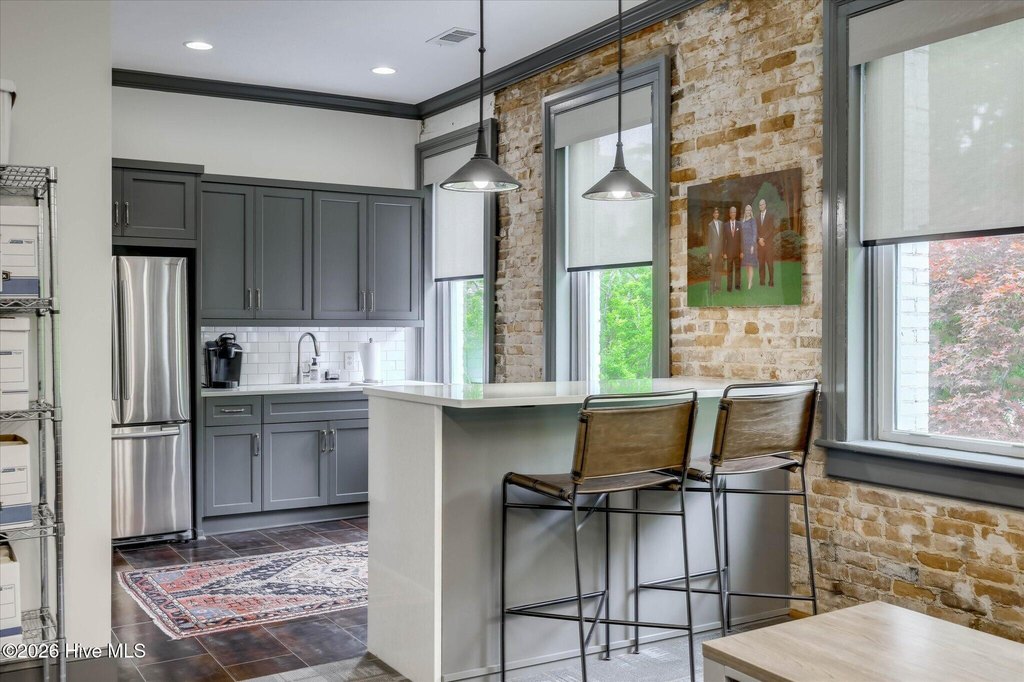
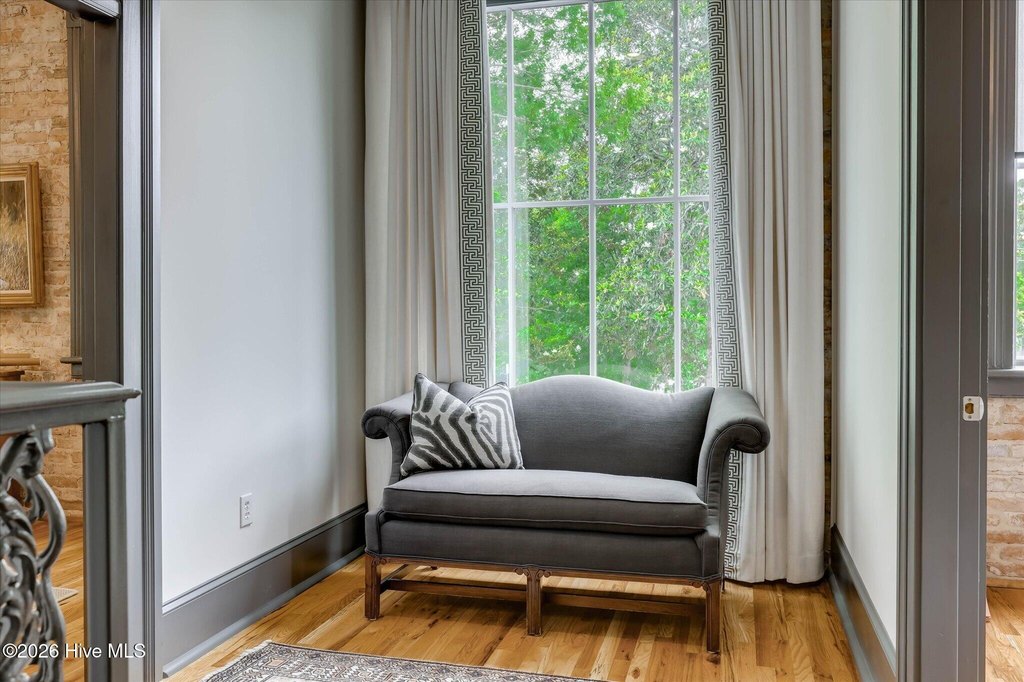
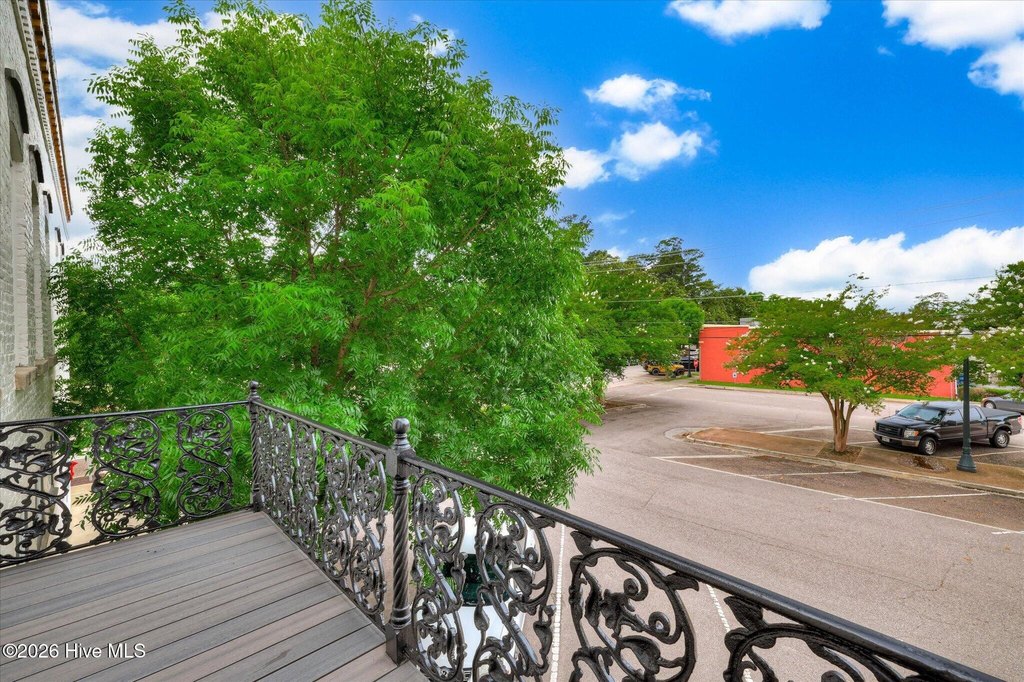
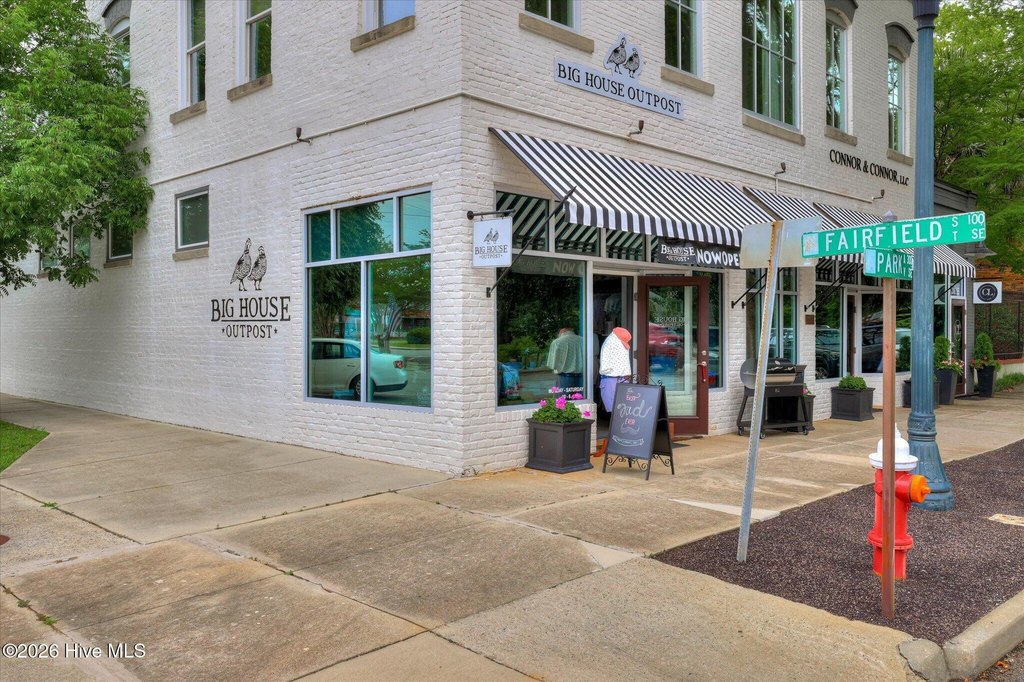
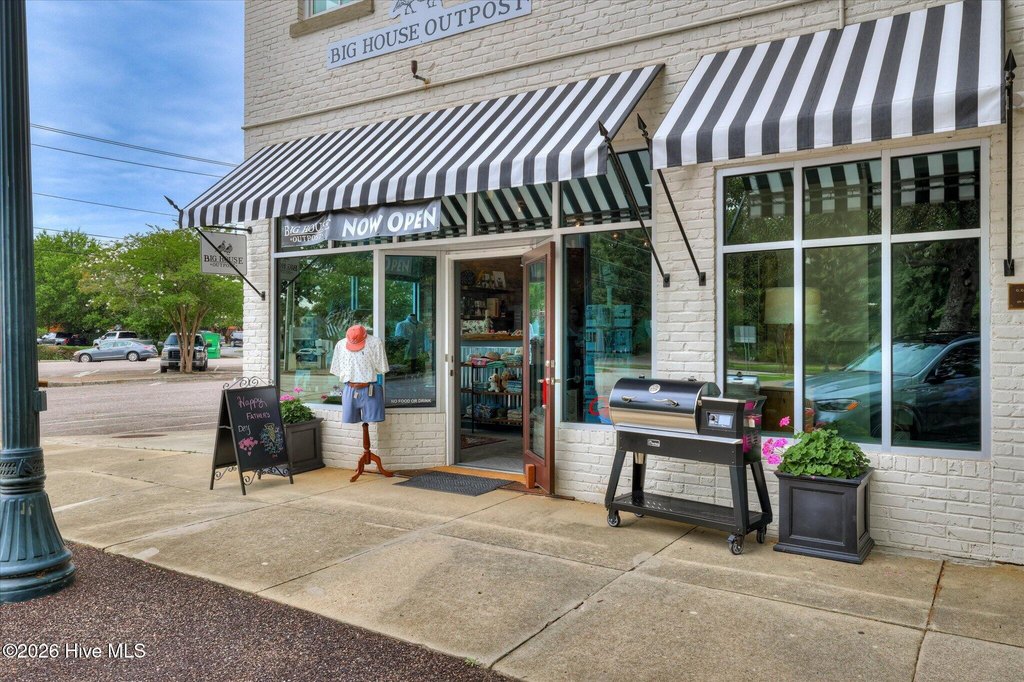
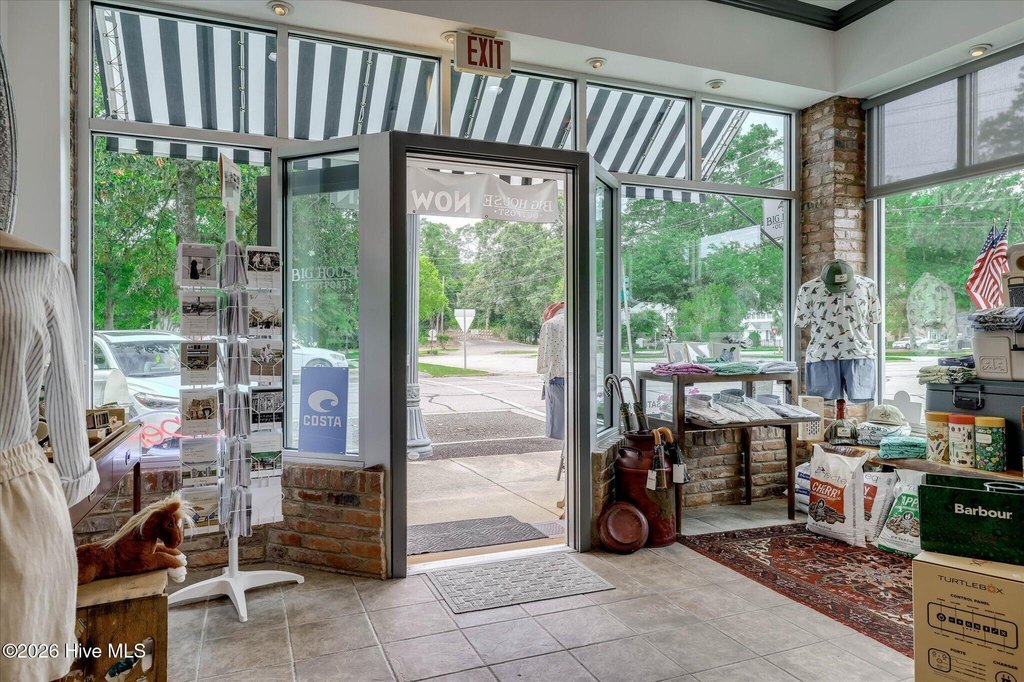
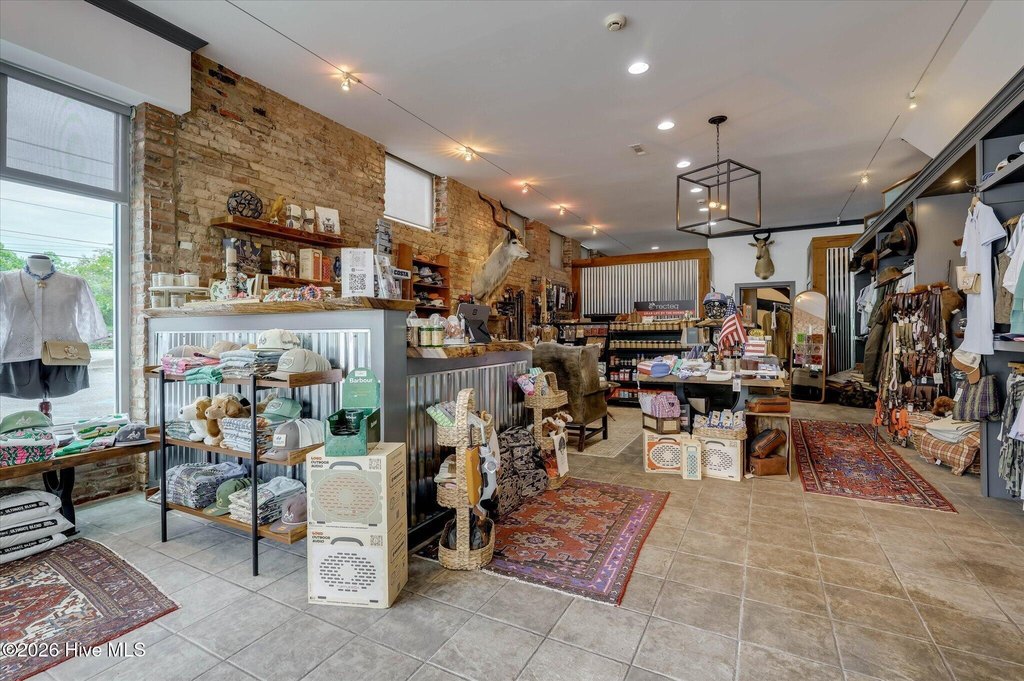
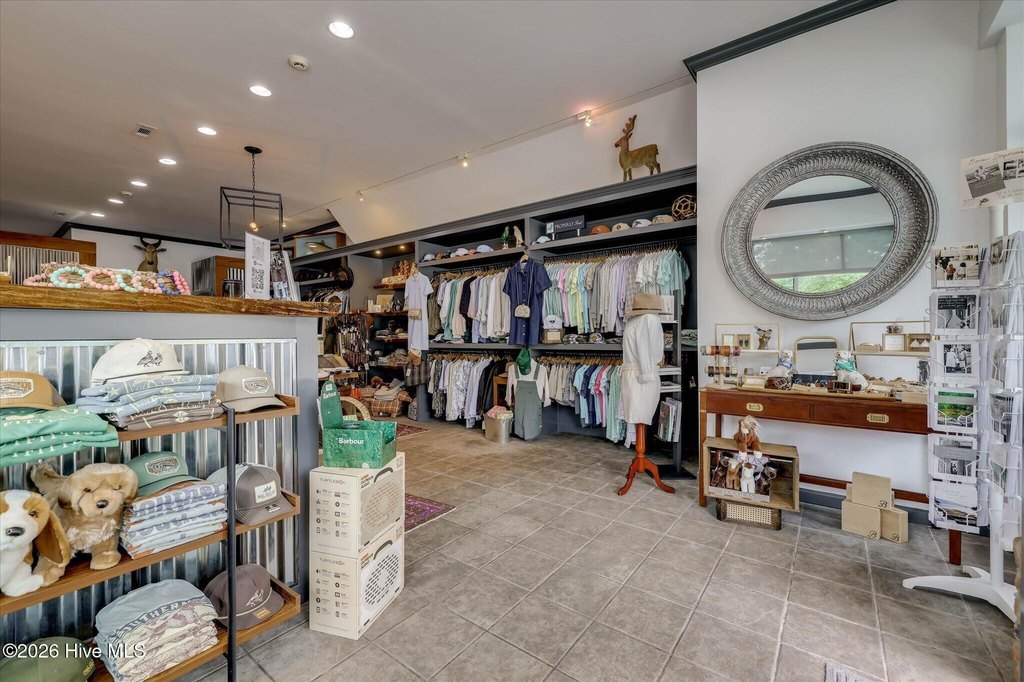
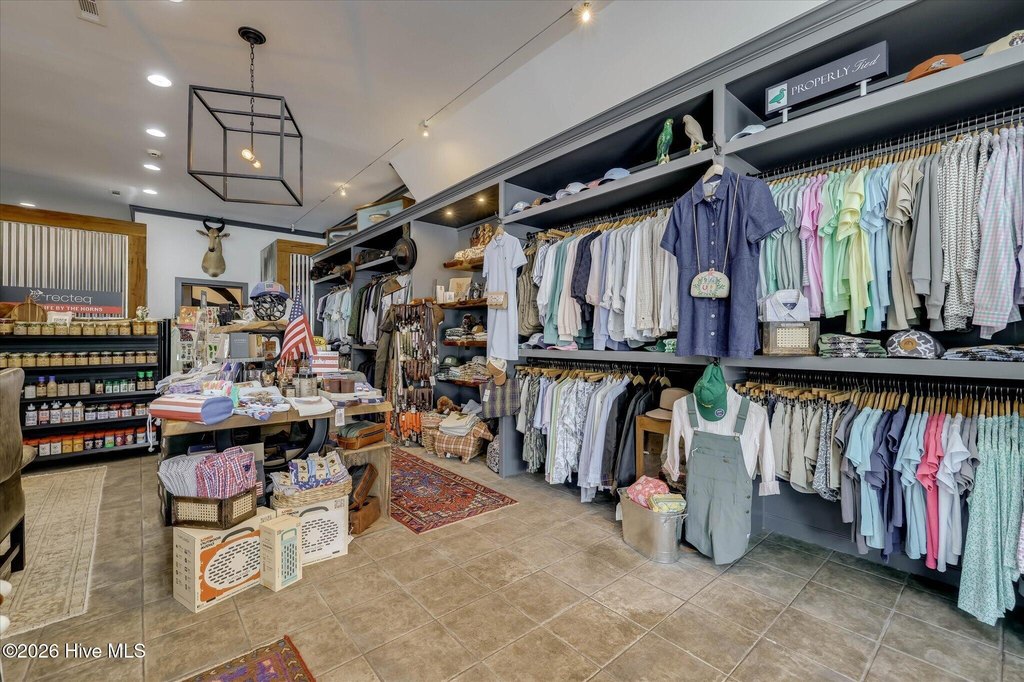
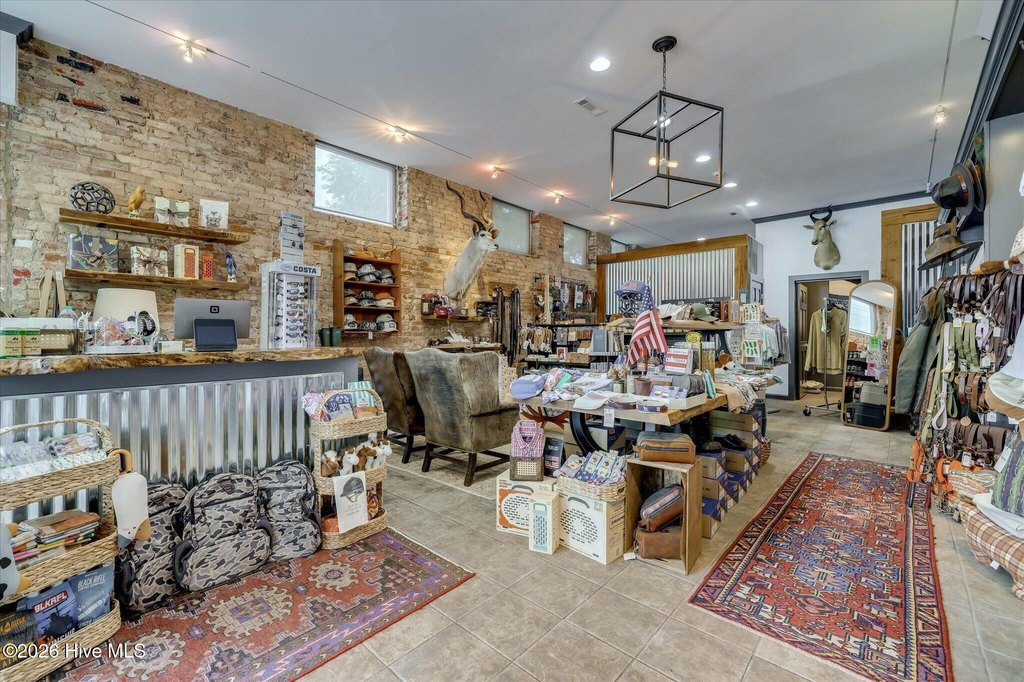
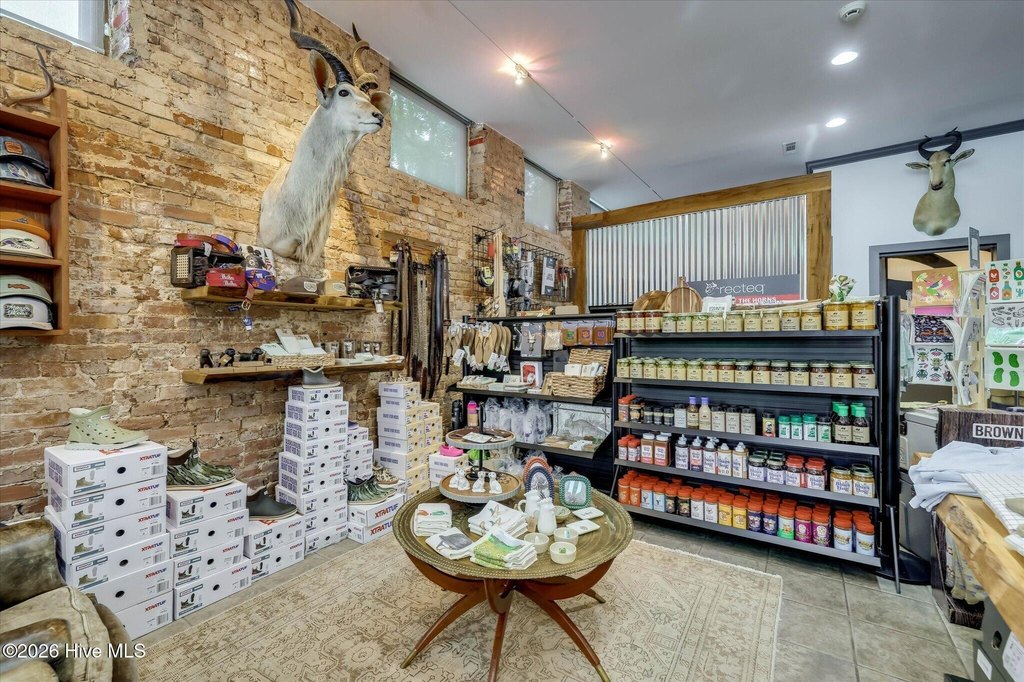
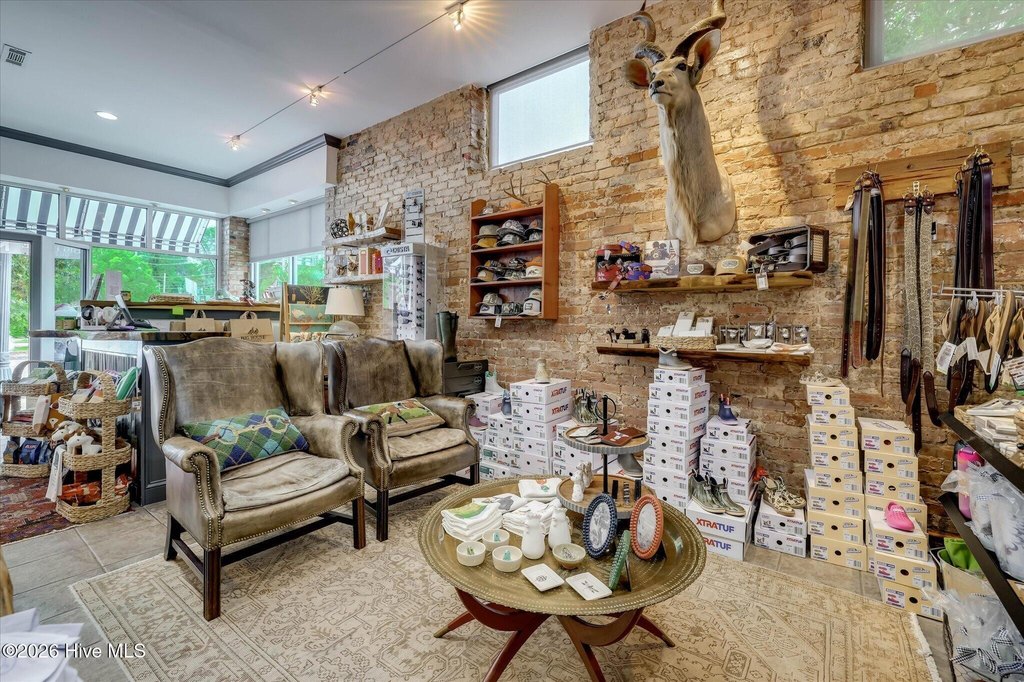
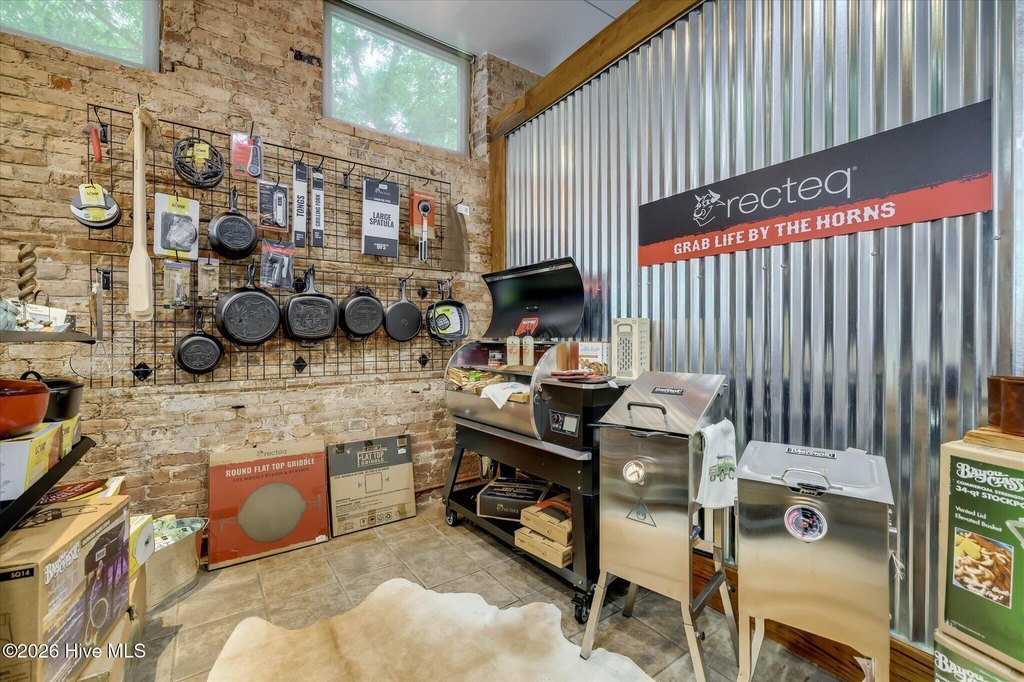
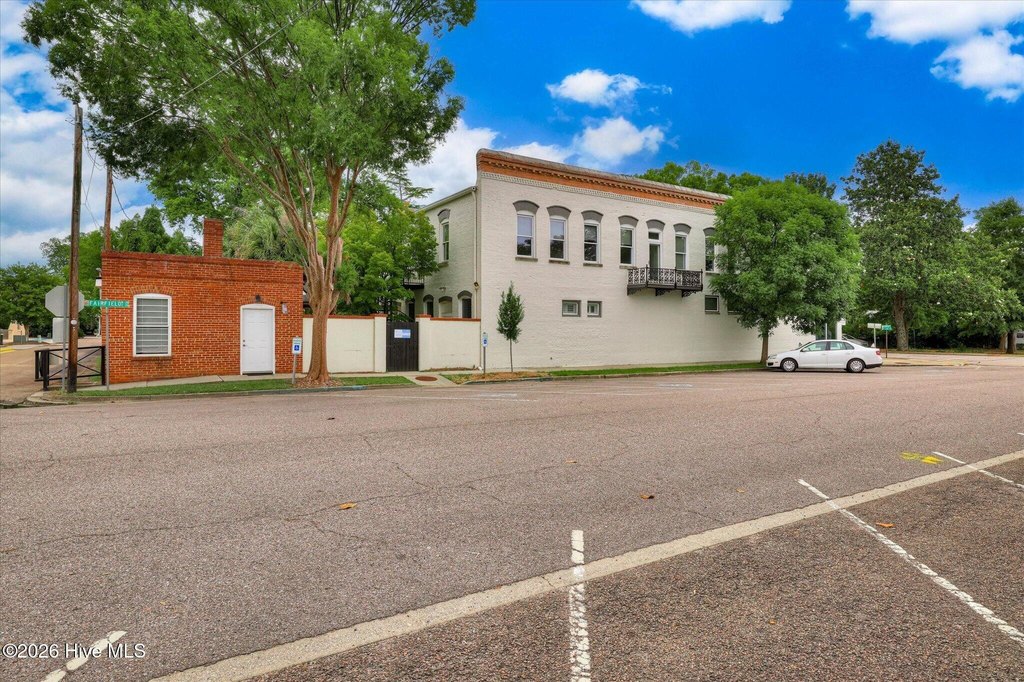
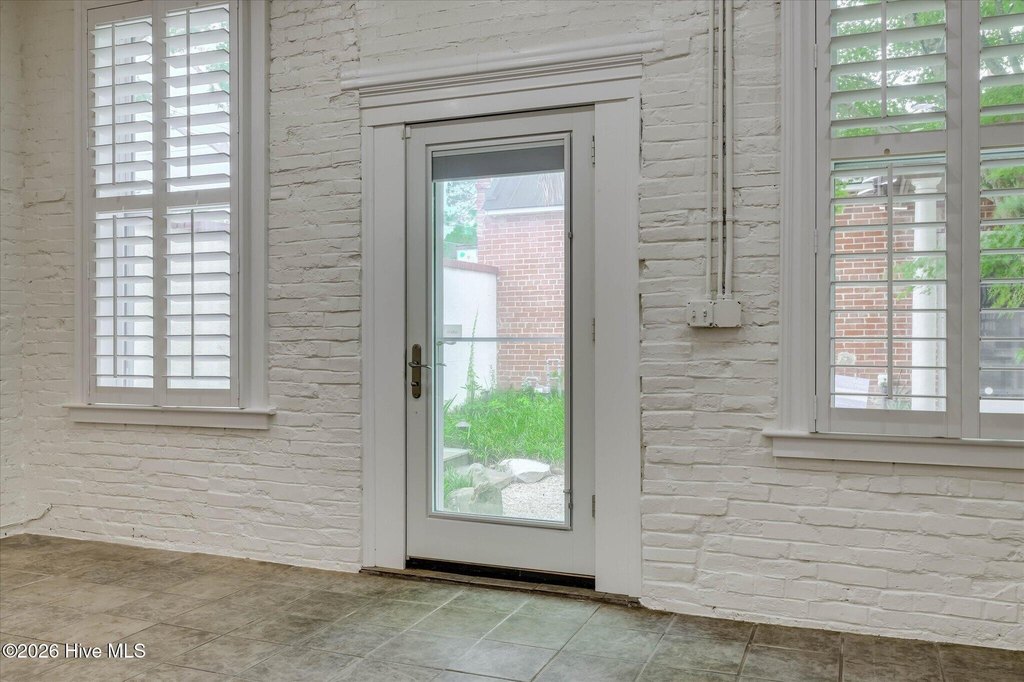
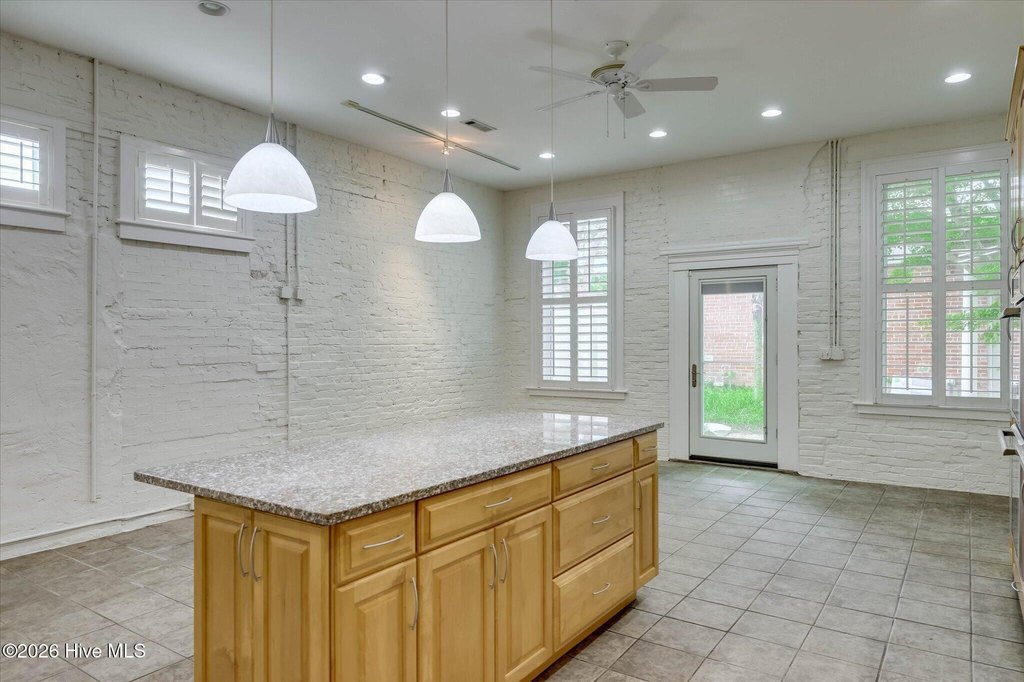
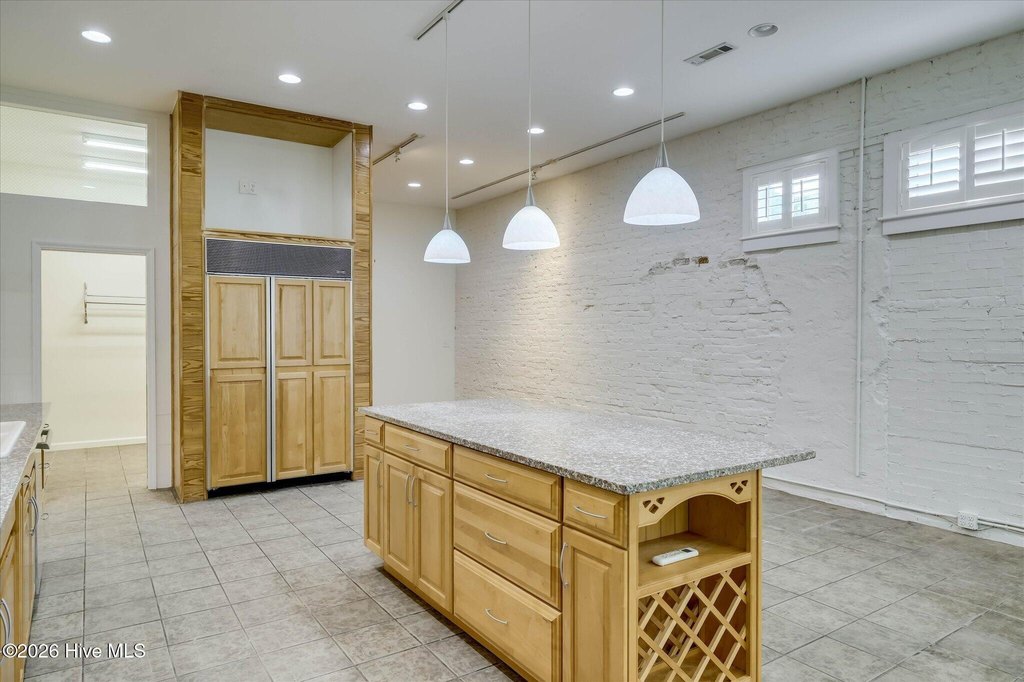
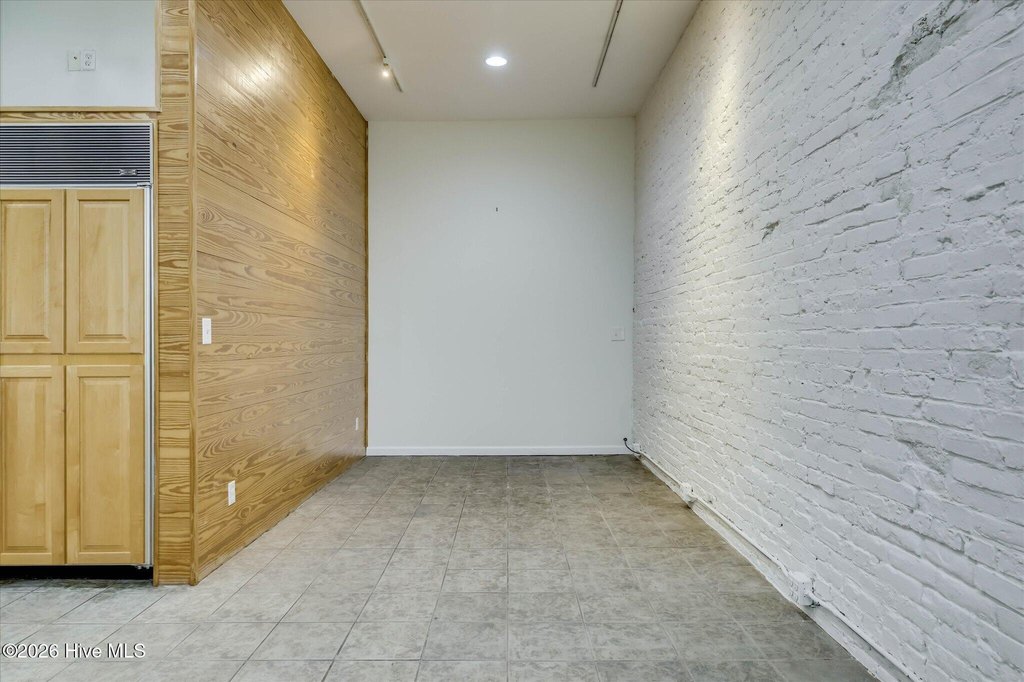
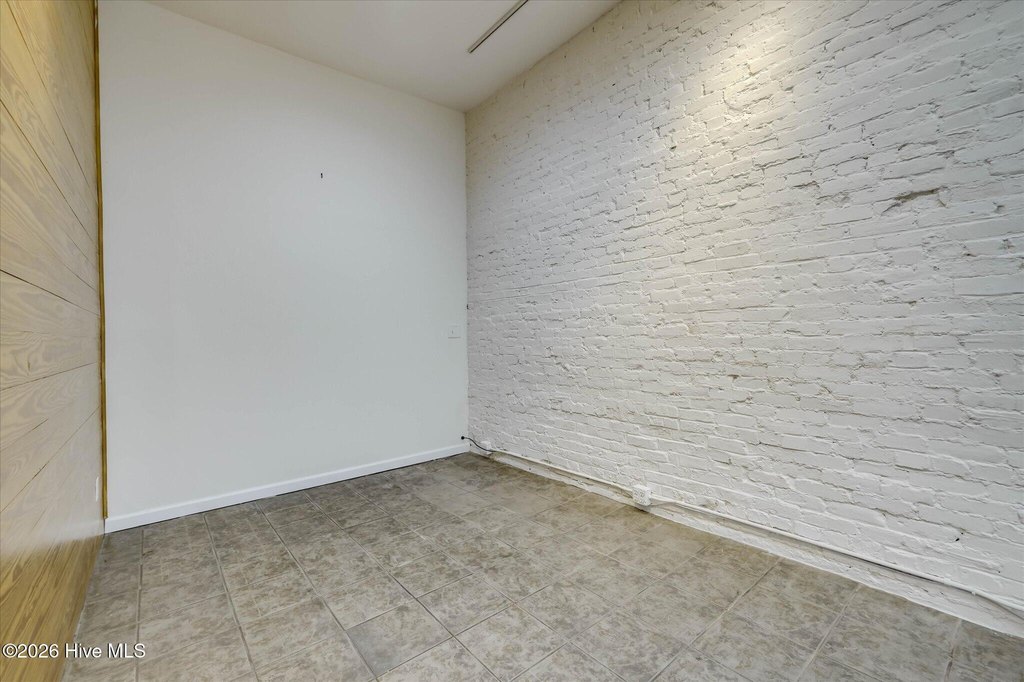
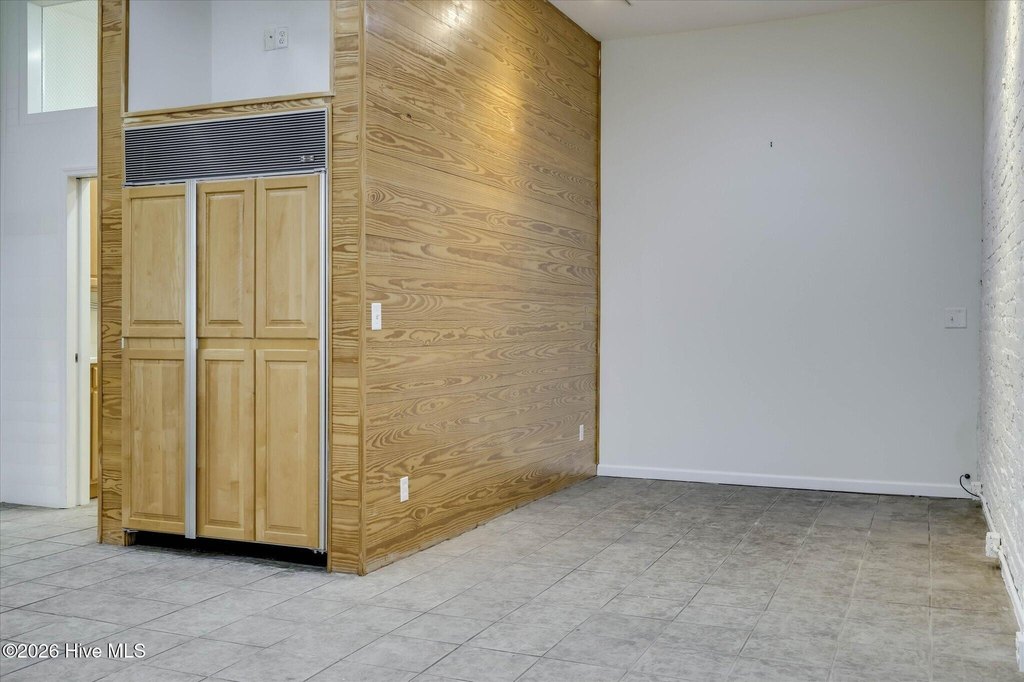
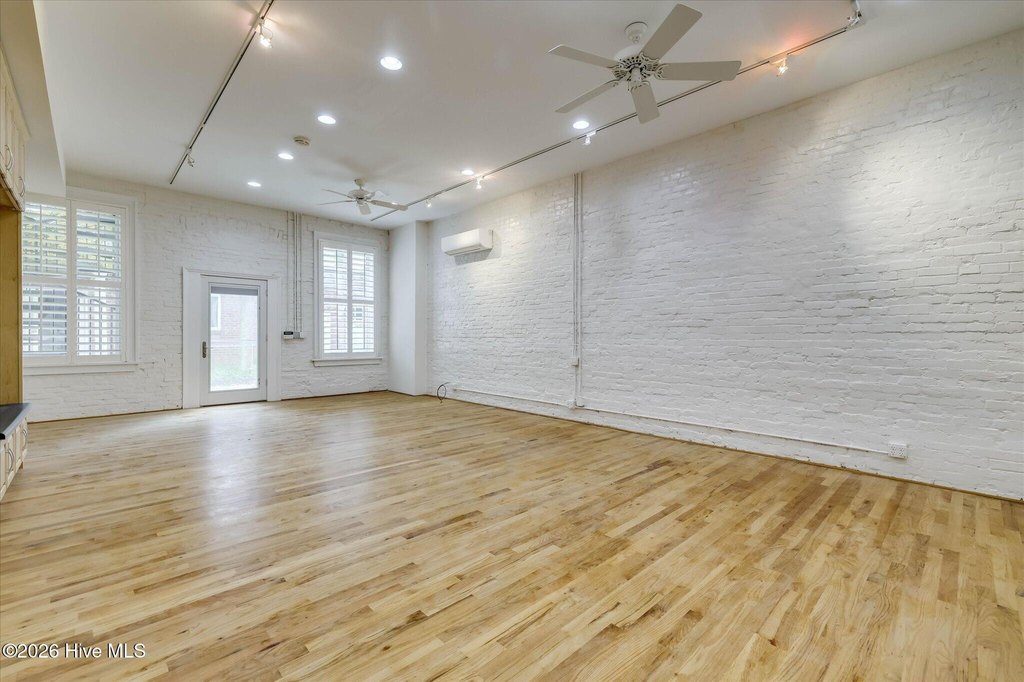
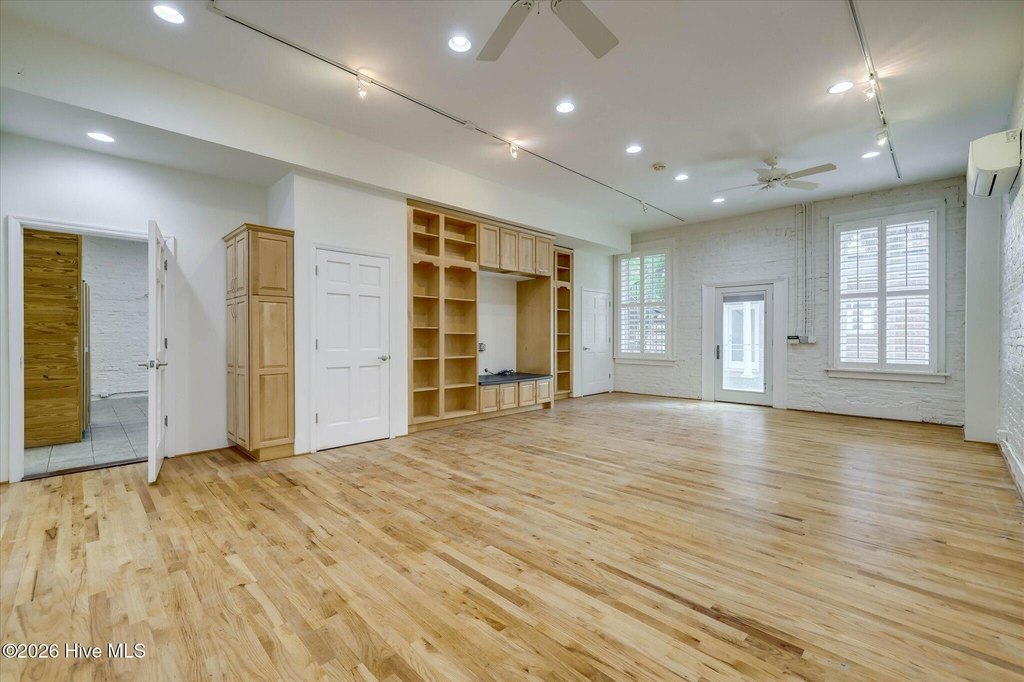
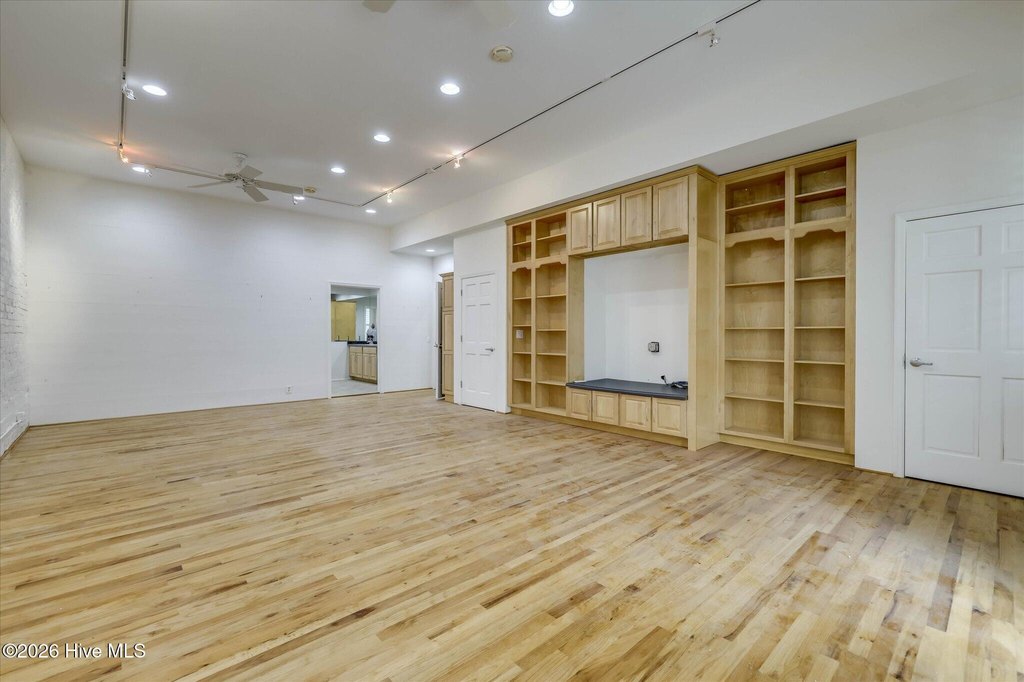
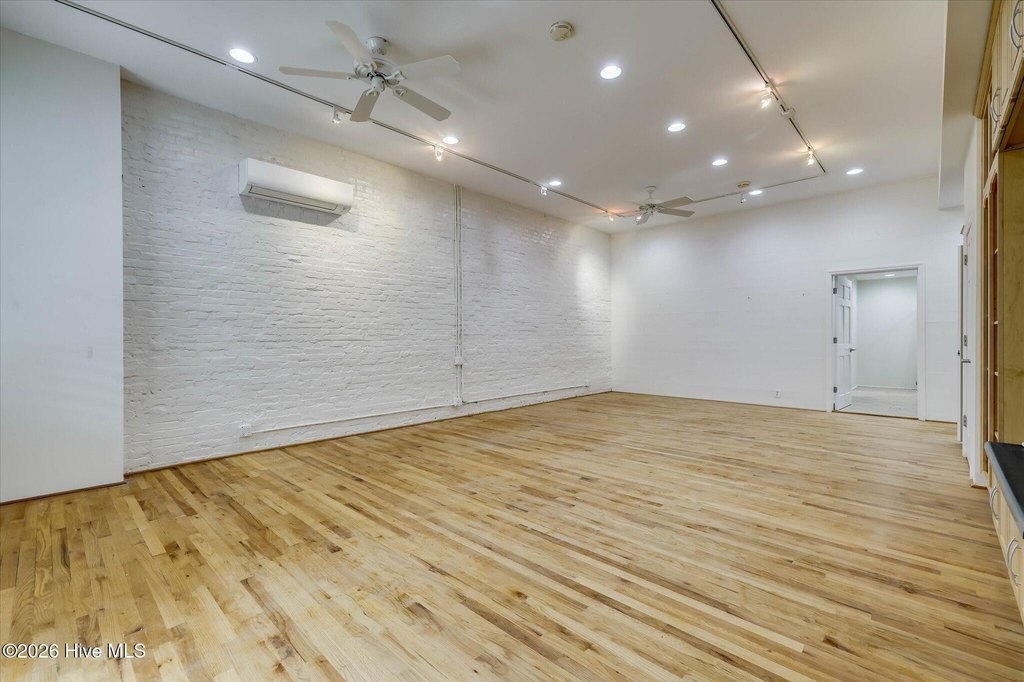
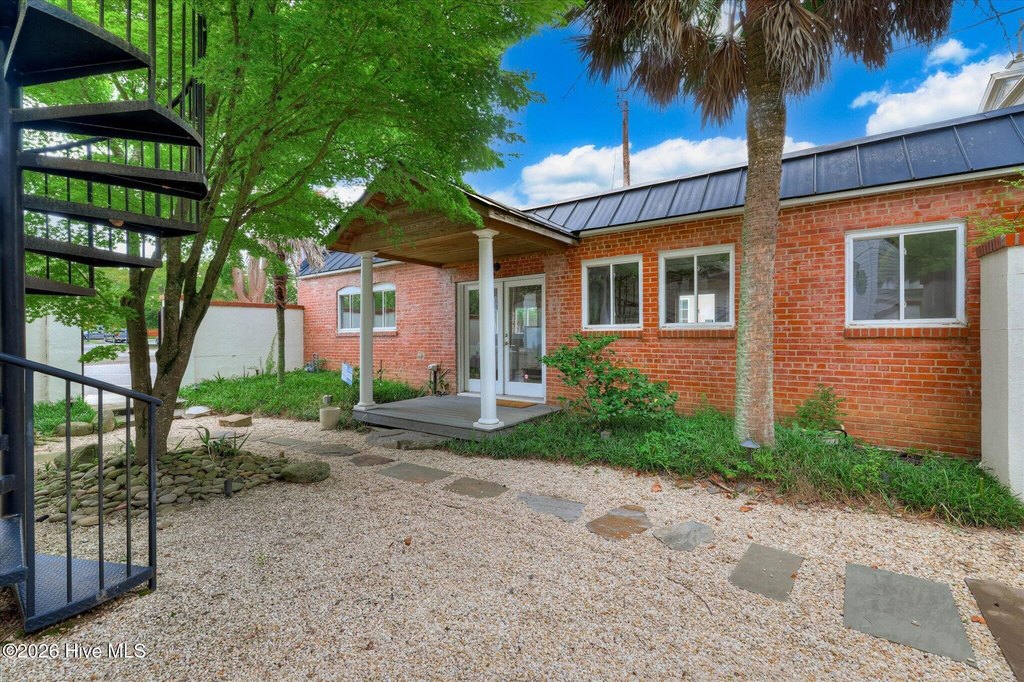
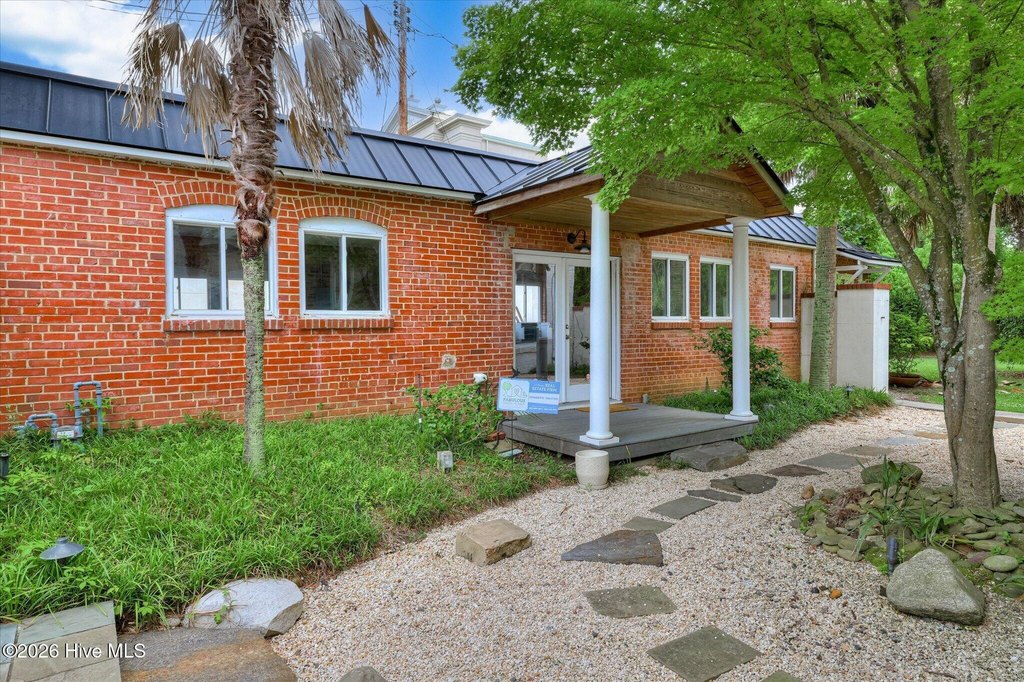
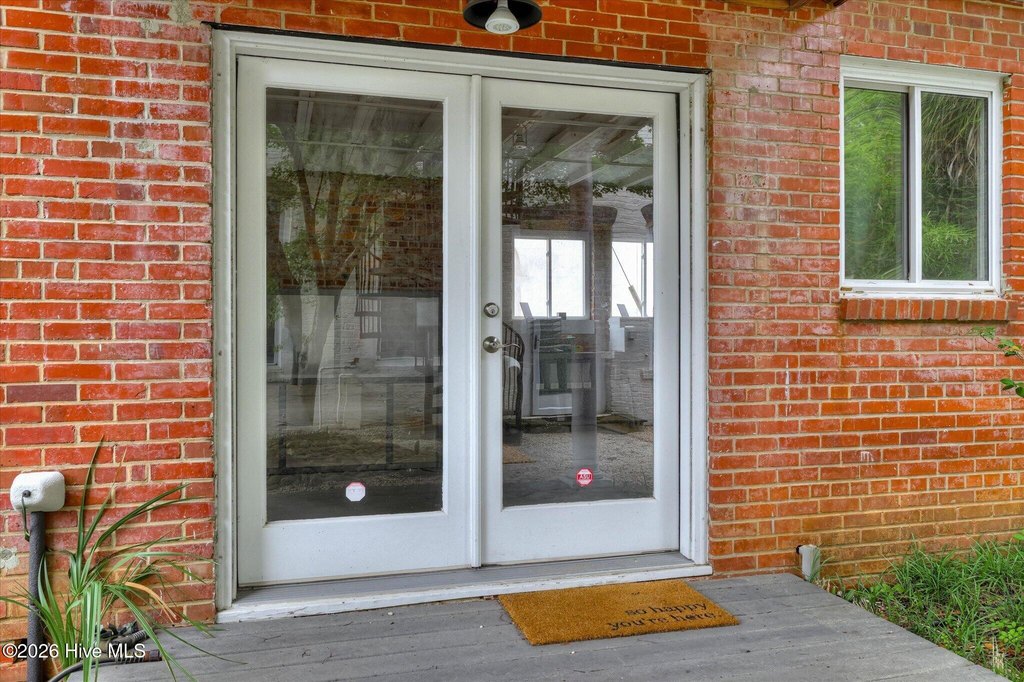
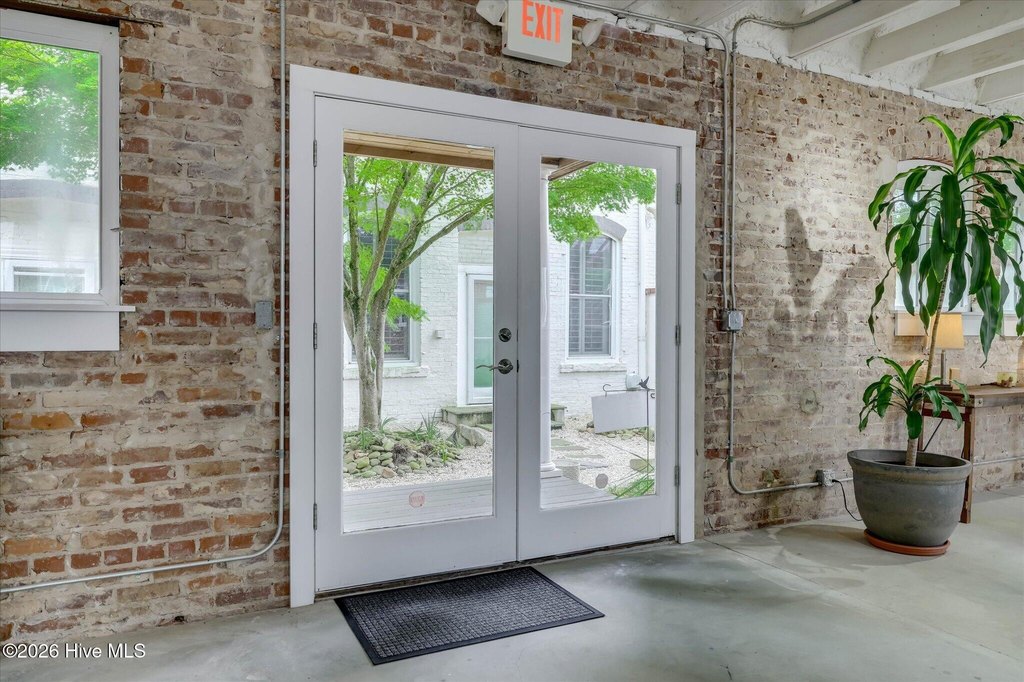
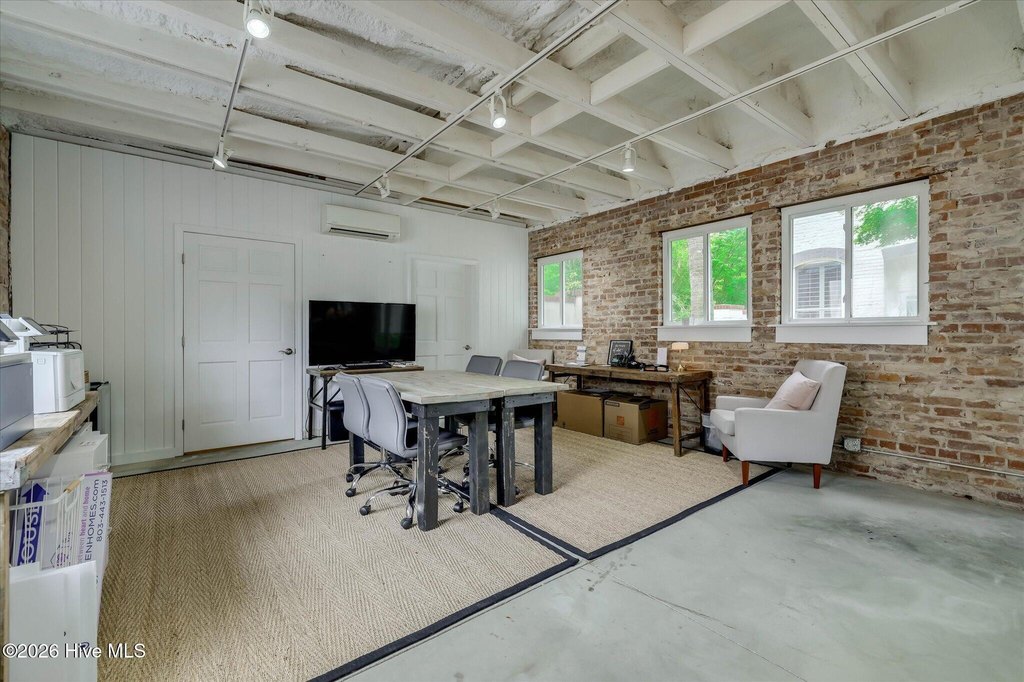
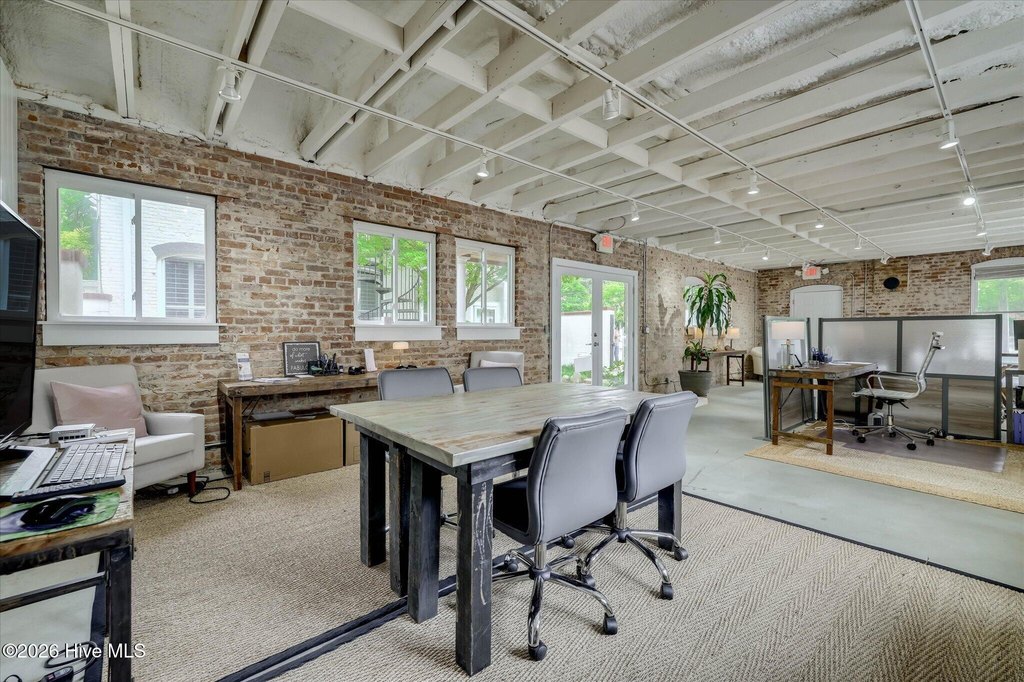
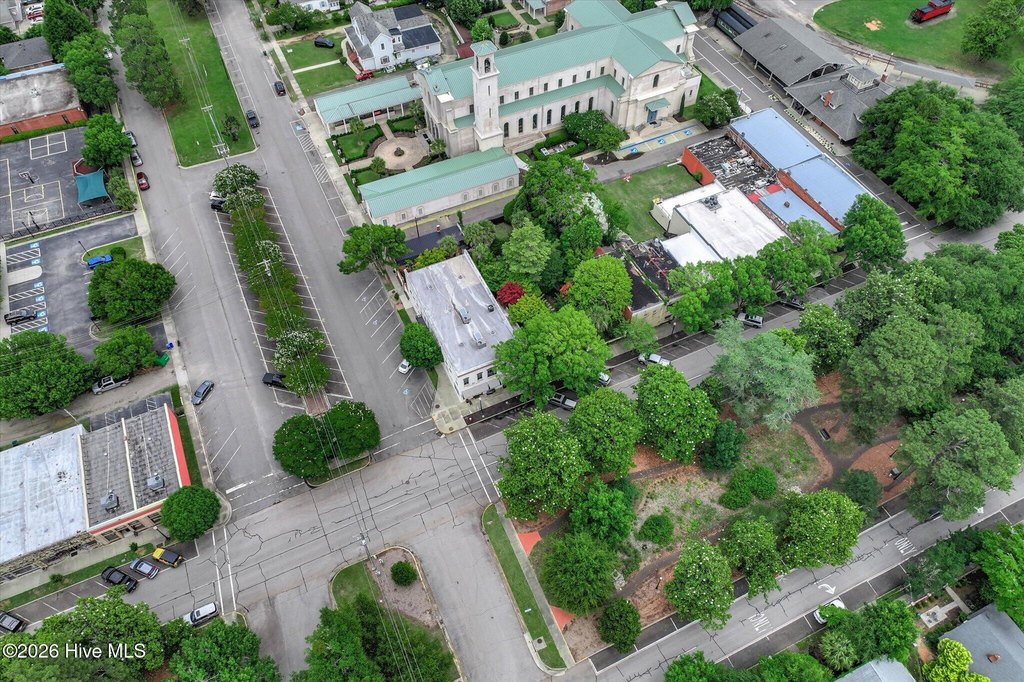
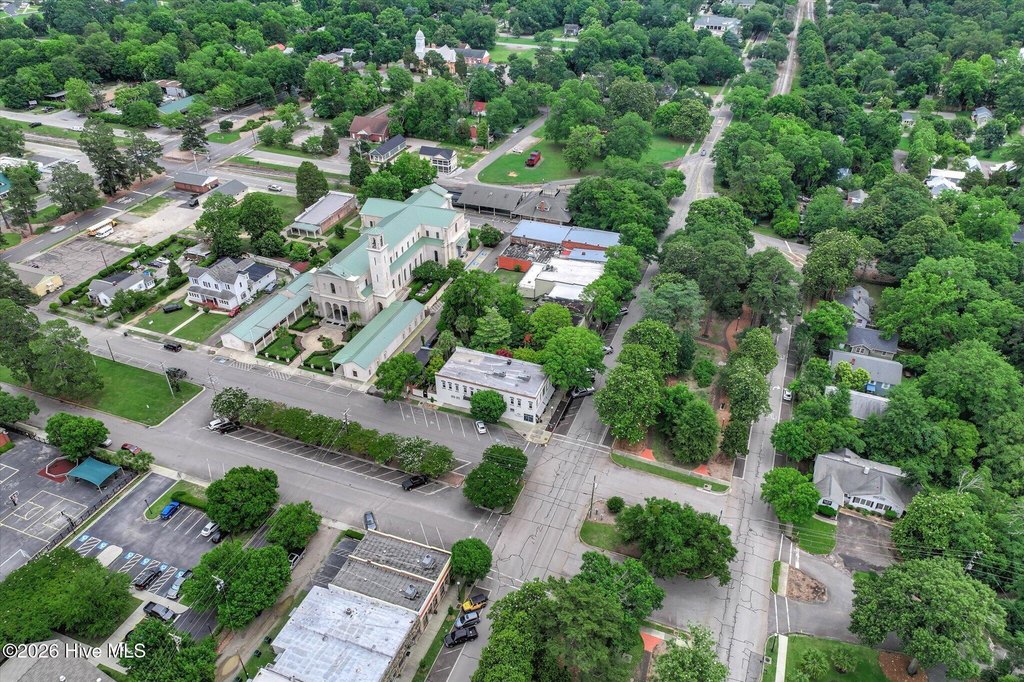
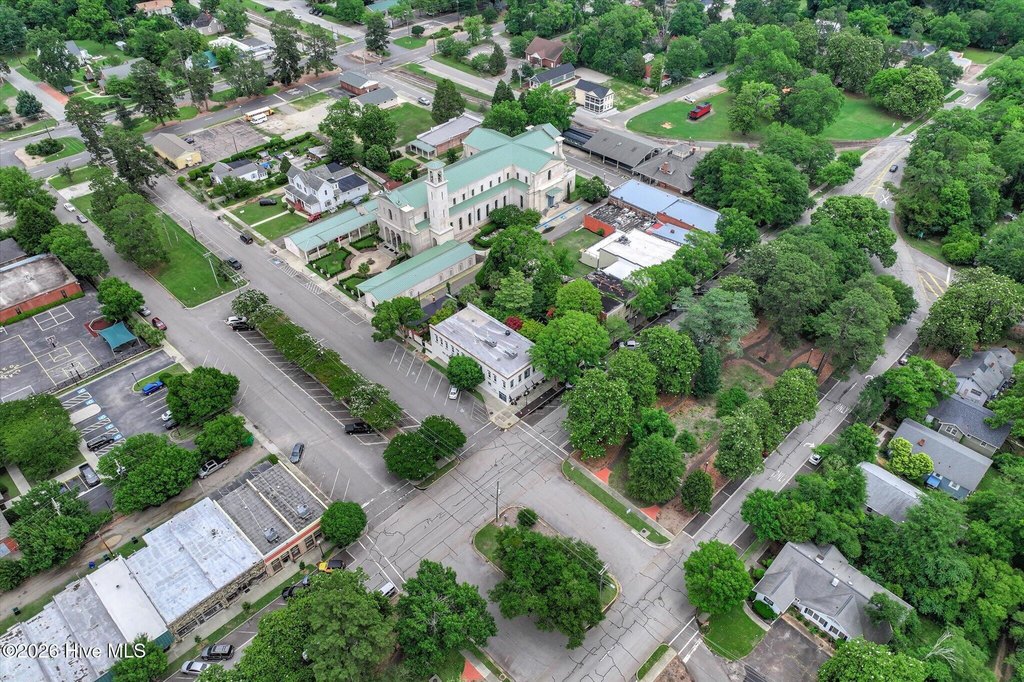
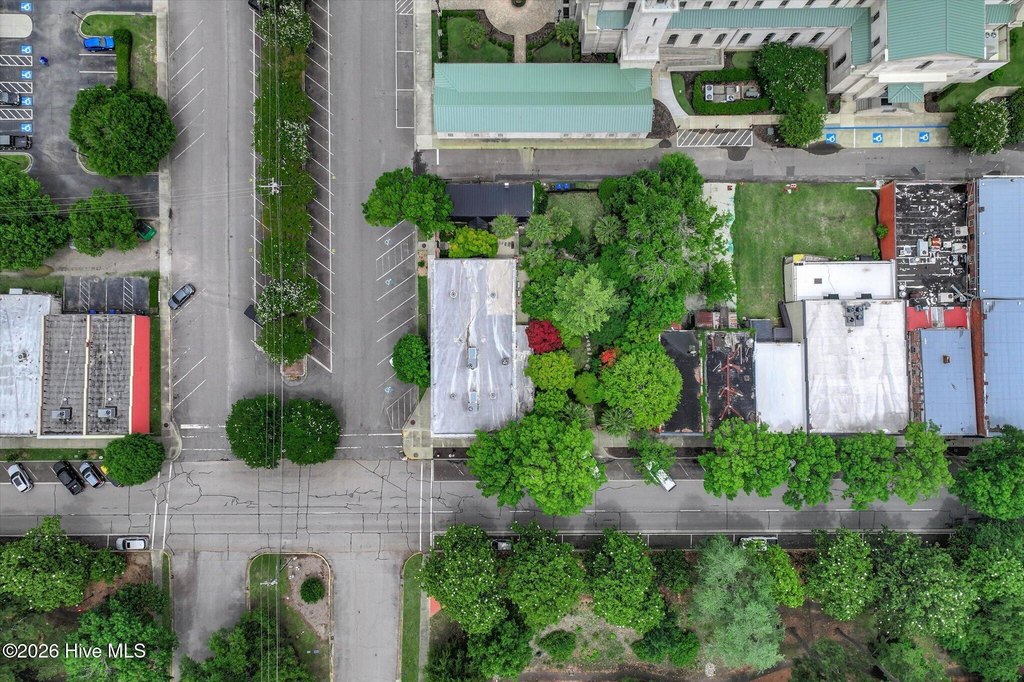
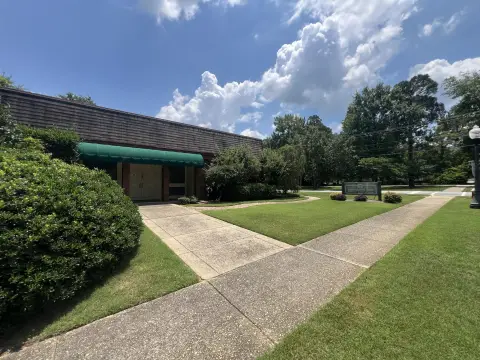
Additional components include an attached salon suite renovated in 2022, a street-level boutique renovated in 2023, and a detached annex currently configured as office space. The property features brick construction, exposed brick interiors, hardwood, tile, concrete, and carpet flooring, oversized windows, fireplaces, central air, zoned heating and cooling, and a garden courtyard. Located at 150 Fairfield Street SE in downtown Aiken, the property is zoned DB and includes public water, public sewer, off-street parking, and on-street parking.
Additional components include an attached salon suite renovated in 2022, a street-level boutique renovated in 2023, and a detached annex currently configured as office space. The property features brick construction, exposed brick interiors, hardwood, tile, concrete, and carpet flooring, oversized windows, fireplaces, central air, zoned heating and cooling, and a garden courtyard. Located at 150 Fairfield Street SE in downtown Aiken, the property is zoned DB and includes public water, public sewer, off-street parking, and on-street parking.
Key Highlights
- 8070‑square‑foot mixed‑use property on 0.14 acres
- Built in 1890 with brick construction and historic architectural details
- Two‑story law office, one‑bedroom condominium, salon suite, boutique, and detached annex
Financial Insights
Estimated NOI and Cap Rate
NOI / Yr
$83,252
Cap Rate
3.33%
Suggested Prices Based on Cap Rates
Cap Rate 5%
$1,665,040
$1.7M
Cap Rate 7%
$1,189,314
$1.2M
Cap Rate 9%
$925,022
$925.0K
Market Conditions
NOI Build-Up for 8,070 SF
Gross rent
$121.1K $15.00/SF
− Vacancy
−$10.0K −$1.25/SF
EGI
$111.0K $13.76/SF
− OpEx
−$27.8K −$3.44/SF
NOI
$83.3K $10.32/SF
Area
Aiken County, SC
Vacancy
8.30%
Lease Rate
$15.00 /SF/Yr
Expense Ratio
25.00%
Simulate Cap Rate and NOI
Suggested Prices Based on Cap Rates
Cap Rate 5%
$1,665,040
Cap Rate 7%
$1,189,314
Cap Rate 9%
$925,022
Alternative Uses
Best Use
Office B
$1.19M
$1.04M – $1.39M
NOI $83,252 @ 7.0% cap · market cap 3.33%
Second Best
Retail
$1.11M
$974.1K – $1.30M
NOI $77,929 @ 7.0% cap · market cap 3.12%
Theoretical Best
Office A
$1.56M
$1.36M – $1.81M
NOI $108,887 @ 7.0% cap · market cap 4.36%
Zoning and permitted uses should be independently verified with authorities.
How Realmo checks its estimates
Property Analytics
Unlock full access to Insights
Subscribe to Realmo Intelligence
Open Analytics
Current Use
Lease Details
2
Office units
Multi-tenant
Tenancy
Location Intelligence
Trade Area within ½ mile
1,066
Businesses Nearby
Explore this area
Business Placement
Demographics for 29801, SC
27,613
Population
13,543
Households
2
Avg Household Size
41
Median Age
28%
College-Educated
84%
High-School Grad
88.9 sq mi
ZIP Area
311
Density / Sq Mi
$55,032
Median Household Income
$36,804
Median Earnings
$1,070
Median Rent
$163,900
Median Home Value
Check the figures for this property
Cap Rate, Value Estimation, Potential NOI and more
View Realmo Analytics
Market
Vacancy Rate% for Office in South region

Questions? Ask Rey
Realmo’s AI knows this listing — price, zoning, demand, history. Ask anything.







Frequently Asked Questions
What type of property is this?
Mixed-use property - Adaptable downtown asset combining offices, retail suites, a salon, condominium, and detached annex space.
Where is this mixed-use property located?
The property is located at 150 Fairfield Street SE Aiken, SC.
What is the asking price?
The asking price for this property is $2,500,000.
What are key features of this property?
This property features: 8070‑square‑foot mixed‑use property on 0.14 acres; Built in 1890 with brick construction and historic architectural details; Two‑story law office, one‑bedroom condominium, salon suite, boutique, and detached annex


