Vacant Edwardian
For Sale
$3,825,000
149-153 Buchanan Street San, San Francisco, CA 94102
Three full-floor flats retain period character, with in-unit laundry and a garden-level bonus apartment.
Property Size5,427 SF
Price / SF$704.81
Days on Market230
Property Features for 149-153 Buchanan Street San
General Information
Standard status
Active
Size
5,427 SF
Total Parking Spaces
2
Property subtype
Triplex
Site & Location
Highway Access
Yes
Public Transit
Yes
Units
Unit Mix
1 x 2BR+den/2BA, 2 x 3BR/2BA, 1 x studio/1BA
Multifamily Units
4
Amenities
in-unit laundry
landscaped rear garden
fireplaces
Fireplace
Security System
Central
Fireplace(s)
Dishwasher
Disposal
Free-Standing Gas Oven
Free-Standing Gas Range
Free-Standing Refrigerator
Gas Water Heater
Varies By Unit
Patio, Porch, Tar/Gravel
Building Details
Building Size
5,427 SF
Year Built
1911
Buildings
1
Construction
Edwardian
Listing Agency:
Sotheby's International Realty
Listed By:
Marla Moresi-Valdes · License #01320998
(415) 971-2535
Source:
Kw
Added: Feb 27
Changed: Oct 13
Last Checked: Oct 12 at 5:28PM
Displayed information is deemed reliable but is not guaranteed and should be independently verified. All listing content including descriptions, pricing, images are the copyrighted material of Sotheby's International Realty
Investment Insights
Based on property information with market context.
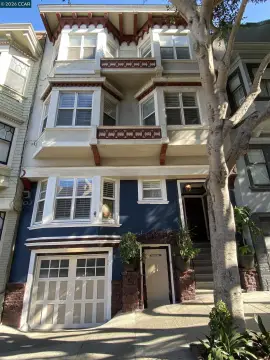
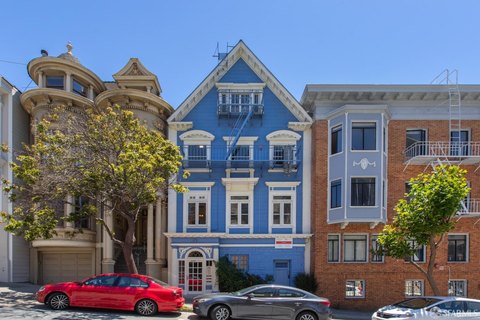
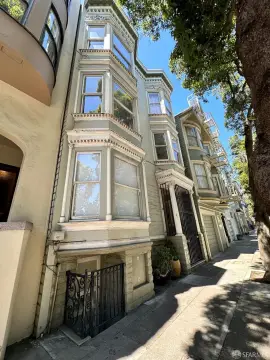
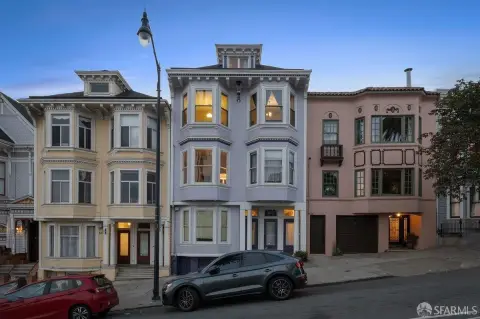
This 1911 Edwardian triplex contains approximately 5,427 +/- square feet across three vacant, full-floor residences. The lower flat measures 1,492 SF and includes two bedrooms plus a den; the middle flat offers three bedrooms in 1,680 SF; and the upper flat provides three bedrooms across 1,792 SF. Each residence features 10-foot ceilings, curved bay windows, refurbished hardwood floors, formal living and dining rooms with fireplaces, and period details including pocket doors, coved ceilings, millwork, and wainscoting. In-unit laundry is provided throughout.
The middle residence has a renovated kitchen with marble countertops, custom and refurbished vintage cabinetry, open shelving, a subway-tile backsplash, Fisher & Paykel refrigerator, Miele dishwasher, and O’Keefe & Merritt range. Recent work includes updated lighting and electrical systems, refinished floors, stairway carpeting, and custom paint. A garden-level bonus apartment includes an eat-in kitchen, open living/bedroom area, full bathroom, and access to a landscaped rear garden with stone patio. The garage provides storage and one-two car parking, with potential for three-car parking through reconfiguration. The property also offers access to public transportation, Highway 101, and the Bay Bridge.
The middle residence has a renovated kitchen with marble countertops, custom and refurbished vintage cabinetry, open shelving, a subway-tile backsplash, Fisher & Paykel refrigerator, Miele dishwasher, and O’Keefe & Merritt range. Recent work includes updated lighting and electrical systems, refinished floors, stairway carpeting, and custom paint. A garden-level bonus apartment includes an eat-in kitchen, open living/bedroom area, full bathroom, and access to a landscaped rear garden with stone patio. The garage provides storage and one-two car parking, with potential for three-car parking through reconfiguration. The property also offers access to public transportation, Highway 101, and the Bay Bridge.
Key Highlights
- Three vacant full‑floor flats totaling approximately 5,427 +/- SF
- 1911 Edwardian building with 10‑foot ceilings, curved bay windows, fireplaces, and period millwork
- Lower, middle, and upper flats measure 1,492 SF, 1,680 SF, and 1,792 SF
Financial Insights
Estimated NOI and Cap Rate
NOI / Yr
$192,873
Cap Rate
5.04%
Suggested Prices Based on Cap Rates
Cap Rate 5%
$3,857,460
$3.9M
Cap Rate 7%
$2,755,329
$2.8M
Cap Rate 9%
$2,143,033
$2.1M
Market Conditions
NOI Build-Up for 5,427 SF
Gross rent
$293.1K $54.00/SF
− Vacancy
−$17.5K −$3.23/SF
EGI
$275.5K $50.77/SF
− OpEx
−$82.7K −$15.23/SF
NOI
$192.9K $35.54/SF
Area
San Francisco, CA
Vacancy
5.98%
Lease Rate
$54.00 /SF/Yr
Expense Ratio
30.00%
Simulate Cap Rate and NOI
Suggested Prices Based on Cap Rates
Cap Rate 5%
$3,857,460
Cap Rate 7%
$2,755,329
Cap Rate 9%
$2,143,033
Alternative Uses
Best Use
Multifamily LT 5
$2.76M
$2.41M – $3.21M
NOI $192,873 @ 7.0% cap · market cap 5.04%
Second Best
Apartment 5plus
$2.52M
$2.20M – $2.94M
NOI $176,199 @ 7.0% cap · market cap 4.61%
Theoretical Best
Specialty Retail
$26.51M
$23.20M – $30.93M
NOI $1,855,607 @ 7.0% cap · market cap 48.51%
Zoning and permitted uses should be independently verified with authorities.
How Realmo checks its estimates
Property Analytics
Current Use
Lease Details
4
Residential units
Yes
Highway access
Location Intelligence
Trade Area within ½ mile
8,600
Businesses Nearby
Explore this area
Business Placement
Demographics for 94102, CA
39,432
Population
23,153
Households
1.7
Avg Household Size
40
Median Age
42%
College-Educated
81%
High-School Grad
0.7 sq mi
ZIP Area
56,331
Density / Sq Mi
$64,781
Median Household Income
$55,873
Median Earnings
$1,517
Median Rent
$996,300
Median Home Value
Market
Vacancy Rate% for Multifamily in West region

Questions? Ask Rey
Realmo’s AI knows this listing — price, zoning, demand, history. Ask anything.







Frequently Asked Questions
What type of property is this?
Triplex - Three full-floor flats retain period character, with in-unit laundry and a garden-level bonus apartment.
Where is this triplex located?
The property is located at 149-153 Buchanan Street San San Francisco, CA.
What is the asking price?
The asking price for this property is $3,825,000.
What are key features of this property?
This property features: Three vacant full‑floor flats totaling approximately 5,427 +/- SF; 1911 Edwardian building with 10‑foot ceilings, curved bay windows, fireplaces, and period millwork; Lower, middle, and upper flats measure 1,492 SF, 1,680 SF, and 1,792 SF


