Versatile Mixed-Use Property in Van
For Sale
Contact for pricing
14518 Erwin St, Los Angeles, CA 91411
LAC2-zoned property suitable for retail, office, industrial, or residential uses.
Property Size5,000 SF
Price / SF$390
Days on Market964
Property Features for 14518 Erwin St
General Information
Standard status
Active
Size
5,000 SF
Class
C
Property subtype
Industrial, Mixed Use, Retail
Zoning
LAC2
Investment Type
Owner/User
Building Details
Year Built
1929
Buildings
1
Stories
1
Listing Agency:
Peak Commercial
Listed By:
William White · License #CA 01970431
Source:
Crexi
Added: Feb 23, 2024
Changed: Sep 14
Last Checked: Oct 12 at 7:13PM
Displayed information is deemed reliable but is not guaranteed and should be independently verified. All listing content including descriptions, pricing, images are the copyrighted material of Peak Commercial
Investment Insights
Based on property information with market context.
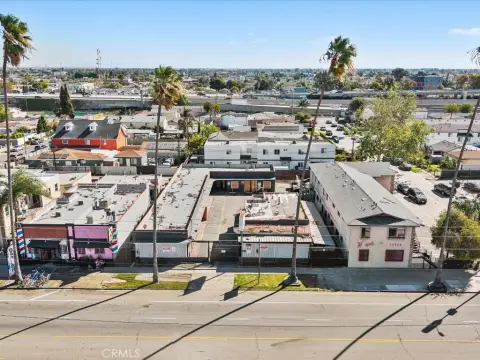
This LAC2-zoned property offers flexibility for an owner-user, with permitted uses including retail, office, industrial, and residential-related operations. The property features refinished floors for a showroom finish. Previously used as a cannabis retail location, the property is currently 100% vacant. It includes 2 secure entrances and a gated back lot providing space for 4 or more parking spaces. Situated steps from the Van Nuys Courthouse and Van Nuys Blvd, the site benefits from a visible and central position in the Van Nuys Civic Center area. Additional conveniences include a public parking lot directly across the street and dual alleyway access, enhancing accessibility and operational efficiency. The property size is 5000 square feet.
Key Highlights
- High‑visibility location in the Van Nuys Civic Center area, steps from the Van Nuys Courthouse and Van Nuys Blvd.
- Flexible LAC2 zoning permits retail, office, industrial, and residential‑related uses.
- 100% vacant, offering immediate owner‑user or investment opportunity.
Financial Insights
Estimated NOI and Cap Rate
NOI / Yr
$101,250
Cap Rate
5.19%
Suggested Prices Based on Cap Rates
Cap Rate 5%
$2,025,000
$2.0M
Cap Rate 7%
$1,446,429
$1.4M
Cap Rate 9%
$1,125,000
$1.1M
Market Conditions
NOI Build-Up for 5,000 SF
Gross rent
$180.0K $36.00/SF
− Vacancy
−$18.0K −$3.60/SF
EGI
$162.0K $32.40/SF
− OpEx
−$60.8K −$12.15/SF
NOI
$101.3K $20.25/SF
Area
Los Angeles, CA
Vacancy
10.00%
Lease Rate
$36.00 /SF/Yr
Expense Ratio
37.50%
Simulate Cap Rate and NOI
Suggested Prices Based on Cap Rates
Cap Rate 5%
$2,025,000
Cap Rate 7%
$1,446,429
Cap Rate 9%
$1,125,000
Alternative Uses
Best Use
Mixed Use
$1.45M
$1.27M – $1.69M
NOI $101,250 @ 7.0% cap · market cap 5.19%
Second Best
—
—
no second resolved use
Theoretical Best
Multifamily LT 5
$101.30M
$88.63M – $118.18M
NOI $7,090,790 @ 7.0% cap · market cap 363.63%
Zoning and permitted uses should be independently verified with authorities.
How Realmo checks its estimates
Property Analytics
Unlock full access to Insights
Subscribe to Realmo Intelligence
Open Analytics
Current Use
Location Intelligence
Trade Area within ½ mile
3,702
Businesses Nearby
Explore this area
Business Placement
Demographics for 91411, CA
24,984
Population
10,003
Households
2.5
Avg Household Size
36
Median Age
37%
College-Educated
80%
High-School Grad
2.0 sq mi
ZIP Area
12,492
Density / Sq Mi
$77,582
Median Household Income
$42,096
Median Earnings
$1,850
Median Rent
$973,300
Median Home Value
Check the figures for this property
Cap Rate, Value Estimation, Potential NOI and more
View Realmo Analytics

Questions? Ask Rey
Realmo’s AI knows this listing — price, zoning, demand, history. Ask anything.




Frequently Asked Questions
What type of property is this?
Mixed-use property - LAC2-zoned property suitable for retail, office, industrial, or residential uses.
Where is this mixed-use property located?
The property is located at 14518 Erwin St Los Angeles, CA.
What is the asking price?
The asking price for this property is $1,950,000.
What are key features of this property?
This property features: High‑visibility location in the Van Nuys Civic Center area, steps from the Van Nuys Courthouse and Van Nuys Blvd.; Flexible LAC2 zoning permits retail, office, industrial, and residential‑related uses.; 100% vacant, offering immediate owner‑user or investment opportunity.


