Versatile Commercial Property in Los
For Sale
$1,499,000
2655 Short Street, Los Angeles, CA 90023
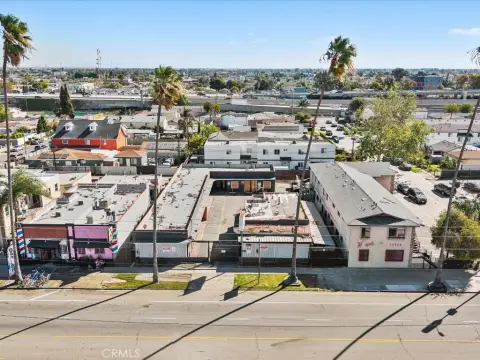
Free-standing commercial property in a dynamic Los Angeles neighborhood.
Property Size4,382 SF
Lot Size0.16 Acres
Price / SF$342.08
Days on Market535
Property Features for 2655 Short Street
General Information
Standard status
Active
Size
4,382 SF
Lot size
0.16 Acres
Property subtype
Office
Building Details
Building Size
4,382 SF
Year Built
1946
Listing Agency:
Century 21 Masters
Listed By:
Tess Marquez · License #01229490
(626) 712-5156
Source:
Archetyperealty
Added: Apr 21, 2025
Changed: Sep 24
Last Checked: Oct 6 at 12:43AM
Displayed information is deemed reliable but is not guaranteed and should be independently verified. All listing content including descriptions, pricing, images are the copyrighted material of Century 21 Masters
Investment Insights
Based on property information with market context.
This free-standing commercial property is located in a dynamic and fast-growing neighborhood of Los Angeles. The building, which measures approximately 4,382 square feet, is situated on a 7,001 square foot lot. Currently, the property is configured into four tenant-occupied units, generating income. The zoning is for light manufacturing, but the property also offers flexible potential uses such as retail, restaurant, automotive, fitness, or creative space. Buyers should verify potential uses with the city. The adaptable layout makes it appealing for investors seeking long-term returns or owner-users looking to establish their business in a high-demand location. This property represents both stability and growth potential as Boyle Heights continues to evolve as a hub for commerce, culture, and development.
Key Highlights
- Free‑standing commercial property in a dynamic, fast‑growing Los Angeles neighborhood (Boyle Heights).
- Currently configured as four tenant‑occupied units generating steady income.
- Zoned for light manufacturing with flexible potential uses (retail, restaurant, automotive, fitness, creative space).
Financial Insights
Estimated NOI and Cap Rate
NOI / Yr
$118,675
Cap Rate
7.92%
Suggested Prices Based on Cap Rates
Cap Rate 5%
$2,373,500
$2.4M
Cap Rate 7%
$1,695,357
$1.7M
Cap Rate 9%
$1,318,611
$1.3M
Market Conditions
NOI Build-Up for 4,382 SF
Gross rent
$162.0K $36.96/SF
− Vacancy
−$3.7K −$0.85/SF
EGI
$158.2K $36.11/SF
− OpEx
−$39.6K −$9.03/SF
NOI
$118.7K $27.08/SF
Area
Los Angeles, CA
Vacancy
2.30%
Lease Rate
$36.96 /SF/Yr
Expense Ratio
25.00%
Simulate Cap Rate and NOI
Suggested Prices Based on Cap Rates
Cap Rate 5%
$2,373,500
Cap Rate 7%
$1,695,357
Cap Rate 9%
$1,318,611
Alternative Uses
Best Use
Specialty Retail
$1.70M
$1.48M – $1.98M
NOI $118,675 @ 7.0% cap · market cap 7.92%
Second Best
Retail
$1.45M
$1.27M – $1.69M
NOI $101,694 @ 7.0% cap · market cap 6.78%
Theoretical Best
Multifamily LT 5
$88.78M
$77.68M – $103.57M
NOI $6,214,368 @ 7.0% cap · market cap 414.57%
Zoning and permitted uses should be independently verified with authorities.
Property Analytics
Unlock full access to Insights
Subscribe to Realmo Intelligence
Open Analytics
Current Use
Location Intelligence
Trade Area within ½ mile
1,987
Businesses Nearby
Explore this area
Business Placement
Demographics for 90023, CA
45,939
Population
12,319
Households
3.7
Avg Household Size
32
Median Age
10%
College-Educated
53%
High-School Grad
4.3 sq mi
ZIP Area
10,683
Density / Sq Mi
$56,623
Median Household Income
$30,967
Median Earnings
$1,414
Median Rent
$617,600
Median Home Value
Check the figures for this property
Cap Rate, Value Estimation, Potential NOI and more
View Realmo Analytics
Market
Vacancy Rate% for Retail in Los Angeles, CA

Questions? Ask Rey
Realmo’s AI knows this listing — price, zoning, demand, history. Ask anything.




Frequently Asked Questions
What type of property is this?
Mixed-use property - Free-standing commercial property in a dynamic Los Angeles neighborhood.
Where is this mixed-use property located?
The property is located at 2655 Short Street Los Angeles, CA.
What is the asking price?
The asking price for this property is $1,499,000.
What are key features of this property?
This property features: Free‑standing commercial property in a dynamic, fast‑growing Los Angeles neighborhood (Boyle Heights).; Currently configured as four tenant‑occupied units generating steady income.; Zoned for light manufacturing with flexible potential uses (retail, restaurant, automotive, fitness, creative space).



