Triplex with Individual
For Sale
$710,000
1443-47 San Rocco Circle, Stockton, CA 95207
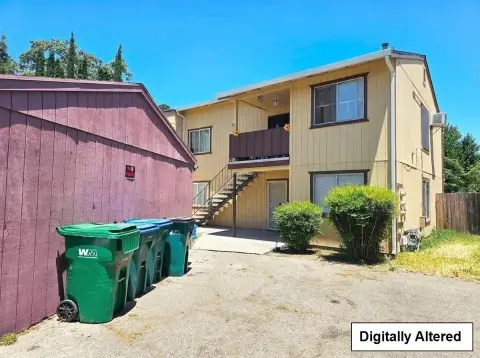
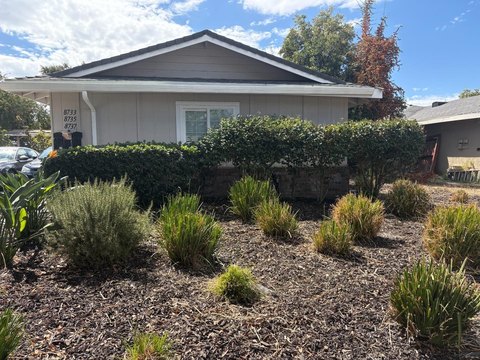
Three residential units include individual garages, private outdoor areas, and in-unit laundry equipment.
Property Size3,518 SF
Price / SF$201.82
Days on Market255
Property Features for 1443-47 San Rocco Circle
General Information
Standard status
Active
Size
3,518 SF
Property subtype
Triplex
Amenities
individual garages
central heating and cooling
backyard spaces
Cable Ready
Evaporative Cooling
Ceiling Fan(s)
Forced Air
Dryer
Washer
Gas Water Heater
Cable TV, Wired For, Individual Electric Meter, Individual Gas Meter
Building Details
Building Size
3,518 SF
Year Built
1977
Listing Agency:
Epique Realty
Listed By:
Grant Inaba
(888) 893-3537
Source:
Kw
Added: Feb 3
Changed: Oct 15
Last Checked: Oct 14 at 7:38PM
Displayed information is deemed reliable but is not guaranteed and should be independently verified. All listing content including descriptions, pricing, images are the copyrighted material of Epique Realty

Ask AI about this property
Review the available facts, identify missing information and prepare questions for the agent.
Investment Insights
Based on property information with market context.
Built in 1977, this triplex at 1443-47 San Rocco Circle contains 3,518 square feet of living space across three residential units. The property includes a combined 7 bedrooms and 6 bathrooms, with individual garages, backyard areas, and living spaces designed for residential use. Heating and cooling features include forced air, evaporative cooling, and ceiling fans, while gas water heaters and separate electric and gas meters serve the property.
Additional interior features include washer and dryer appliances, cable-ready connectivity, and cable wiring. The Stockton, CA address places the property near schools, local amenities, and transportation options, as identified in the property information.
Additional interior features include washer and dryer appliances, cable-ready connectivity, and cable wiring. The Stockton, CA address places the property near schools, local amenities, and transportation options, as identified in the property information.
Key Highlights
- 3,518 square feet of living space across a three‑unit property
- Combined 7 bedrooms and 6 bathrooms
- Built in 1977
Financial Insights
Estimated NOI and Cap Rate
NOI / Yr
$51,827
Cap Rate
7.30%
Suggested Prices Based on Cap Rates
Cap Rate 5%
$1,036,540
$1.0M
Cap Rate 7%
$740,386
$740.4K
Cap Rate 9%
$575,856
$575.9K
Market Conditions
NOI Build-Up for 3,518 SF
Gross rent
$78.1K $22.20/SF
− Vacancy
−$4.1K −$1.15/SF
EGI
$74.0K $21.05/SF
− OpEx
−$22.2K −$6.31/SF
NOI
$51.8K $14.73/SF
Area
ZIP 95207
Vacancy
5.20%
Lease Rate
$22.20 /SF/Yr
Expense Ratio
30.00%
Simulate Cap Rate and NOI
Suggested Prices Based on Cap Rates
Cap Rate 5%
$1,036,540
Cap Rate 7%
$740,386
Cap Rate 9%
$575,856
Alternative Uses
Best Use
Multifamily LT 5
$740.4K
$647.8K – $863.8K
NOI $51,827 @ 7.0% cap · market cap 7.30%
Second Best
Apartment 5plus
$680.2K
$595.2K – $793.6K
NOI $47,614 @ 7.0% cap · market cap 6.71%
Theoretical Best
Office A
$1.17M
$1.02M – $1.36M
NOI $81,730 @ 7.0% cap · market cap 11.51%
Zoning and permitted uses should be independently verified with authorities.
How Realmo checks its estimates
Property Analytics
Current Use
Location Intelligence
Trade Area within ½ mile
1,390
Businesses Nearby
Explore this area
Business Placement
Demographics for 95207, CA
52,465
Population
20,300
Households
2.6
Avg Household Size
34
Median Age
20%
College-Educated
83%
High-School Grad
7.2 sq mi
ZIP Area
7,287
Density / Sq Mi
$68,767
Median Household Income
$38,463
Median Earnings
$1,549
Median Rent
$409,000
Median Home Value
Market
Vacancy Rate% for Multifamily in West region






Frequently Asked Questions
What type of property is this?
Triplex - Three residential units include individual garages, private outdoor areas, and in-unit laundry equipment.
Where is this triplex located?
The property is located at 1443-47 San Rocco Circle Stockton, CA.
What is the asking price?
The asking price for this property is $710,000.
What are key features of this property?
This property features: 3,518 square feet of living space across a three‑unit property; Combined 7 bedrooms and 6 bathrooms; Built in 1977


