Climate-Controlled
For Sale
$1,850,000
1430 N Willis Dr, Bloomington, IN 47404
Industrial building with loading dock access, three restrooms, and parking.
Property Size15,400 SF
Price / SF$120.13
Days on Market55
Property Features for 1430 N Willis Dr
General Information
Standard status
Active
Size
15,400 SF
Building Details
Year Built
1958
Listing Agency:
Owens Realty Group
Listed By:
Scott Owens · License #RB14023735
(812) 322-6888
Source:
Kmsrealestategroup
Added: Aug 23
Changed: Oct 2
Last Checked: Oct 7 at 1:46PM
Displayed information is deemed reliable but is not guaranteed and should be independently verified. All listing content including descriptions, pricing, images are the copyrighted material of Owens Realty Group

Ask AI about this property
Review the available facts, identify missing information and prepare questions for the agent.
Investment Insights
Based on property information with market context.
This 15,400-square-foot warehouse at 1430 N Willis Dr includes climate-controlled space, three restrooms, an exterior loading dock, and garage door access. The 1958 building also provides ample parking and room for expansion.
The property is in Bloomington, close to Indiana University and downtown. Its existing loading infrastructure, temperature-controlled interior, and expansion area support a range of storage and commercial uses.
The property is in Bloomington, close to Indiana University and downtown. Its existing loading infrastructure, temperature-controlled interior, and expansion area support a range of storage and commercial uses.
Key Highlights
- 15,400‑square‑foot warehouse with climate‑controlled space
- Exterior loading dock with garage door access
- Three restrooms and ample parking
Financial Insights
Estimated NOI and Cap Rate
NOI / Yr
$110,567
Cap Rate
5.98%
Suggested Prices Based on Cap Rates
Cap Rate 5%
$2,211,340
$2.2M
Cap Rate 7%
$1,579,529
$1.6M
Cap Rate 9%
$1,228,522
$1.2M
Market Conditions
NOI Build-Up for 15,400 SF
Gross rent
$146.0K $9.48/SF
− Vacancy
−$15.9K −$1.03/SF
EGI
$130.1K $8.45/SF
− OpEx
−$19.5K −$1.27/SF
NOI
$110.6K $7.18/SF
Area
Monroe County, IN
Vacancy
10.90%
Lease Rate
$9.48 /SF/Yr
Expense Ratio
15.00%
Simulate Cap Rate and NOI
Suggested Prices Based on Cap Rates
Cap Rate 5%
$2,211,340
Cap Rate 7%
$1,579,529
Cap Rate 9%
$1,228,522
Alternative Uses
Best Use
Warehouse
$1.58M
$1.38M – $1.84M
NOI $110,567 @ 7.0% cap · market cap 5.98%
Second Best
—
—
no second resolved use
Theoretical Best
Office A
$3.01M
$2.63M – $3.51M
NOI $210,681 @ 7.0% cap · market cap 11.39%
Zoning and permitted uses should be independently verified with authorities.
How Realmo checks its estimates
Property Analytics
Unlock full access to Insights
Subscribe to Realmo Intelligence
Open Analytics
Current Use
Location Intelligence
Trade Area within ½ mile
769
Businesses Nearby
Balanced
Demand for This Use
Explore this area
Business Placement
Demographics for 47404, IN
23,799
Population
12,101
Households
2
Avg Household Size
33
Median Age
43%
College-Educated
95%
High-School Grad
52.6 sq mi
ZIP Area
452
Density / Sq Mi
$54,674
Median Household Income
$36,725
Median Earnings
$1,159
Median Rent
$243,500
Median Home Value
Check the figures for this property
Cap Rate, Value Estimation, Potential NOI and more
View Realmo Analytics
Market
Vacancy Rate% for Industrial in Midwest region







Similar Off Market Nearby
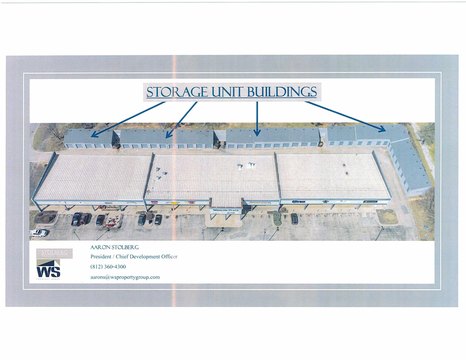
- Straight Outta Storage — 1503 W Arlington Rd, Bloomington, IN 47404
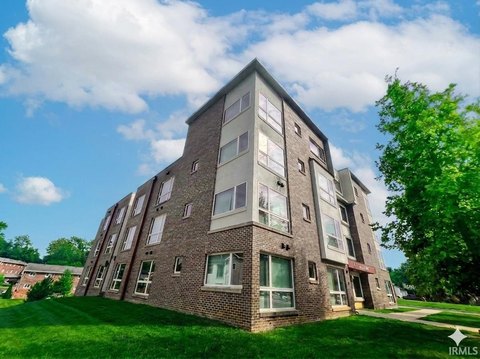
- Bloomington Miniwarehouse — 1117 N Jackson St, Bloomington, IN 47404
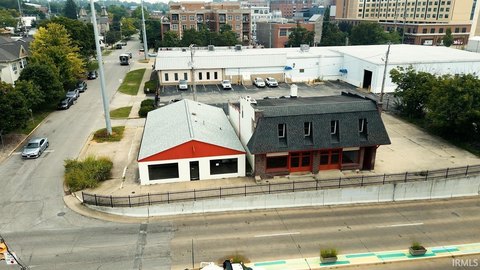
- Virtu360 - 3D Virtual Tours — 1329 N Woodburn Ave, Bloomington, IN 47404
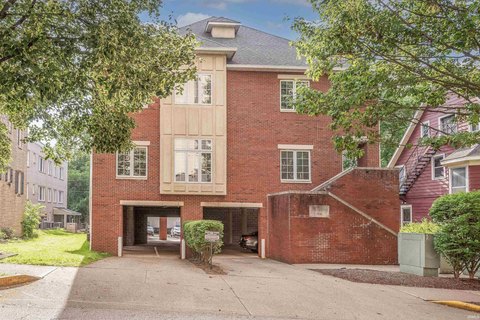
- Storage Express — 606 W Gourley Pike, Bloomington, IN 47404
Frequently Asked Questions
What type of property is this?
Warehouse - Industrial building with loading dock access, three restrooms, and parking.
Where is this warehouse located?
The property is located at 1430 N Willis Dr Bloomington, IN.
What is the asking price?
The asking price for this property is $1,850,000.
What are key features of this property?
This property features: 15,400‑square‑foot warehouse with climate‑controlled space; Exterior loading dock with garage door access; Three restrooms and ample parking


