Renovated Standalone Office
For Sale
$494,999
1420 Linwood Boulevard, Oklahoma City, OK 73106
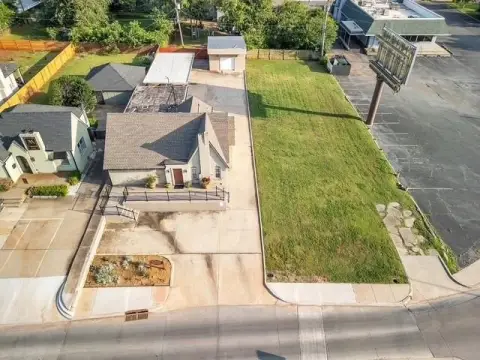
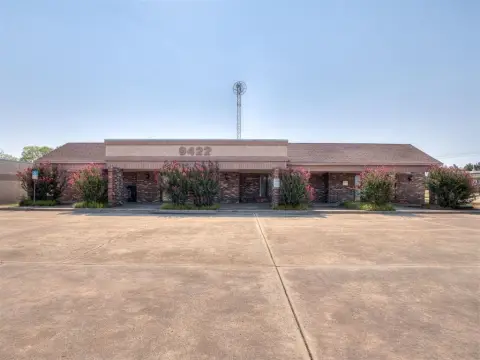
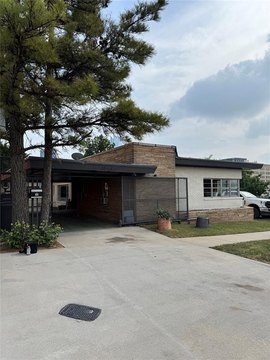
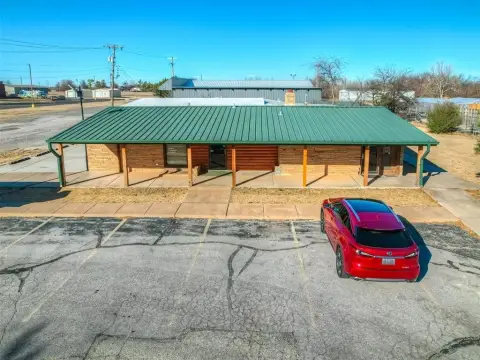
Standalone professional office with private gated parking, separate entrances, and a fully renovated interior.
Property Size1,920 SF
Price / SF$257.81
Days on Market49
Property Features for 1420 Linwood Boulevard
General Information
Standard status
Active
Size
1,920 SF
Building Details
Year Built
1955
Buildings
1
Listing Agency:
ERA Courtyard Real Estate
Listed By:
Jennifer Aguilar · License #179195
(405) 388-6545
Source:
Sarahflemingestates
Added: Sep 6
Changed: Oct 2
Last Checked: Oct 7 at 1:45PM
Displayed information is deemed reliable but is not guaranteed and should be independently verified. All listing content including descriptions, pricing, images are the copyrighted material of ERA Courtyard Real Estate

Ask AI about this property
Review the available facts, identify missing information and prepare questions for the agent.
Investment Insights
Based on property information with market context.
This standalone office property provides nearly 2,000 square feet of renovated professional space on a corner lot. The layout includes a front reception area, four dedicated offices, a glass-enclosed conference room, a shared work area with built-in desk, and a finished kitchen. An executive office includes a private entrance and full bathroom with shower. Wood flooring, designer lighting, stone countertops, and upgraded cabinetry contribute to the finished interior. Separate front and rear entries support visitor access from the street and direct circulation to the secured parking area.
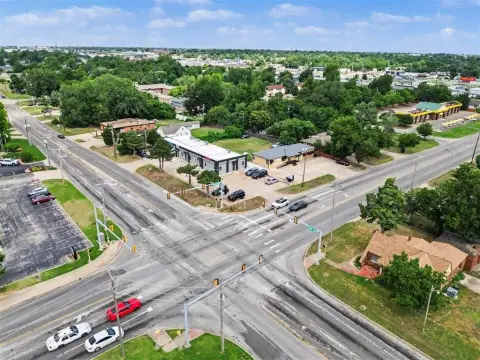
Major building improvements include new mechanical systems, a new roof, tankless hot water, energy-efficient upgrades, and an installed security system with cameras. The property also offers adjacent street parking and sits minutes from Midtown and Downtown Oklahoma City.
Major building improvements include new mechanical systems, a new roof, tankless hot water, energy-efficient upgrades, and an installed security system with cameras. The property also offers adjacent street parking and sits minutes from Midtown and Downtown Oklahoma City.
Key Highlights
- Nearly 2,000 square feet of renovated office space
- Four dedicated offices plus a glass‑enclosed conference room
- Executive suite with private entrance and full bathroom with shower
Financial Insights
Estimated NOI and Cap Rate
NOI / Yr
$27,316
Cap Rate
5.52%
Suggested Prices Based on Cap Rates
Cap Rate 5%
$546,320
$546.3K
Cap Rate 7%
$390,229
$390.2K
Cap Rate 9%
$303,511
$303.5K
Market Conditions
NOI Build-Up for 1,920 SF
Gross rent
$47.9K $24.96/SF
− Vacancy
−$11.5K −$5.99/SF
EGI
$36.4K $18.97/SF
− OpEx
−$9.1K −$4.74/SF
NOI
$27.3K $14.23/SF
Area
Oklahoma City, OK
Vacancy
24.00%
Lease Rate
$24.96 /SF/Yr
Expense Ratio
25.00%
Simulate Cap Rate and NOI
Suggested Prices Based on Cap Rates
Cap Rate 5%
$546,320
Cap Rate 7%
$390,229
Cap Rate 9%
$303,511
Alternative Uses
Best Use
Office B
$390.2K
$341.5K – $455.3K
NOI $27,316 @ 7.0% cap · market cap 5.52%
Second Best
—
—
no second resolved use
Theoretical Best
Specialty Retail
$656.6K
$574.6K – $766.1K
NOI $45,965 @ 7.0% cap · market cap 9.29%
Zoning and permitted uses should be independently verified with authorities.
How Realmo checks its estimates
Property Analytics
Who owns this building?
See the owner, sales and loan history
Open Analytics
Current Use
Location Intelligence
Trade Area within ½ mile
1,535
Businesses Nearby
Explore this area
Business Placement
Demographics for 73106, OK
12,956
Population
6,069
Households
2.1
Avg Household Size
32
Median Age
40%
College-Educated
85%
High-School Grad
3.0 sq mi
ZIP Area
4,319
Density / Sq Mi
$51,934
Median Household Income
$32,145
Median Earnings
$1,050
Median Rent
$262,500
Median Home Value
Check the figures for this property
Cap Rate, Value Estimation, Potential NOI and more
View Realmo Analytics
Market
Vacancy Rate% for Office in Oklahoma City, OK





Frequently Asked Questions
What type of property is this?
Office building - Standalone professional office with private gated parking, separate entrances, and a fully renovated interior.
Where is this office building located?
The property is located at 1420 Linwood Boulevard Oklahoma City, OK.
What is the asking price?
The asking price for this property is $494,999.
What are key features of this property?
This property features: Nearly 2,000 square feet of renovated office space; Four dedicated offices plus a glass‑enclosed conference room; Executive suite with private entrance and full bathroom with shower


